
How Did Buffett Get a 3% Yield on a Stock Paying 0.4%? Yield on Cost.
The most misunderstood number in dividend investing, explained with numbers straight from the filings.

Buy Apple today and the dividend yield you collect is under half a percent. Berkshire Hathaway, sitting on shares it bought years ago, collects more than 3% on the very same stock.
Same company. Same dividend check. Wildly different yield.
That gap is yield on cost, and it is one of the most misunderstood numbers in dividend investing. Today you will learn how to calculate it, what it actually tells you, where it quietly lies to you, and how to use it without letting it lull you to sleep.
In today’s post, we will discuss:
What yield on cost actually measures
Buffett’s Apple stake, a real yield-on-cost story
Yield on cost for S&P Global and Procter & Gamble
How to use yield on cost in your process
The yield-on-cost trap most investors fall into
Okay, let’s dive in and learn more about yield on cost.
What yield on cost actually measures
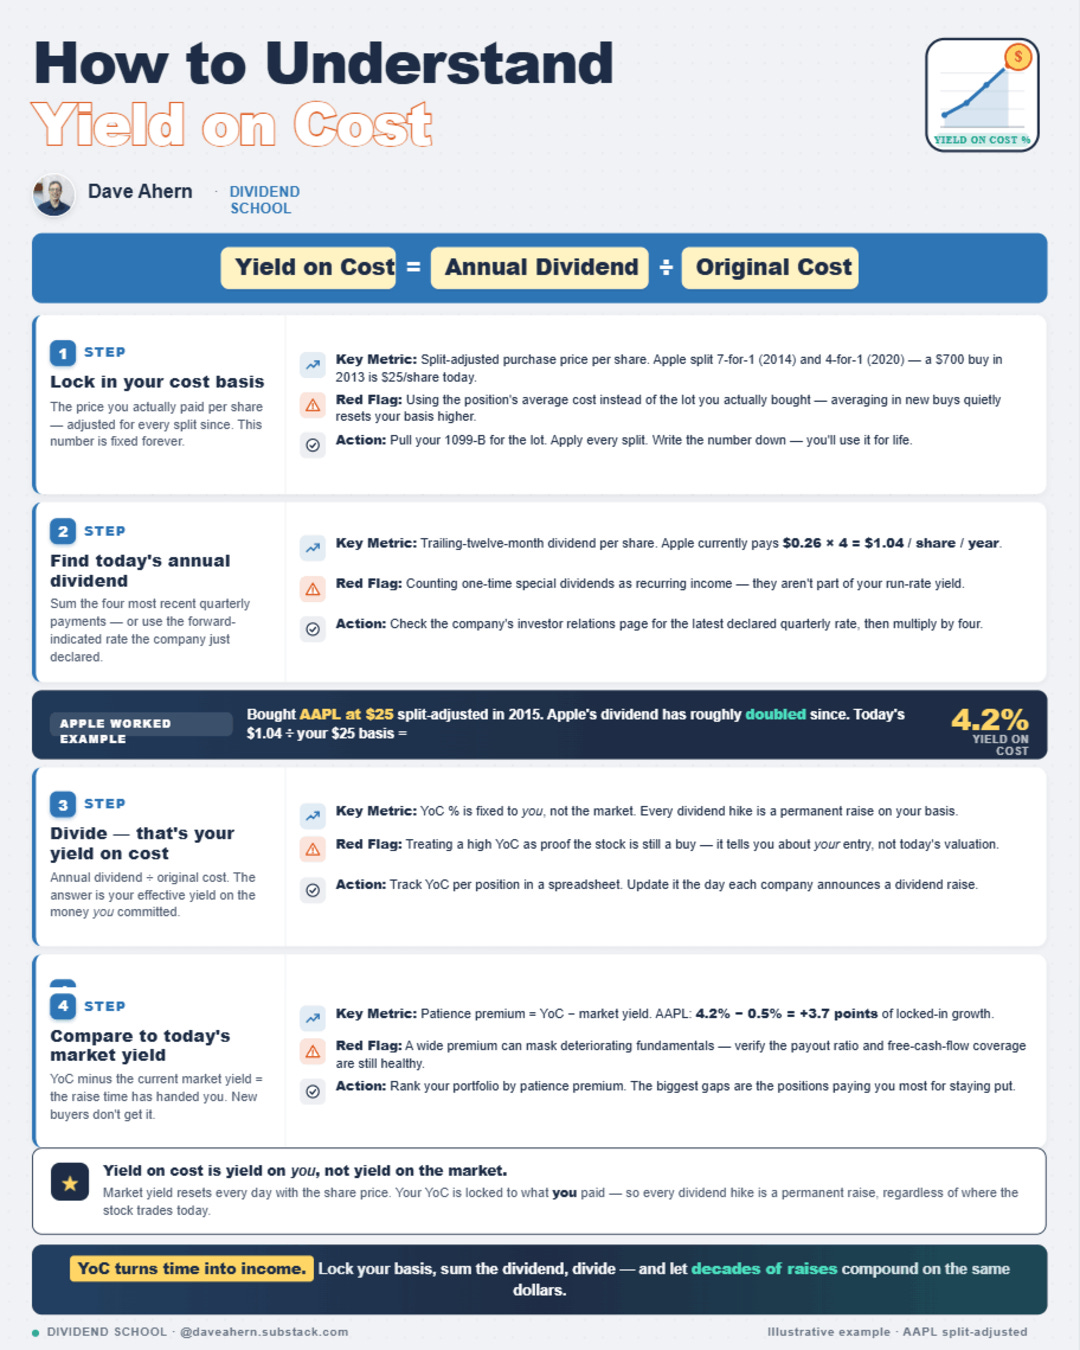
Most investors know the current yield. You take a company’s annual dividend and divide it by today’s share price.
A $4 annual dividend on a $100 stock is a 4% current yield. Simple.
Yield on cost changes one input. You keep the annual dividend on top, but divide by the price you paid, not the current price.
The formula:
Yield on cost = current annual dividend per share / your original purchase price per share
Here is the part that matters. Your purchase price never changes. It is frozen the day you buy. The dividend, for a healthy company that raises its payout, climbs every year.
So the numerator grows while the denominator stays still. Yield on cost rises over time, all on its own, as long as the company keeps lifting the dividend.
Picture buying a stock at $50 that pays a $1 dividend. Day one, your current yield and your yield on cost are both 2%. Ten years later, the dividend has grown to $2.50. A new buyer at the higher price might still see a 2% current yield. At your $50 cost, you are now earning 5%.
You did nothing. The company did the work.
That is the whole appeal of yield on cost, and also the source of every mistake people make with it.
Buffett’s Apple stake, a real yield-on-cost story
Berkshire Hathaway first disclosed an Apple position in 2016. Buffett kept buying, and Berkshire’s own filings put the math beyond debate.
Through the end of 2021, Berkshire had spent about $31.1 billion to acquire the roughly 908 million Apple shares it held, a cost basis Berkshire has disclosed in its SEC filings (reported via Berkshire’s Q2 2024 Form 10-Q). That works out to an average cost of roughly $34.25 per share.
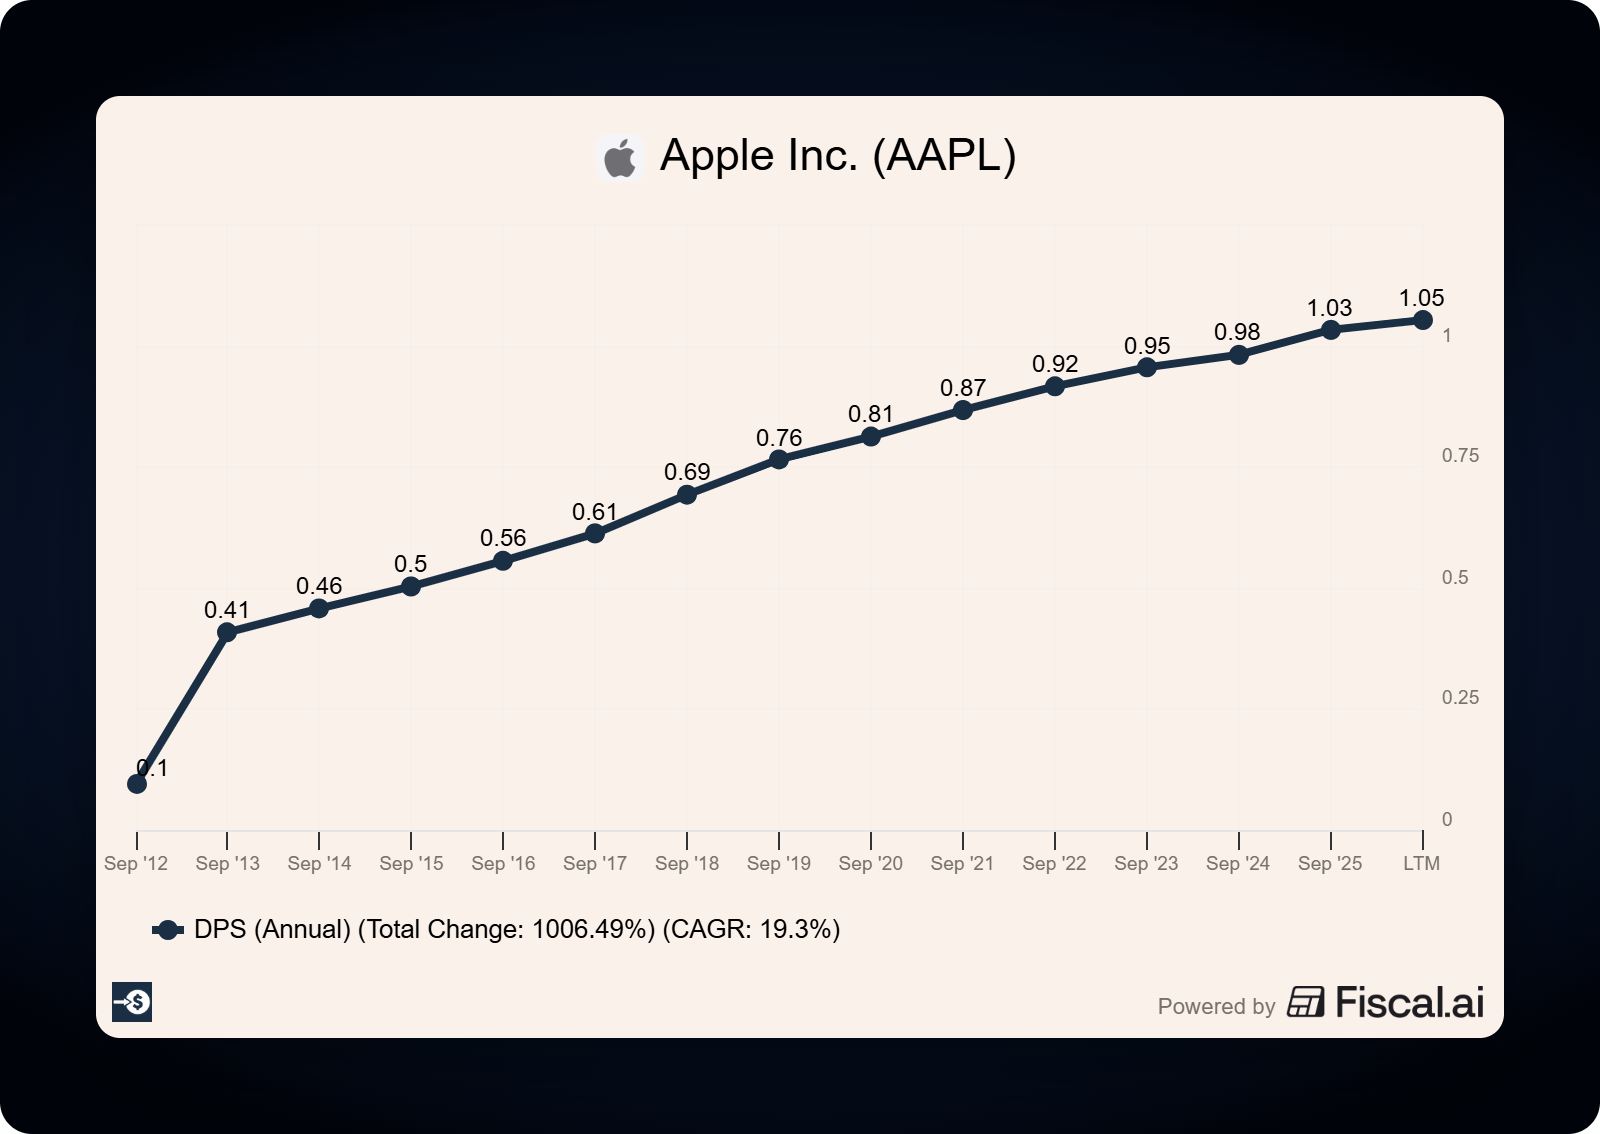
Now look at the dividend side, straight from Apple’s filings.
Apple’s fiscal 2025 Form 10-K (year ended September 27, 2025) shows a quarterly cash dividend of $0.26 per share, raised from $0.25 in May 2025. Apple’s fiscal second-quarter 2026 reporting then raised it again, from $0.26 to $0.27 per share. That puts the current annualized dividend at $1.08 per share.
Here is the scorecard:
Berkshire’s average cost: roughly $34.25 per share
Apple’s current annualized dividend: $1.08 per share
Berkshire’s yield on cost: about 3.15%
A new buyer near $275 (the price an Apple executive filed for an open-market sale in April 2026, per Form 4): about 0.39%
The same $0.27 quarterly check lands in both accounts. Berkshire’s version is worth roughly 8 times as much as a percentage, purely because of the price Buffett paid 9 years earlier.
This is the lesson Buffett has taught for decades, made concrete. A wonderful business bought at a fair price keeps paying you more every year on a cost that never moves.
One honest note. Berkshire trimmed its Apple position heavily in 2024, which is a separate capital-allocation decision about portfolio size and valuation. The yield-on-cost point rests on the shares still held: time and a rising dividend have turned a modest starting yield into a strong one.
Already on the list? Skip ahead. If not: the rest digs into S&P Global and P&G, and the spot where yield on cost quietly lies to you. It's free to get the next one in your inbox too.
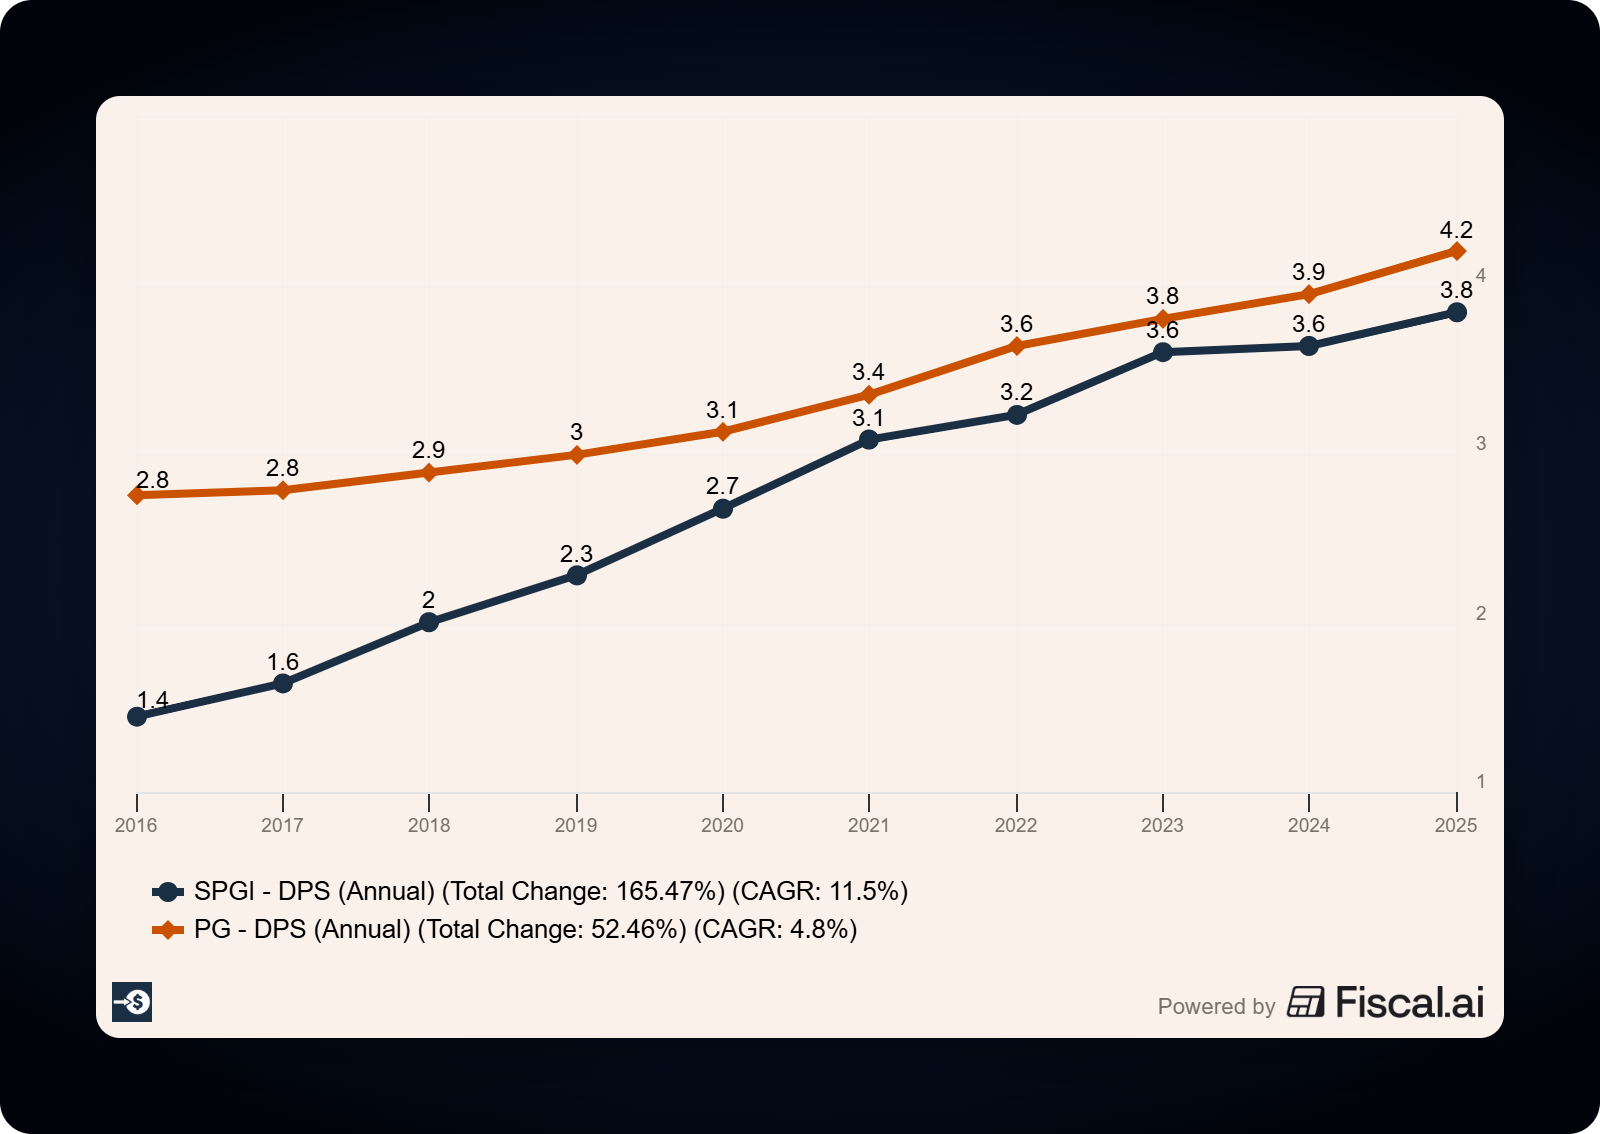
Yield on cost for S&P Global and Procter & Gamble
Apple is a young dividend payer. The effect becomes dramatic when you look at companies that have raised their dividends for half a century.
S&P Global (SPGI) is one of fewer than 30 names in the S&P 500 that have lifted their dividend every year for more than 50 years. The company has raised its payout for 53 consecutive years and has paid a dividend every year since 1937.
S&P Global’s fiscal 2024 Form 10-K (year ended December 31, 2024) describes its policy of regular quarterly cash dividends, and the company’s fourth-quarter 2024 dividend ran at $0.91 per share, an annualized rate of $3.64. The most recent declared rate is $0.97 per quarter, for an annualized rate of $3.88.
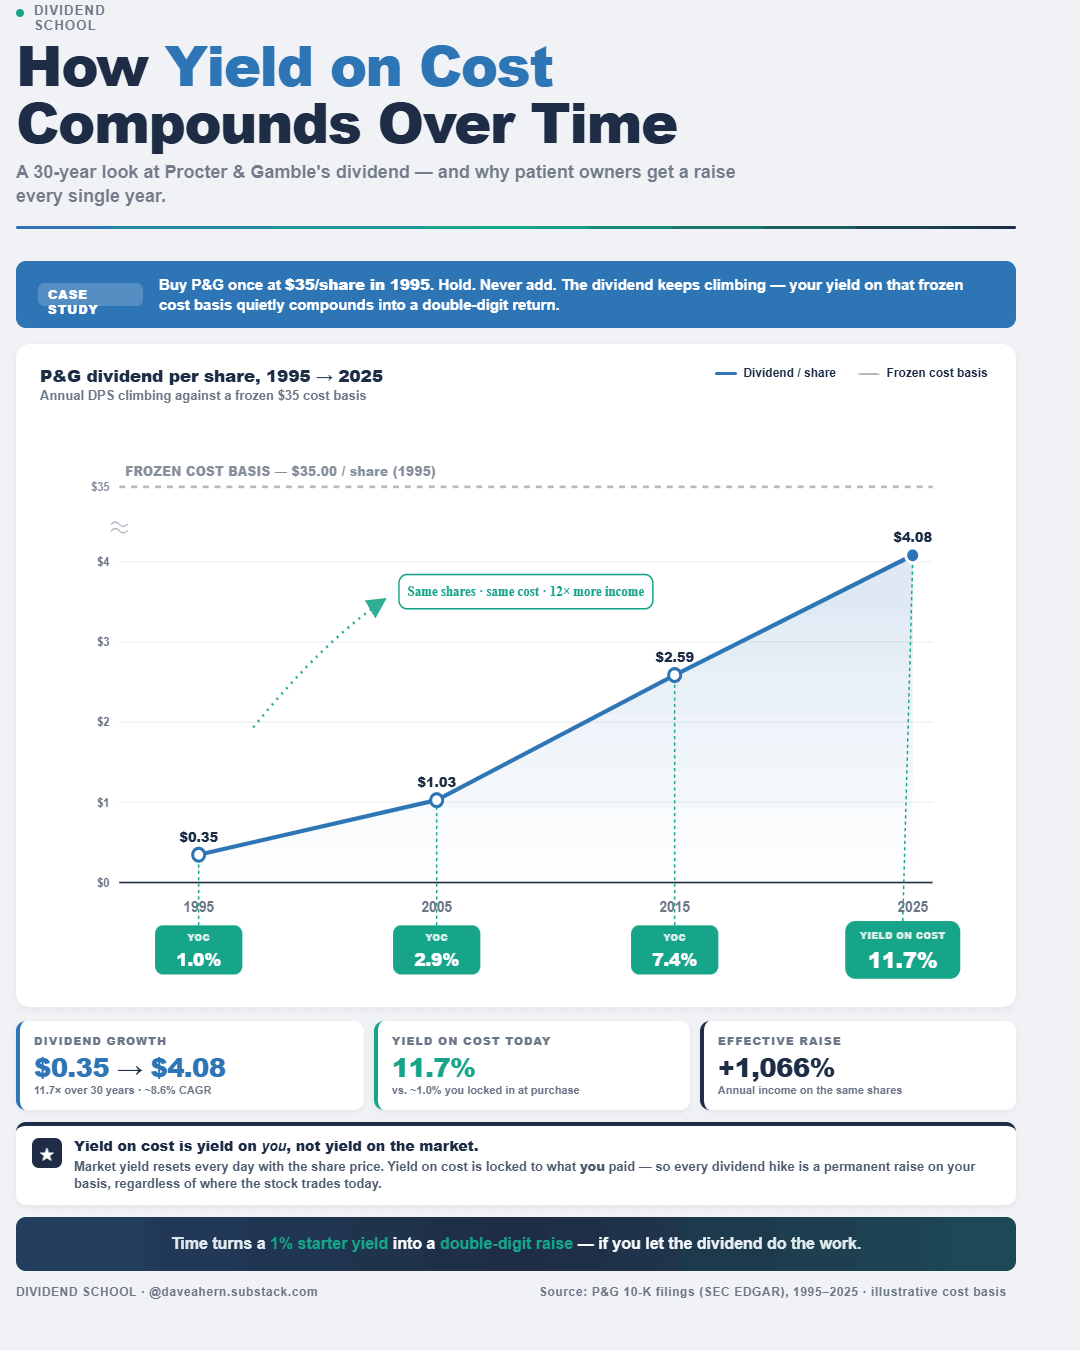
Procter & Gamble (PG) is the textbook case, and its own 10-K hands us the numbers.
P&G’s fiscal 2025 Form 10-K (year ended June 30, 2025) prints a split-adjusted dividend-per-share history that is worth studying slowly:
1956: $0.01
1965: $0.03
1975: $0.06
1985: $0.16
1995: $0.35
2005: $1.03
2015: $2.59
2025: $4.08
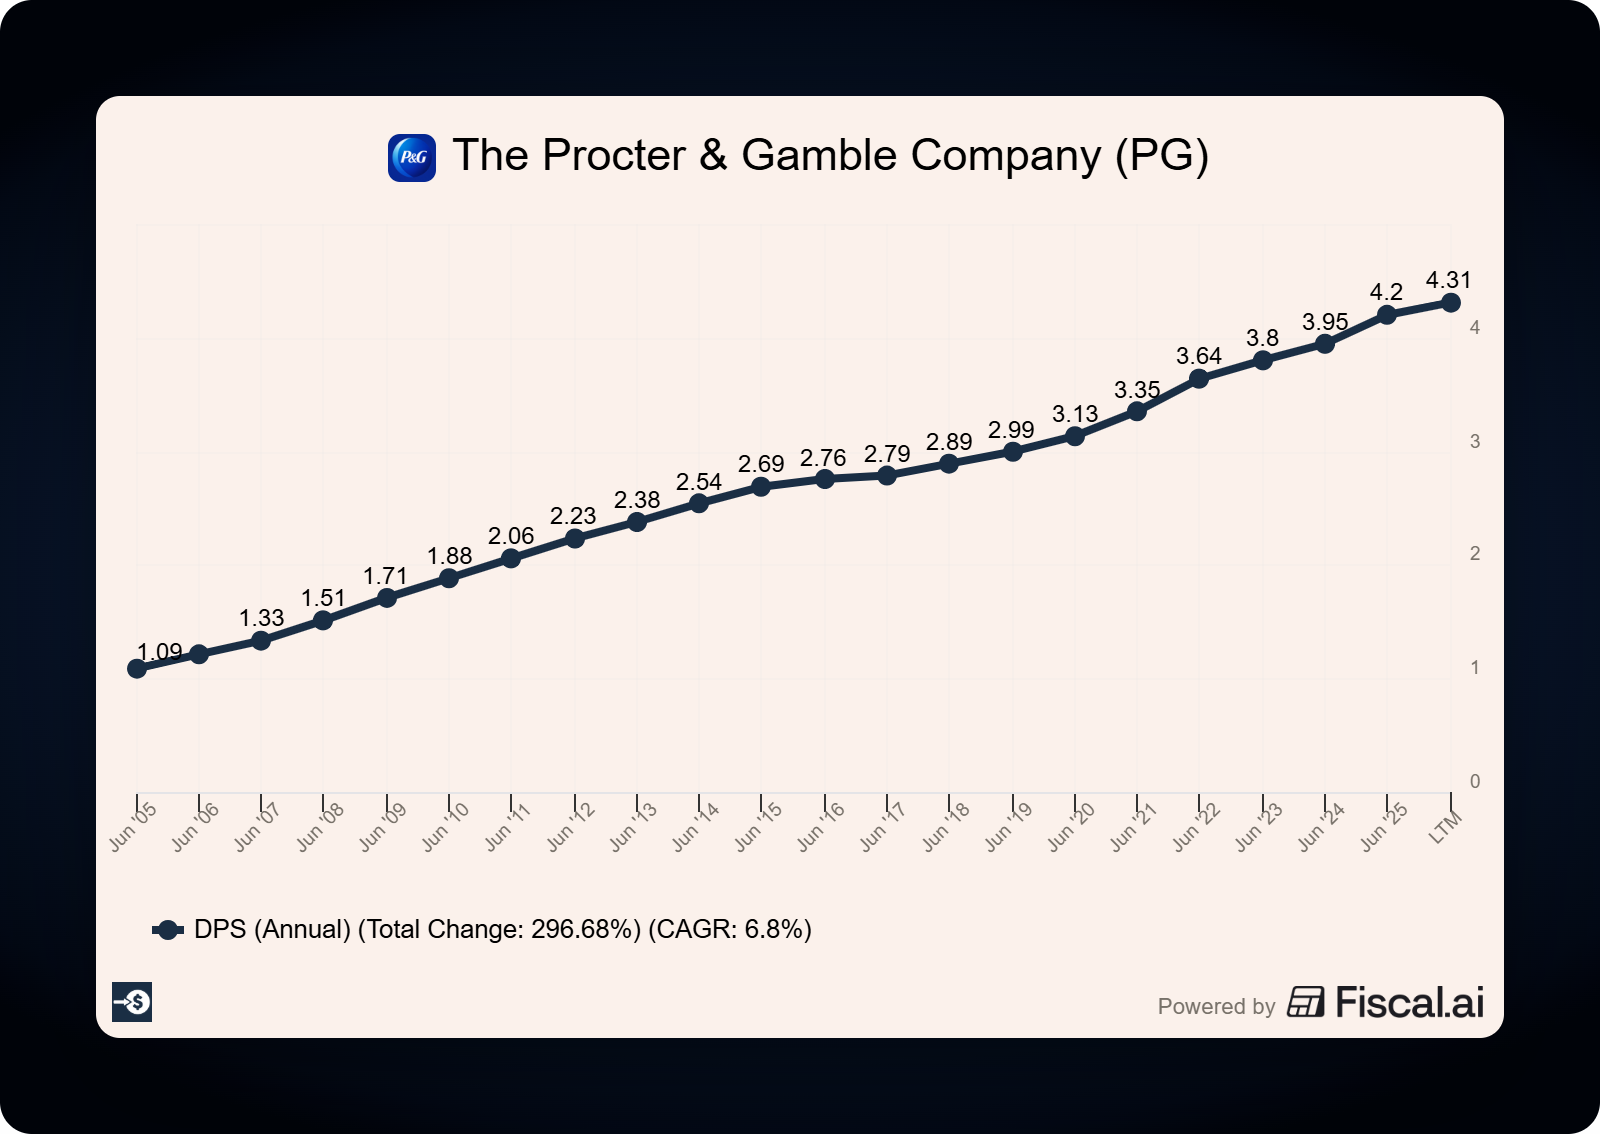
The same filing notes 69 consecutive years of dividend increases, 135 straight years of paying a dividend, and a 5% annual compound growth rate over the past decade. P&G’s board declared a quarterly dividend of $1.0568 per share in October 2025, for an annualized rate of $4.2272.
Now let’s put yield-on-cost to work on these two. Your own cost basis is the only number you can provide, so the prices below are illustrative. Plug in what you actually paid.
Say you bought P&G in 2015 for around $80 a share. Per the 10-K table, the dividend that year was $2.59, so your starting yield was about 3.2%. With the dividend now at $4.2272 annualized:
Original cost (illustrative): $80
Current annualized dividend (FY2025 10-K basis): $4.2272
Yield on cost today: about 5.3%
Run the same exercise on S&P Global with an illustrative $95 cost from a 2015 purchase and the current $3.88 annualized rate, and your yield on cost lands near 4.1%, climbing every year the streak continues.
The dividend growth is real and SEC-verified. The starting price is yours to set, and it determines your entire yield-on-cost path from day one.
How to use yield on cost in your process
Yield on cost earns its keep as a feedback tool, not a buy signal. Here is where I lean on it.
It shows dividend growth working. When your yield on cost climbs year after year, you are watching a compounding income stream in real time. That is motivating, and it keeps long-term holders from fidgeting out of great businesses.
It tracks income against a goal. If you need a portfolio to throw off a certain dollar income in retirement, yield on cost tells you how close your existing positions are to getting the money you already committed.
It pairs with the dividend growth rate. A 3% yield on cost, growing the dividend at 8% a year, is a very different animal from a 5% yield on cost, growing at 1%. Always look at the trend, not the snapshot.
What I do not do is use yield-on-cost to decide whether to add to a position. Fresh money buys at today’s price, so fresh money earns today’s current yield. New capital does not care what you paid in 2015.
When you evaluate buying more shares, current yield and the underlying fundamentals are the honest inputs. Yield on cost is a scoreboard for capital already in the game.
The yield-on-cost trap most investors fall into
Here is where yield on cost gets dangerous, and it is worth slowing down for.
The number almost always rises. Any company that never cuts its dividend will hand you a higher yield on cost every single year, no matter how mediocre the business has become. That built-in optimism flatters you.
A stagnating company can still show you a beautiful 7% yield on cost while its stock goes nowhere for a decade. The high number whispers that everything is fine. The stock chart says otherwise.
Yield on cost also ignores opportunity cost entirely. Money is fungible. The question that matters is what your capital could earn if it were redeployed today, valued at today’s price and today’s current yield, somewhere with better prospects.
Think of it like Buffett’s savings-account framing from his shareholder letters. A frozen cost basis can make a low-return account look generous because you are measuring against a deposit you made long ago. The market does not pay you based on what you paid. It pays you based on what the business does next.
Total return is the honest scorekeeper. A position with a stunning yield on cost that has badly lagged the market for years is not a success story, regardless of how the income line looks.
Use yield-on-cost to celebrate compounding and track income. Keep total return and current fundamentals as the judges of whether each business still deserves your capital.
What this means for your investing process
Buy quality businesses that raise the dividend, hold them long enough for the math to work, and your yield on cost will climb on its own, but never let a rising number talk you out of asking whether the business still earns its place in your portfolio.
That is going to wrap up our discussion for today.
As always, thank you for taking the time to read this post, and I hope you find something of value on your investing journey.
If I can further assist, please don’t hesitate to reach out.
Until next time, take care and be safe out there,
Dave
Do you want to think clearly about dividends? Do you want one careful, numbers-first read each week? Do you want it free, with no hype? Then come along.
Hello how are you doing today my friend