
How Costco Turns Inventory Into Float: A Case Study in Capital-Light Retail

Most retailers live and die by inventory. Costco turned it into a structural advantage. By pairing rapid turns with member-funded float, the company sustains high returns on invested capital and outsized cash generation, without needing a levered balance sheet or premium gross margins.
This is a practical accounting case study on how to read inventory discipline and translate GAAP profit into owner earnings.
TL;DR
Costco’s working-capital model is a moat element: fast turns, minimal receivables, and supplier financing keep invested capital low and ROIC high.
Owner earnings reconcile from GAAP by adjusting for non-cash items, working capital, and maintenance capex; for Costco, FCF conversion is robust.
The ROIC spread is wide compared to a typical retail WACC, driven by high capital turns rather than margin.
Per-share framing matters: stable share count, periodic special dividends, and modest buybacks highlight a shareholder-friendly capital allocation record.
Beware false positives: inventory “improvements” from stockouts, pulling payables forward, or deferring capex are not durable.
You can replicate this analysis with 10-K data: compute DIO/DPO/DSO, CCC, ROIC (with clear definitions), and a GAAP→owner-earnings bridge.
Why it matters
In quality investing, durability beats drama. Durable compounding typically comes from:
ROIC consistently above WACC
Reinvestment runway with disciplined capital intensity
Clean unit economics that convert to cash
Per-share value creation, not just headline growth
Retail is often seen as commoditized. Costco demonstrates how a member model, operating discipline, and working capital design compound into real economic returns. Where investors go wrong: they focus on gross margins, not capital turns; net income, not cash; growth, not per-share economics.
Base rate context:
Mature, scaled retailers often run low single-digit operating margins.
The winners drive high asset turns and supplier/customer float, compressing invested capital and elevating ROIC.
Shareholder yield at quality retailers tends to come in periodic bursts (special dividends) and modest buybacks when shares are expensive, but a consistent base dividend.
Core concepts
ROIC vs WACC and value creation
ROIC measures returns on operating capital deployed. A simplified formula:
ROIC = NOPAT / Invested Capital
where
NOPAT = operating income × (1 – tax rate). Invested Capital definitions vary; be consistent.
WACC is the blended cost of debt and equity. For large, stable US staples retailers, a 7–8% range is a reasonable starting assumption; compute specifically if modeling.
Value creation occurs when ROIC > WACC, sustained.
Reinvestment runway and capital intensity
Costco grows via new warehouses, category expansion, and international. Capex adds capacity; unit economics decide whether added capital compounds value.
Capital intensity matters: each new unit should pay back quickly and not drag CCC.
Unit economics and per-share metrics
Measure membership fees (recurring, high-margin), warehouse-level returns, and FCF per share.
Per-share framing filters out optical growth from issuance; track diluted shares, SBC, and buybacks.
Moat durability and evidence (not claims)
Evidence for Costco: retention through membership renewal rates, stable margin bands, pricing power via everyday low prices, strong vendor relationships, scale advantage, and predictable inventory turns.
Don’t rely on claims; look for multi-year margin stability, consistent turn efficiency, and renewal pace in filings.
Mode focus: accounting nuances and economic reality
Build bridges:
GAAP net income → Owner earnings (a proxy for distributable cash after maintenance)
Margin × Capital turns → ROIC (DuPont-style decomposition)
Working capital cycle (DSO/DIO/DPO) → CCC and float
Worked example or mini case
Company: Costco Wholesale (NASDAQ: COST), a US warehouse-club retailer with a membership model.
Key FY2024 facts (as of Sep 1, 2024 per 10-K unless noted):
Net sales: $249.6B; membership fees: $4.83B Costco FY2024 press release (as of Sep 26, 2024).
Operating income: $9.29B; Net income: $7.37B; Diluted EPS: $16.56 Costco 10-K (as of Sep 1, 2024).
Cash from operations: $11.34B; Capex: $4.71B; FCF (OCF–Capex): ~$6.63B (as of FY2024 10-K).
Cash & equivalents: $9.91B; Total debt: ~$5.90B; Share count ~444.8M diluted 10-K.
Special dividend paid Dec 2023 contributed to ~$9.04B total cash dividends in FY2024 [10-K cash flow statement] (as of FY2024).
SBC: $818M [10-K cash flow statement] (as of FY2024).
Working capital discipline
Inventories (ending): $18.65B; Accounts payable: $19.42B in FY2024 [10-K balance sheet]. Payables exceed inventories, indicating vendor financing.
Receivables are minimal for a retailer, reflecting cash-like sales and co-brand credit arrangements.
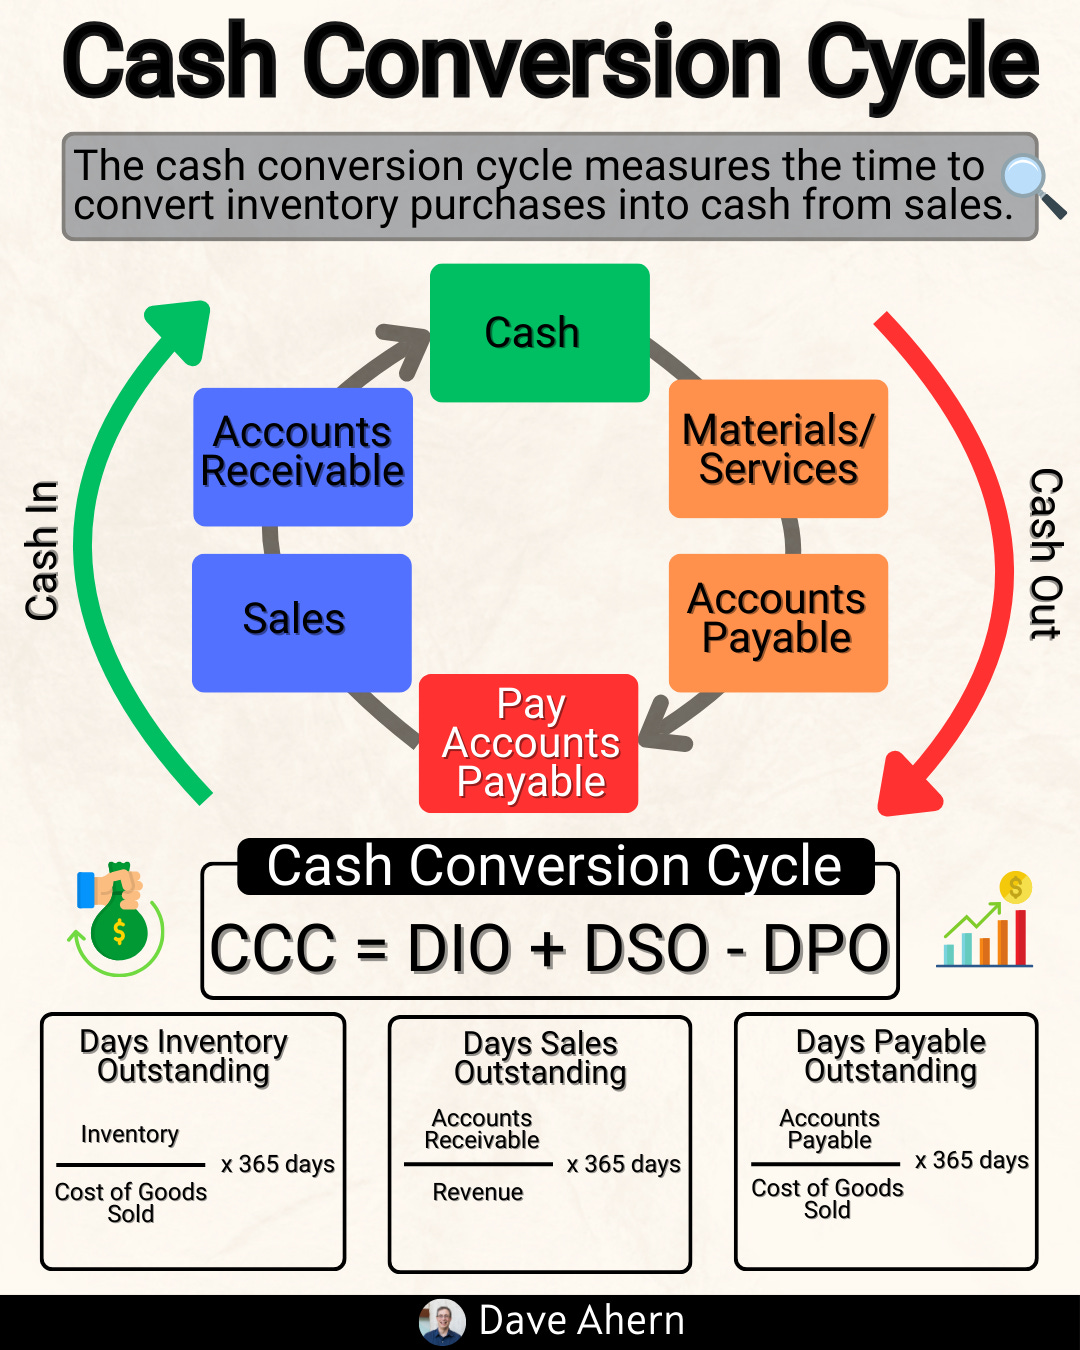
Compute the cash conversion cycle (CCC) using FY2024 data (approximate; seasonality applies):
DIO:
DIO ≈ Avg Inventory / COGS ×365 ≈ 222.36 17.65×365 ≈ 29 days
DPO:
DPO ≈ Avg A/P / COGS ×365 ≈ 222.36 18.45 ×365 ≈ 30 days
DSO:
DSO ≈ Avg AR / Sales ×365 ≈ 249.63 2.50 × 365 ≈ 3.7 days
CCC:
CCC ≈ DIO+DSO−DPO ≈ 29+3.7 − 30 ≈ 2 days
Interpretation: near-zero CCC (often slightly negative/positive depending on period) is a strength—it means the business is largely customer- and vendor-financed rather than equity/debt-financed. It supports high capital turns.
ROIC snapshot (simplified)
NOPAT (approx): operating income × (1 – effective tax rate).
Tax rate proxy: income tax provision / pre-tax income ≈ 2.37/9.74 ≈ 24.4% [10-K income statement].
NOPAT ≈ 9.29 × 0.756 ≈ $7.0B.
Invested capital (simplified): debt + equity – cash
FY2024: (5.90 + 23.62 – 9.91) ≈ $19.6B
FY2023: (6.46 + 25.06 – 13.70) ≈ $17.8B
Average ≈ $18.7B
ROIC ≈ 7.0 / 18.7 ≈ ~37% (method varies; this is a common “net capital employed” proxy). If you include other operating liabilities, you can get even lower invested capital and higher ROIC; be consistent and transparent about the definition.
ROIC spread
If you assume WACC ~7–8% for a large, low-beta US staples retailer, Costco’s ROIC spread is materially positive. This spread has been sustained over time, driven primarily by capital turns rather than margins.
Per-share framing and capital allocation
Diluted shares were ~445M in FY2024, largely flat year over year [10-K].
Regular dividends plus periodic specials: FY2024 included a substantial special dividend (total cash dividends ~$9.04B) while free cash flow remained strong [10-K].
Buybacks were modest ($0.7B) in FY2024; management has historically favored specials when cash accumulates.
SBC was $818M; watch dilution but note share count stability suggests offset via repurchases or limited issuance.
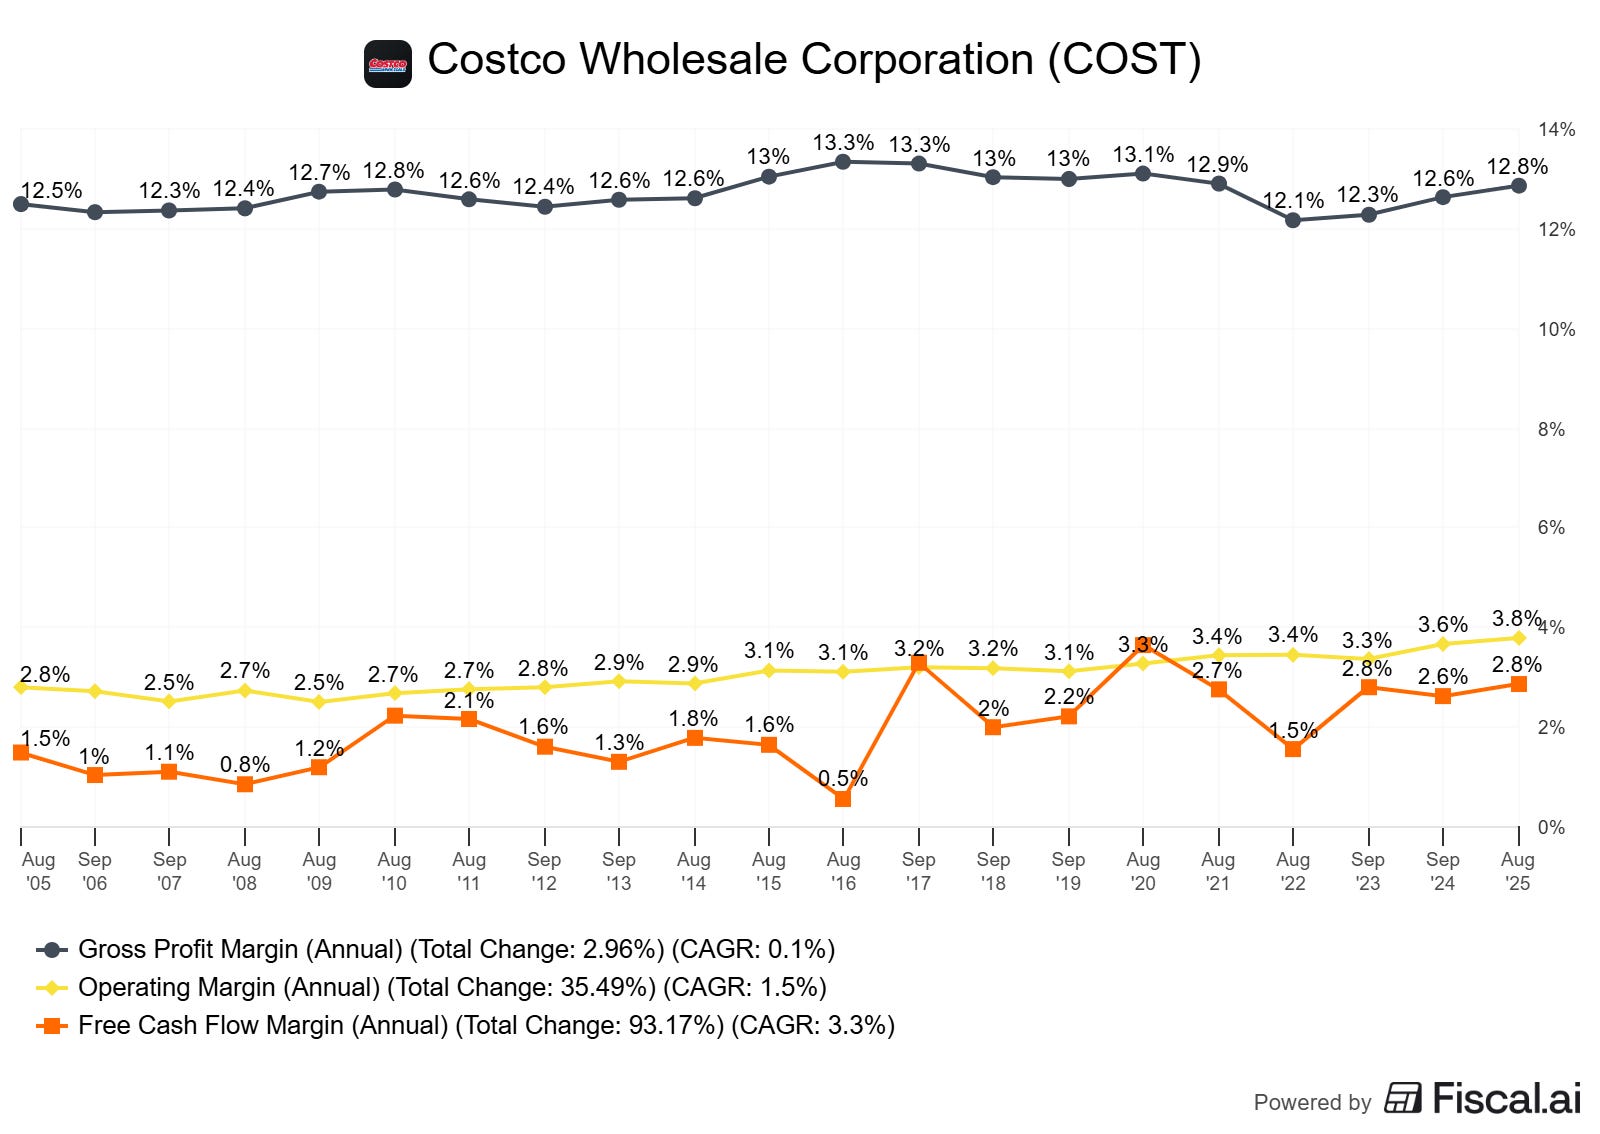
Margin bands
Gross margin ~11%; operating margin ~3.7%; net margin ~3.0% in FY2024. Trend has improved modestly over the past 5–6 years despite cost pressures, which is notable for a scale retailer Macrotrends margin series (as of May 31, 2025).
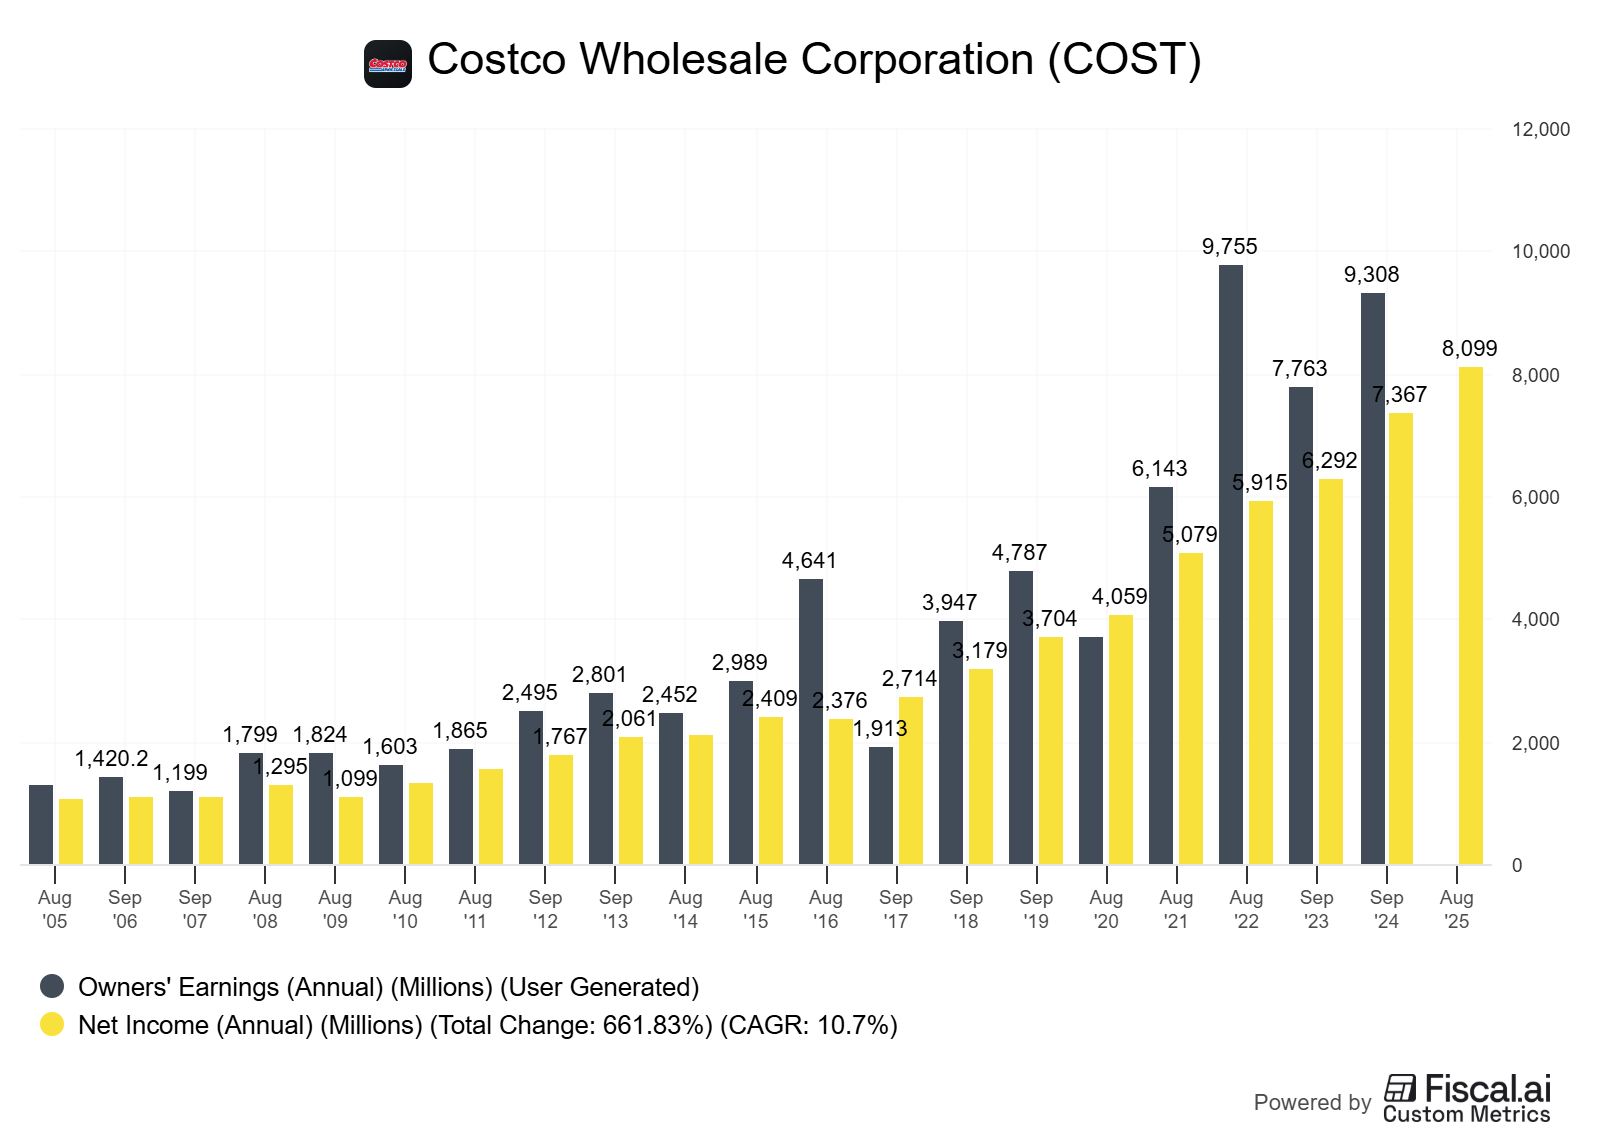
Owner earnings reconciliation (FY2024, illustrative)
Start with net income: $7.37B
Add back D&A: +$2.24B
Adjust working capital: +$0.61B (from cash flow statement)
Subtract maintenance capex: unknown; assume a range.
Conservative proxy 1: maintenance capex ≈ depreciation → ~$2.24B
Proxy 2: maintenance capex = 50–60% of total capex when expanding rapidly → ~$2.35–$2.83B of $4.71B
Owner earnings range:
Using Proxy 1: ~$7.37 + 2.24 + 0.61 – 2.24 ≈ $8.0B
Using Proxy 2 (midpoint 55%): ~$7.37 + 2.24 + 0.61 – 2.59 ≈ $7.63B
FCF (unadjusted): OCF $11.34B – Capex $4.71B ≈ $6.63B
Takeaway: owner earnings are robust and broadly consistent with high FCF conversion (context: 90%+ of net income). Assumptions matter; disclose them.
Caveats and alternative interpretations
CCC can swing by a few days around fiscal year-end due to timing and 52/53-week effects; use multi-year averages.
ROIC definitions vary; be explicit. Including/excluding operating leases and deferred membership fees changes the denominator.
Owner earnings hinge on maintenance capex estimates; triangulate via store maturity schedules, remodel cadence, and management commentary.
How to do this yourself (step-by-step guide)
Gather data (primary sources)
Latest 10-K/20-F: income statement, balance sheet, cash flow statement.
Notes on revenue composition, membership/deferred revenue, lease accounting, capex guidance.
Investor releases for membership fees, renewal rates.
Optional valuation context: Yahoo Finance for EV/EBITDA, enterprise value; Macrotrends or filings for margin history.
Costco investor relations: Annual report and 10-K Costco Annual Reports (as of 2024).
FY2024 10-K filing SEC (as of Sep 1, 2024).
FY2024 results release Costco IR (as of Sep 26, 2024).
EV/EBITDA snapshot Yahoo Finance (as of Oct 7, 2025).
Compute working-capital cycle
DIO = Avg inventory / COGS × 365
DPO = Avg accounts payable / COGS × 365
DSO = Avg receivables / Net sales × 365
CCC = DIO + DSO – DPO
Decision rule: prefer CCC ≤ 10 days (or negative) and stability across cycles. Large swings are a flag.
Reconcile GAAP to owner earnings
Owner earnings ≈ Net income + D&A ± working-capital changes – maintenance capex ± normalization adjustments.
Decide on maintenance capex proxy:
Long-run: track D&A vs capex over multiple years.
Near-term: use a % of capex based on store growth vs remodels.
Decision rule: seek FCF conversion (FCF/NI) > 80% over a cycle, not just a single year.
Estimate ROIC and spread
Pick a consistent invested capital definition. Two practical options:
Net capital employed: debt + equity – cash and short-term investments.
Operating invested capital: net working capital (ex cash & debt) + net PP&E + operating ROU assets (and other operating assets) – operating liabilities.
Compute NOPAT = operating income × (1 – effective tax rate).
Decision rule: sustained ROIC – WACC > 5% indicates durable value creation. For best-in-class retailers, >10% over a cycle.
Per-share framing
Track diluted shares, SBC, buybacks, and dividends.
Compute FCF per share and EPS over time.
Decision rule: minimal dilution and consistent per-share growth signal discipline.
Capital allocation scorecard
Use a 1–5 scale on:
Organic reinvestment returns (store-level economics)
Balance sheet prudence (net cash/debt, terming)
Distribution policy (dividends/specials vs reinvestment opportunities)
Opportunistic buybacks (valuation-aware or not)
Pitfalls and false positives (what commonly misleads investors)
“Improving” inventory metrics from stockouts: lower DIO from empty shelves is not quality.
Pulling forward payables: temporary DPO boosts can mask deteriorating turns.
Capex deferral: short-term FCF lift at the expense of store quality and growth runway.
ROIC inflation from narrow definitions: cherry-picking denominator can overstate returns; disclose definitions.
Per-share neglect: aggregate growth with dilution doesn’t equal value creation.
Checklist / one-pager (actionable bullets readers can save)
ROIC spread: ROIC – WACC > 5% for 5+ years?
CCC: stable ≤ 10 days (or negative), DIO in tight band, DSO low, DPO steady.
FCF conversion: multi-year FCF/NI > 80%; owner earnings consistent with narrative.
Margin bands: gross and operating margins stable (no promotional dependence).
Per-share: FCF/share and EPS up; diluted shares flat/down; SBC offset by buybacks.
Capital allocation: specials/regulars right-sized; buybacks valuation-aware; net leverage conservative.
Evidence of moat: renewal rates, vendor terms, scale cost advantages.
Mini-FAQ
Why is Costco’s margin so low if it’s high quality?
Because the engine is capital turns and member fees, not retail markup. Low prices reinforce renewal and traffic, which drives scale and terms.
Is negative (or near-zero) CCC always good?
Not always, but in retail it often signals strong bargaining power and cash-like sales. It’s “free” financing if sustainable.
How should I think about maintenance capex?
Triangulate with D&A, remodel cadence, and store growth. Over short windows, use a range; over time, maintenance ≈ portion of D&A plus recurring remodel spend.
Should I include operating leases in invested capital?
Be consistent. If you include ROU assets, also include lease liabilities in capital employed and adjust NOPAT for lease interest equivalence. Consistency beats false precision.
Does Costco’s special dividend hurt growth?
Not if reinvestment opportunities are fully funded first. Specials reflect surplus capital after quality reinvestment.
Glossary
ROIC: Return on invested capital; NOPAT over invested capital.
WACC: Weighted average cost of capital; blended cost of debt and equity.
CCC: Cash conversion cycle; DIO + DSO – DPO, days from cash out to cash in.
DIO/DSO/DPO: Days inventory/sales/payables outstanding.
Owner earnings: Buffett-style proxy for distributable cash after maintenance capex.
SBC: Stock-based compensation; non-cash expense but dilutive unless offset.
Capital turns: Revenue divided by invested capital; a key ROIC driver in low-margin businesses.
Membership float: Cash collected upfront for services, recognized over time (deferred revenue).
Further reading
Costco FY2024 Annual Report and 10-K (Sep 1, 2024) — SEC filing and PDF (2024)
Costco FY2024 results press release (Sep 26, 2024)
Lease accounting and ROIC adjustments — academic and practitioner notes (various, 2019–2024)
Negative working capital in retail — industry primers (various, 2020–2024)
Owner earnings vs FCF — Buffett 1986 letter; practitioner updates (1986; 2010–2024)
References
Costco FY2024 10-K (as of Sep 1, 2024): SEC Edgar filing with financial statements and notes SEC filing.
Costco FY2024 operating results press release (as of Sep 26, 2024): membership fee revenue and comps Costco IR.
Macrotrends: Costco margins time series (as of May 31, 2025) Macrotrends.
Yahoo Finance: COST key statistics, EV/EBITDA snapshot (as of Oct 7, 2025) Yahoo Finance.
Costco Annual Reports archive (as of 2024) Costco IR Annual Reports.
Disclaimer
Educational content, not investment advice.