
From 10-K to Investment Thesis: A 60-Minute Framework Using NotebookLM

Most investors never read 10-Ks. They rely on summaries, analyst reports, or financial websites that strip away the context. The problem? You miss the nuances that separate good investments from great ones.
Here’s what you’ll learn: A systematic 60-minute process for turning a company’s 10-K into a clear investment thesis using NotebookLM. We’ll walk through this framework using Taiwan Semiconductor Manufacturing Company (TSMC) as our example, showing you exactly how to extract the insights that matter.
Why NotebookLM Changes the Game
Reading a 10-K the traditional way takes hours. TSMC’s 2023 10-K runs 238 pages. Most of it is legal boilerplate, detailed risk factors, and financial statement footnotes. The valuable insights are buried.
NotebookLM solves this problem. Upload the 10-K PDF, and you get an AI research assistant that knows the entire document. Ask specific questions. Get instant answers with page citations. Build your investment thesis in an hour instead of an afternoon.
This isn’t about letting AI think for you. It’s about using AI to surface the specific information you need to think clearly about a business.
The 60-Minute Framework
This framework has four phases, each with specific questions designed to build your investment thesis systematically.
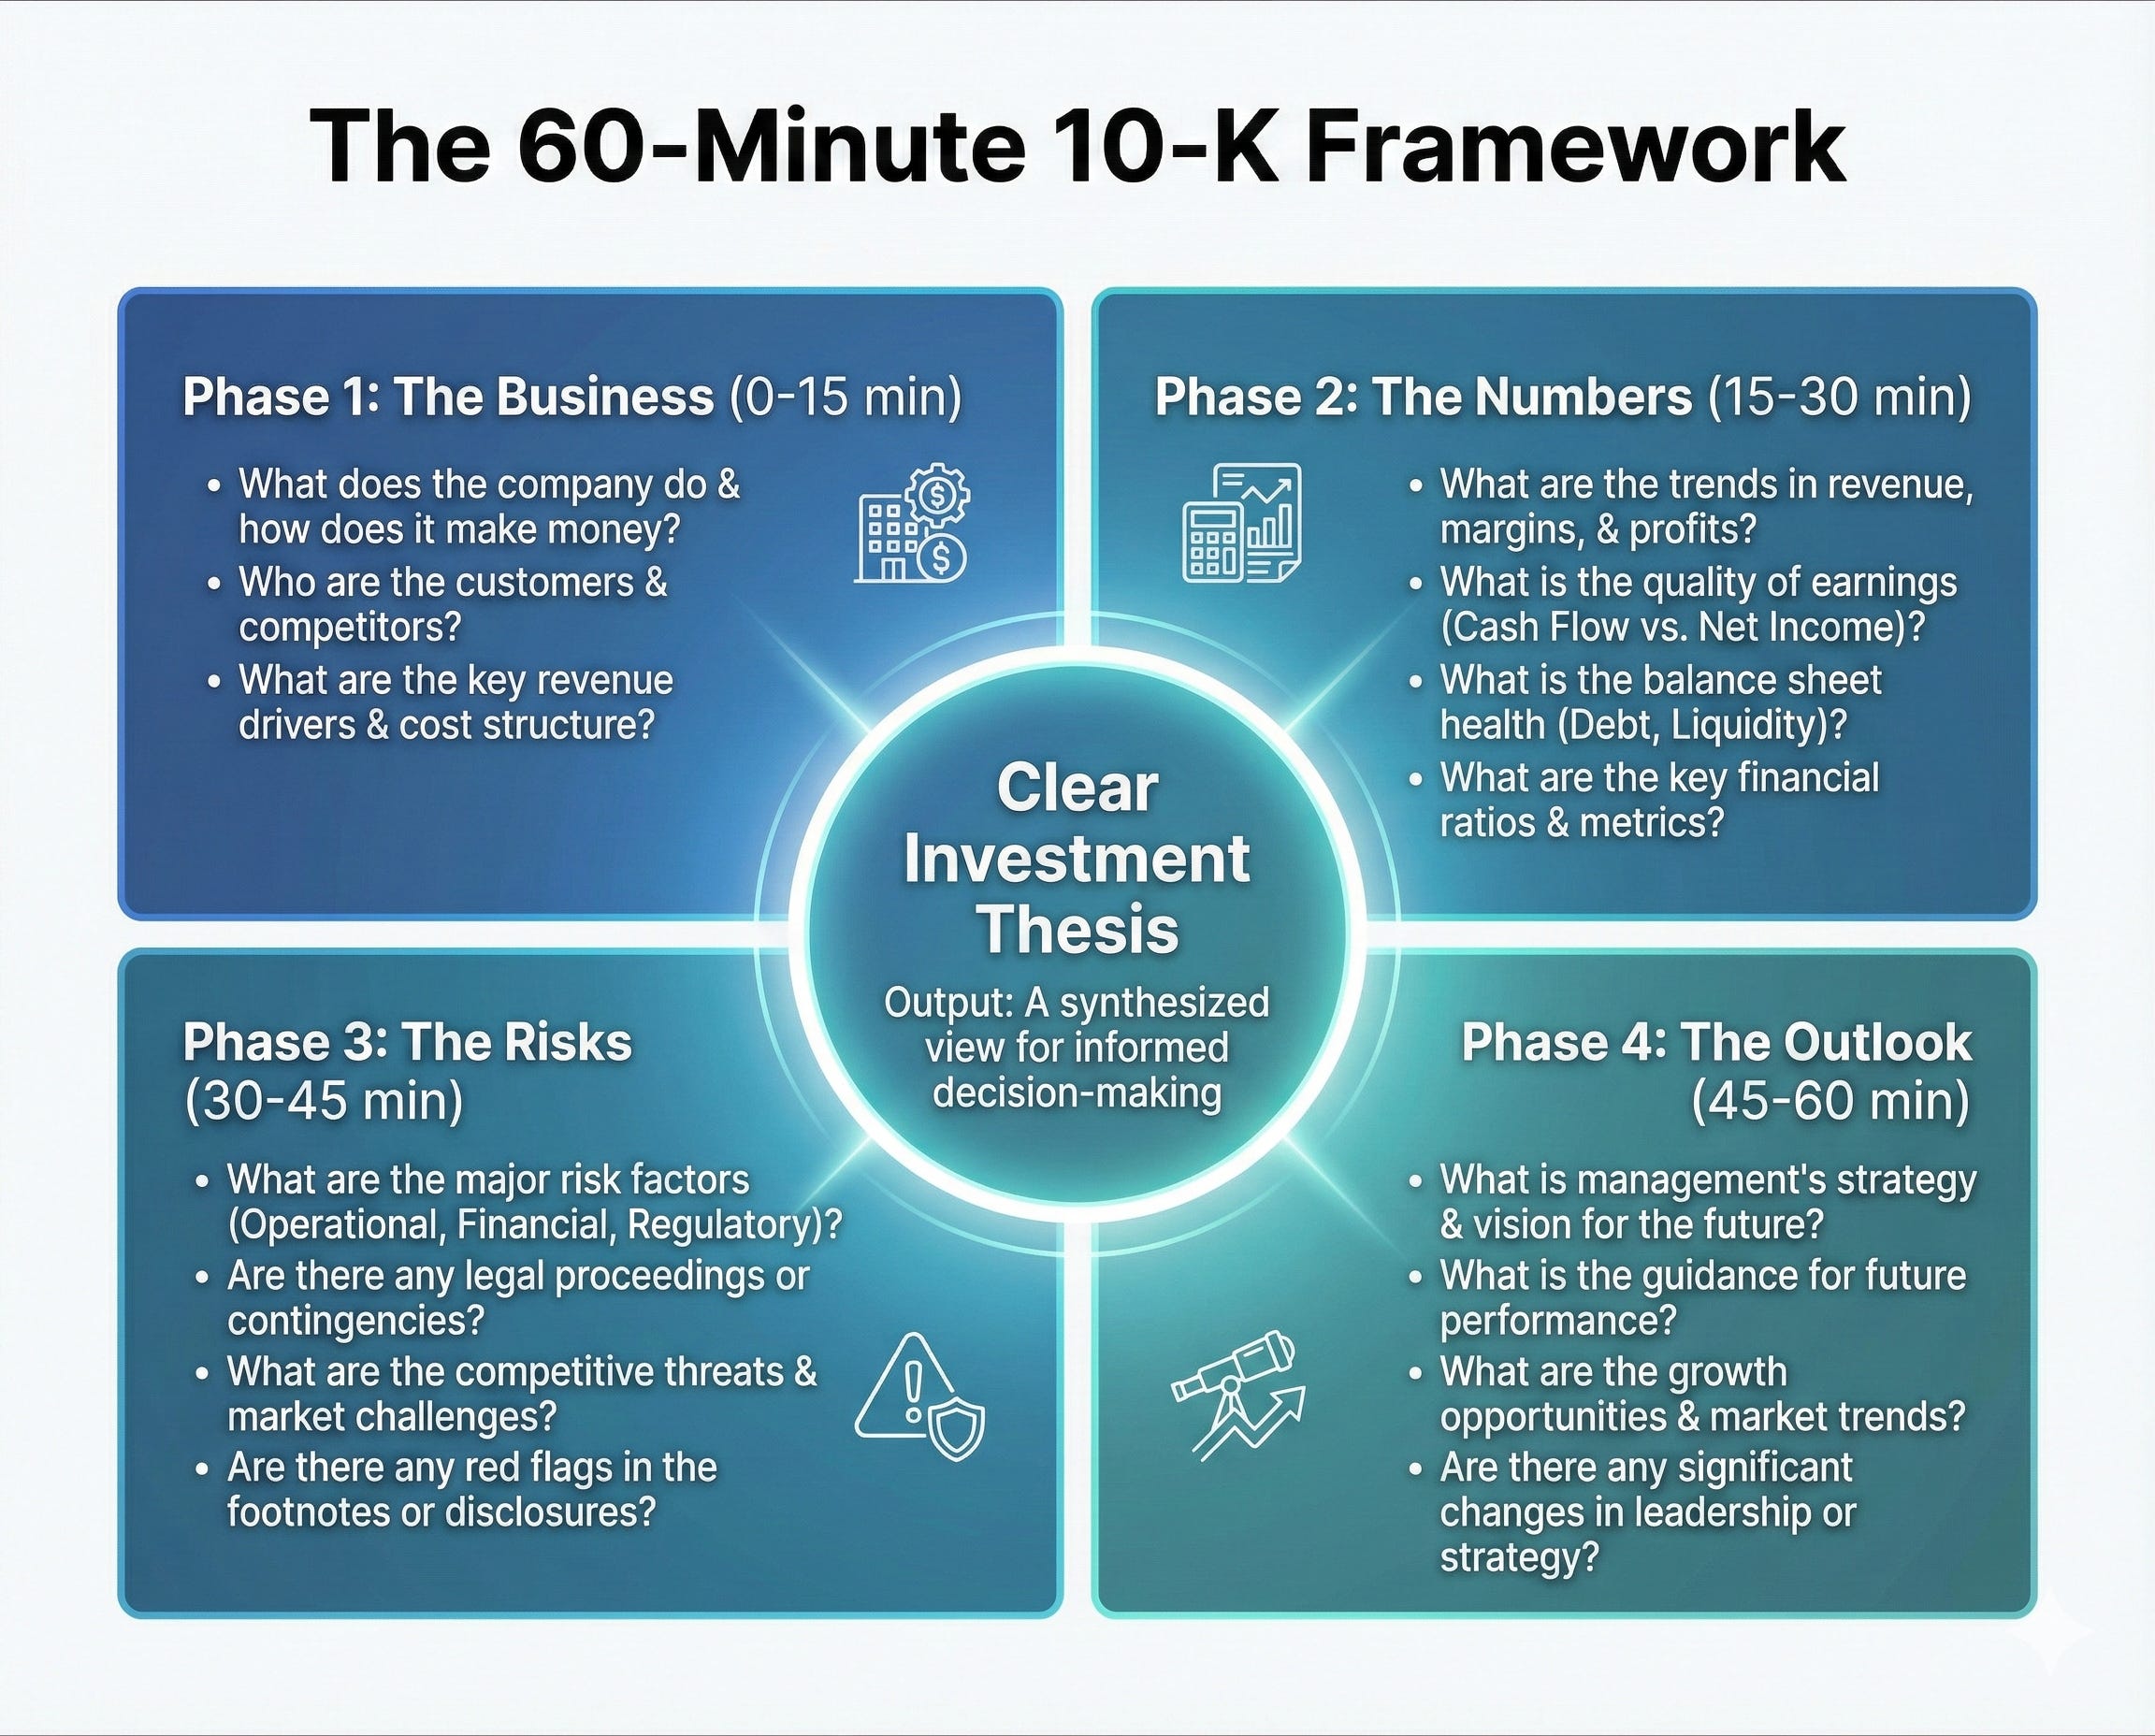
Phase 1: Business Model Clarity (15 minutes) Phase 2: Competitive Position (15 minutes) Phase 3: Financial Quality (15 minutes) Phase 4: Risks and Valuation Context (15 minutes)
Let’s walk through each phase using TSMC’s 2023 10-K.
Phase 1: Business Model Clarity (15 minutes)
Before you can value a business, you need to understand how it makes money. Not the elevator pitch version. The operational reality.
The Prompt:
Analyze this company's business model and provide a structured summary:

1. Revenue Composition: List all business segments, product lines, or platforms with their percentage of total revenue. If the company reports revenue by geography, include that breakdown as well.

2. Customer Concentration: Identify the largest customers (by percentage of revenue if disclosed), the total percentage of revenue from the top 10 customers, and any dependencies on specific customer relationships.

3. Operational Model: Describe the production or service delivery process, including capacity utilization rates, capital intensity (capex as % of revenue), and whether the business is asset-light or asset-heavy.

4. Unit Economics: If the 10-K discloses any per-unit metrics (subscribers, units sold, average revenue per customer), extract those figures and explain what they reveal about the business model.

Format your response with clear headers for each section and include specific page numbers from the 10-K for all quantitative data.
TSMC Example:
When I gave NotebookLM this prompt for TSMC’s 2023 10-K, it returned a structured analysis that immediately revealed the key insights:
Revenue Composition: TSMC doesn’t break out revenue by customer segments in traditional ways. Instead, the 10-K shows revenue by platform (page 4):
High Performance Computing: 43% of 2023 revenue
Smartphone: 42%
IoT: 7%
Automotive: 6%
DCE (Digital Consumer Electronics): 2%
This is crucial insight. TSMC isn’t just a “chip manufacturer.” It’s a company where 85% of revenue comes from two platforms that are driving technological advancement: smartphones and HPC (which includes AI chips, data center processors, and advanced computing).
Customer Concentration: According to the 2023 10-K (page 8), one customer accounted for approximately 25% of revenue, and the top ten customers accounted for 74% of revenue. TSMC doesn’t name these customers in the 10-K, but industry knowledge tells us the largest customer is Apple, with Nvidia, AMD, and Qualcomm among the top tier.
Operational Model: NotebookLM extracted that TSMC operates 13 major fabs in Taiwan (page 3) and is expanding into Arizona, Japan, and Germany. The capital intensity is extreme: 2023 capex was $28.2 billion USD (page F-6), representing approximately 40% of revenue. Capacity utilization for the full year 2023 was not explicitly disclosed, but the company discusses “underutilization” in certain mature nodes due to inventory corrections (page 29).
What this means: TSMC has significant customer concentration, but these customers are locked in by TSMC’s technological leadership. Switching costs are astronomical. It takes years and billions of dollars to qualify a new foundry for advanced chip production.
Your Action Step:
Within 15 minutes, you should have a structured document showing:
How the company makes money (specific products/services with percentages)
Where revenue concentration exists (customers, geographies, products)
What the operational model looks like (asset-light vs capital-intensive, utilization rates)
Key unit economics if available
Write these down in plain language. If you can’t explain the business model clearly after this phase, you’re not ready to invest.
Phase 2: Competitive Position (15 minutes)
This is where you identify the moat. Every investor talks about competitive advantages. Few investors actually document the specific mechanisms that allow a company to maintain those advantages.
The Prompt:
Extract and analyze this company's competitive position:

1. Stated Competitive Advantages: Summarize what the company identifies as its competitive strengths or advantages. Quote the specific language used and provide page numbers.

2. Market Position: What market share does the company disclose? How has it changed over the past 2-3 years? If specific share numbers aren't provided, describe how the company characterizes its competitive position (leader, challenger, niche player).

3. Investment in Competitive Position:
   - R&D spending as % of revenue for the past 3 years
   - What specific technologies, products, or capabilities is R&D developing?
   - Capital expenditures as % of revenue
   - What is capex being invested in (new capacity, technology upgrades, maintenance)?

4. Barriers to Entry: What does the company describe as barriers preventing new competitors from entering? Look for discussion of regulatory requirements, capital requirements, technical complexity, customer switching costs, or network effects.

5. Competitive Threats: What competitors does the company name? What emerging threats or competitive dynamics does management discuss?

Provide specific dollar amounts and percentages with page citations. I'm looking for quantitative proof of competitive advantages, not just qualitative claims.
TSMC Example:
This comprehensive prompt surfaced much richer insights than simple questions would have:
Stated Competitive Advantages: TSMC describes its competitive strengths (page 1) as “technology leadership, manufacturing excellence, customer trust, and capacity support.” But the 10-K goes deeper on technology leadership, explaining that TSMC pioneered the pure-play foundry model and has maintained process technology leadership through “substantial investments in R&D and capital equipment.”
Market Position: NotebookLM found that TSMC states it is “the largest dedicated semiconductor foundry in the world” (page 1) but doesn’t disclose specific market share percentages in the 10-K. However, the company does state it had “revenue of US$69.3 billion in 2023” and describes itself as the leader in advanced process technologies.
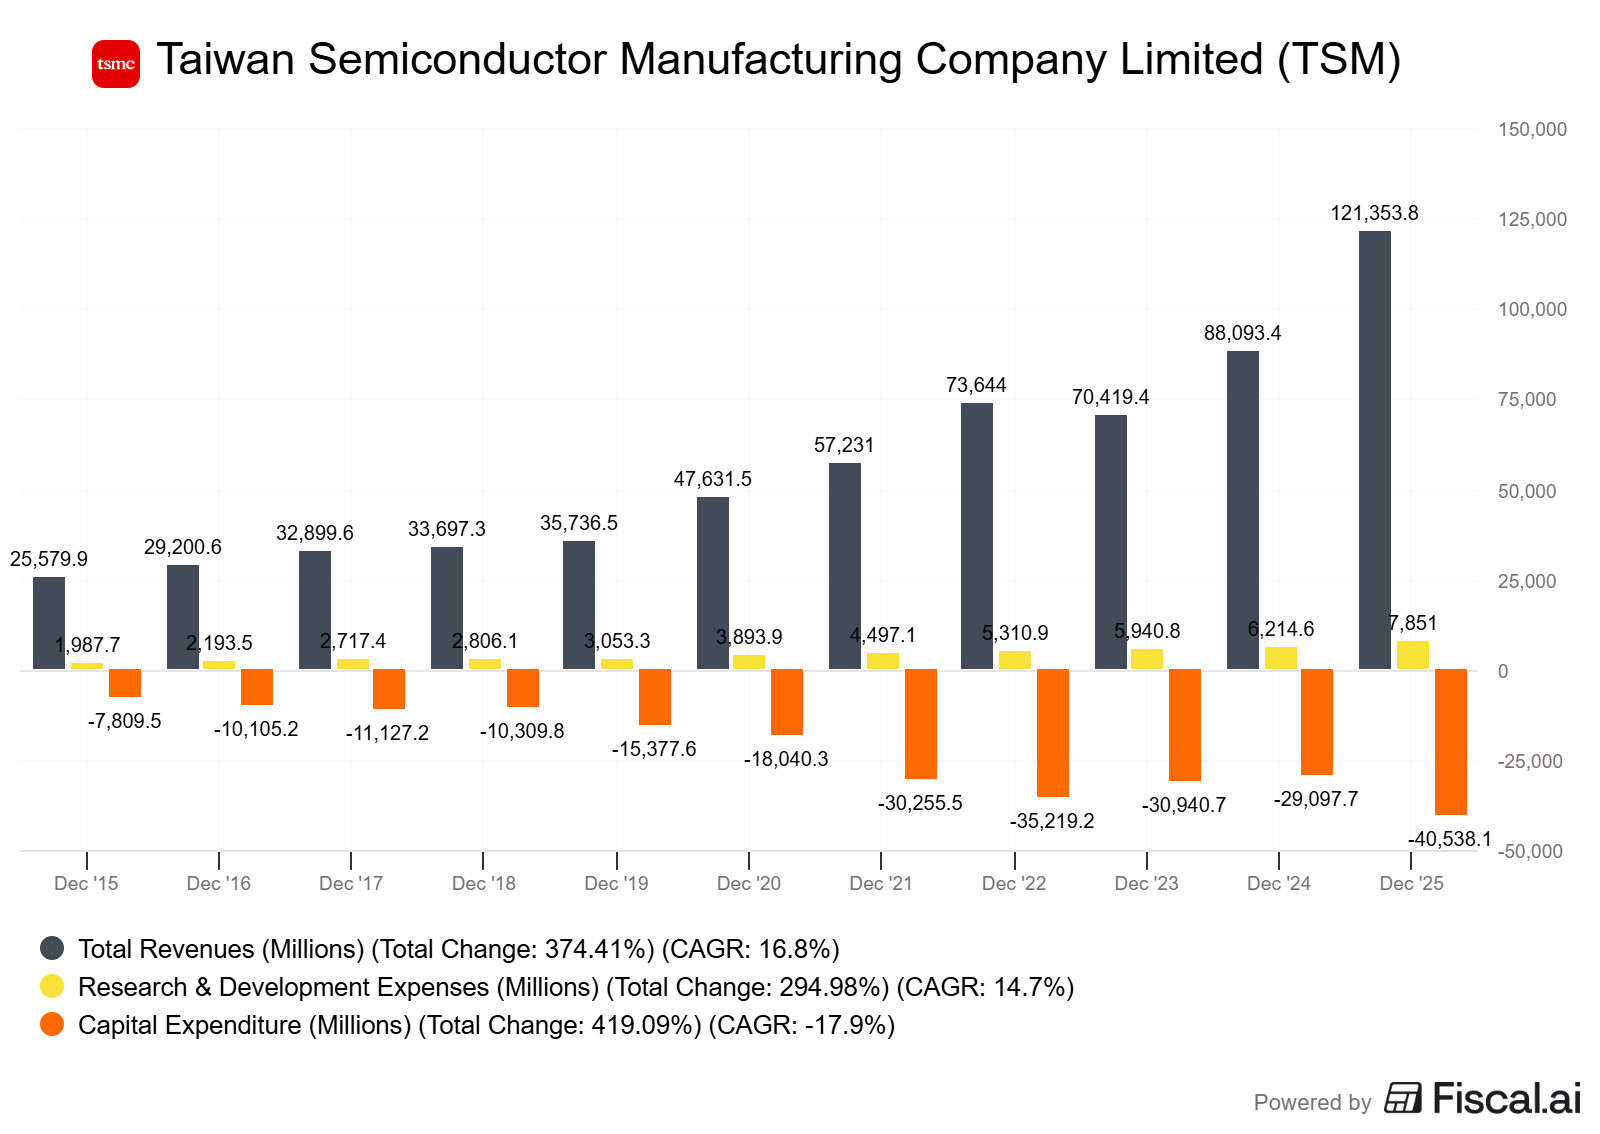
Investment in Competitive Position: Here’s where the quantitative moat evidence emerges:
R&D Spending (page 4):
2023: NT$187.7 billion (8.9% of revenue)
2022: NT$171.5 billion (7.6% of revenue)
2021: NT$124.4 billion (7.8% of revenue)
For context, TSMC’s 2023 revenue was NT$2,161.7 billion (approximately $70.1 billion USD using the exchange rate disclosed in the 10-K).
Capital Expenditures (page F-6):
2023: $28.2 billion USD
2022: $36.3 billion USD
2021: $30.3 billion USD
The 2023 capex represents approximately 40% of revenue. The 10-K describes these investments going into “3-nanometer technology, 2-nanometer technology development, advanced packaging, and specialty technologies” (page 4).
Barriers to Entry: The prompt extracted several barriers TSMC identifies:
Technical complexity: “Manufacturing leading-edge semiconductors requires highly specialized equipment and expertise” (page 7)
Capital intensity: The scale of investment required is explicitly discussed throughout the risk factors section
Customer relationships: “Long-standing customer relationships and trust built over decades” (page 1)
Ecosystem lock-in: TSMC’s ecosystem includes “comprehensive design support and IP portfolio” that customers depend on (page 3)
Competitive Threats: TSMC names Samsung Foundry and Intel Foundry Services as direct competitors (page 14). The company also discusses the threat of customers bringing manufacturing in-house and geopolitical pressures that could reshape the competitive landscape.
Why this matters: Intel, Samsung, and others can’t simply “catch up” to TSMC. The company is running a technology treadmill where staying in place requires $28 billion per year in capital investment plus $8+ billion in R&D. The moat isn’t just technical expertise. It’s the economic scale required to justify these investments.
Your Action Step:
Document the specific moat mechanisms. Not generic statements like “strong brand” or “technological leadership.” Write down:
The quantitative proof (market share, R&D spending, customer metrics)
The specific capabilities (3nm production, 2nm development pipeline)
The economic barriers (capex requirements that competitors can’t justify)
You just watched me break this down step by step. Now ask yourself: could you do this on your own, from scratch, for a stock you’re researching this week?
That’s the gap paid membership closes. You get the same spreadsheets, calculators, and visual references I use every time I analyze a dividend stock. Plug in a ticker, and the tools handle the math. You focus on the decision.
Phase 3: Financial Quality (15 minutes)
Understanding the business model and competitive position means nothing if the financial reality doesn’t support the story. This phase focuses on extracting the specific metrics that reveal whether management is allocating capital effectively.
The Prompt:
Perform a comprehensive financial quality analysis using data from the past 3 years:

1. Profitability Metrics:
   - Operating income and operating margin % for each year
   - Gross margin % for each year
   - Net income and net margin % for each year
   - Identify any unusual items or one-time charges that distort these figures

2. Return on Capital:
   - Extract total assets, current liabilities, and goodwill from the balance sheet
   - Calculate simplified invested capital (Total Assets - Current Liabilities - Goodwill)
   - Calculate ROIC using Operating Income / Invested Capital
   - Show the trend over 3 years

3. Cash Generation:
   - Operating cash flow for each year
   - Capital expenditures for each year
   - Free cash flow (Operating cash flow - Capex)
   - Free cash flow conversion rate (FCF / Net Income)
   - Working capital trends if significant

4. Capital Structure:
   - Total debt (short-term + long-term)
   - Total equity
   - Debt-to-equity ratio
   - Interest expense
   - Interest coverage ratio (Operating Income / Interest Expense)

5. Capital Allocation:
   - Dividends paid
   - Share repurchases
   - Total shareholder returns as % of free cash flow
   - Any acquisitions or major investments

Provide all figures with page citations. Calculate percentages and ratios. Explain any red flags or concerning trends.
TSMC Example:
This structured prompt generated a complete financial quality profile:
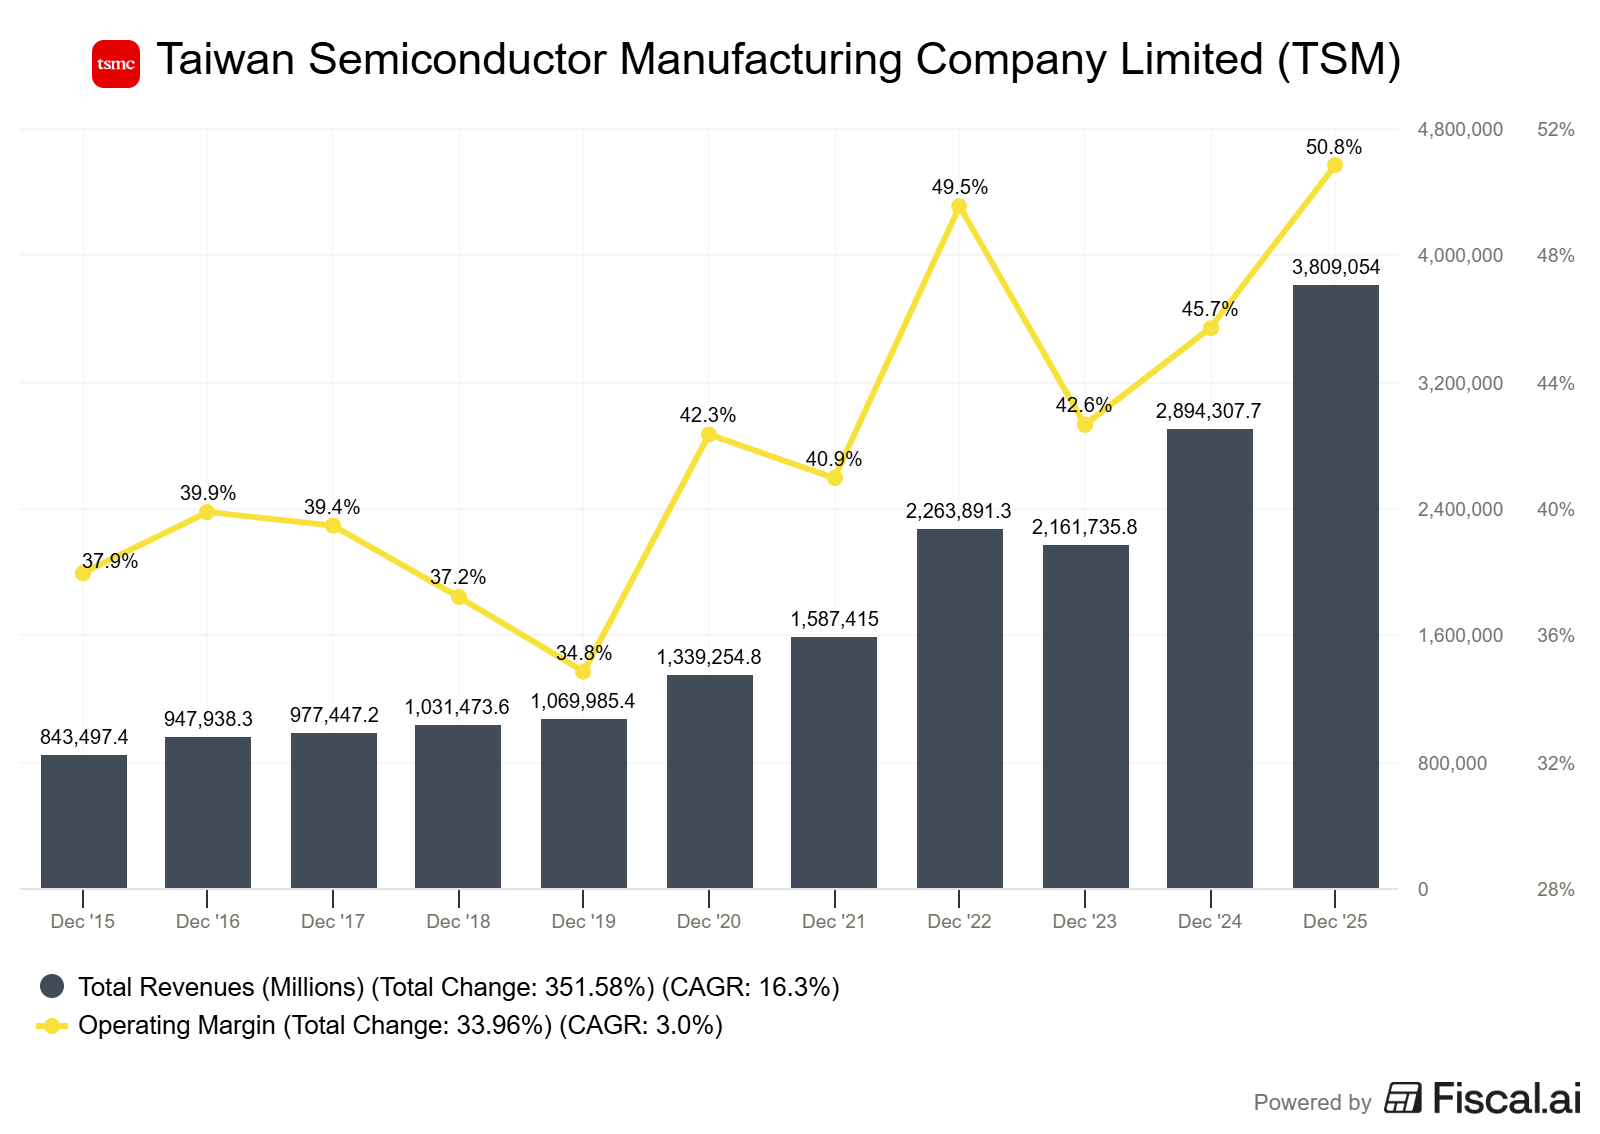
Profitability Metrics: From the Consolidated Statements of Comprehensive Income (page F-4):
2023:
Revenue: NT$2,161,663 million
Operating Income: NT$1,106,340 million (51.2% margin)
Net Income: NT$948,627 million (43.9% margin)
2022:
Revenue: NT$2,263,891 million
Operating Income: NT$1,161,346 million (51.3% margin)
Net Income: NT$1,016,985 million (44.9% margin)
2021:
Revenue: NT$1,587,415 million
Operating Income: NT$866,619 million (54.6% margin)
Net Income: NT$596,545 million (37.6% margin)
NotebookLM flagged that 2023 revenue declined 4.5% year-over-year but operating margins remained remarkably stable above 51%. This demonstrates pricing power even during demand weakness.
Return on Capital: From the Balance Sheet (page F-3), NotebookLM extracted:
2023:
Total Assets: NT$5,097,171 million
Current Liabilities: NT$649,247 million
Goodwill: NT$0 (TSMC has no goodwill)
Invested Capital: NT$4,447,924 million
ROIC: NT$1,106,340M / NT$4,447,924M = 24.9%
2022:
Invested Capital: NT$3,920,508 million
ROIC: NT$1,161,346M / NT$3,920,508M = 29.6%
The ROIC declined from 2022 to 2023, but NotebookLM identified the reason: TSMC massively increased invested capital (up 13.5%) while operating income declined slightly due to the semiconductor downcycle. The company was investing through the downturn.
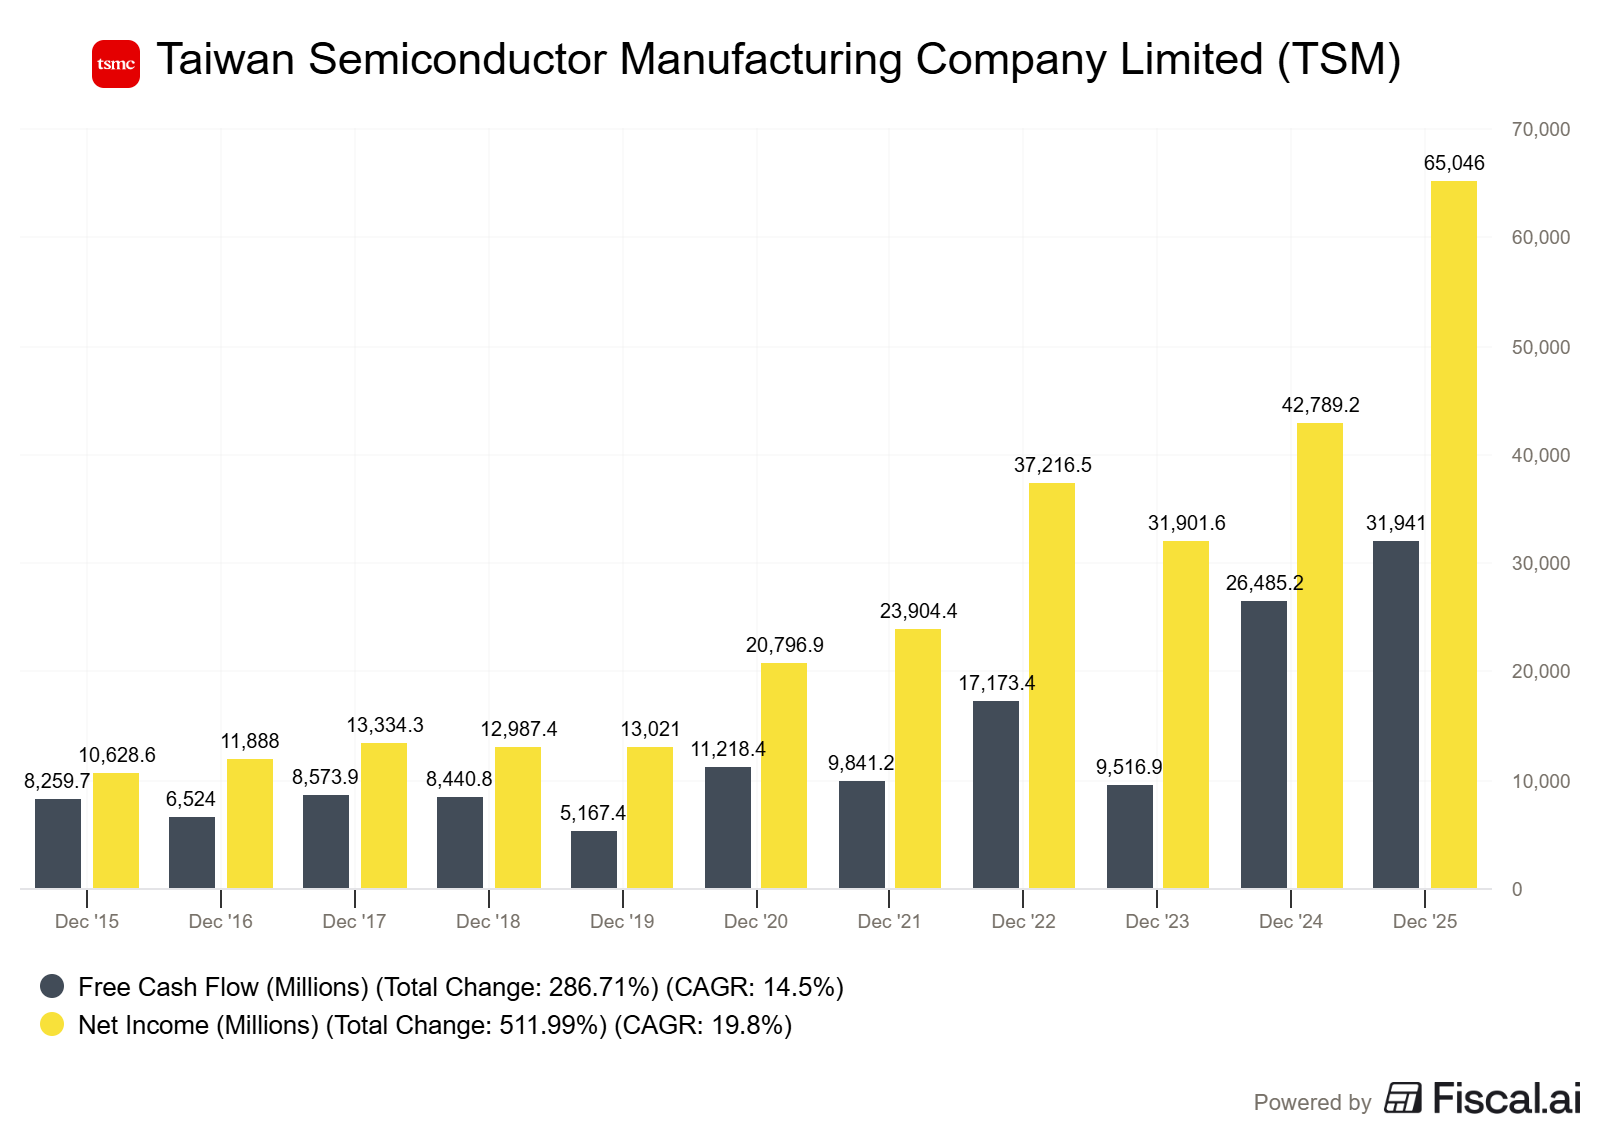
Cash Generation: From the Statement of Cash Flows (page F-5):
2023:
Operating Cash Flow: NT$1,403,745 million
Capital Expenditures: NT$947,422 million
Free Cash Flow: NT$456,323 million
FCF Conversion: 48.1% (FCF / Net Income)
2022:
Operating Cash Flow: NT$1,566,084 million
Capital Expenditures: NT$1,218,703 million
Free Cash Flow: NT$347,381 million
FCF Conversion: 34.2%
NotebookLM noted that despite revenue declining in 2023, free cash flow actually increased 31% because capex moderated from the peak 2022 levels. This shows management’s ability to flex investment while maintaining technology leadership.
Capital Structure: From the Balance Sheet (page F-3):
2023:
Short-term Debt: NT$97,296 million
Long-term Debt: NT$574,468 million
Total Debt: NT$671,764 million
Total Equity: NT$3,653,083 million
Debt-to-Equity: 18.4%
Interest expense for 2023 (page F-4): NT$10,517 million Interest Coverage: NT$1,106,340M / NT$10,517M = 105x
NotebookLM characterized this as “extremely conservative leverage” given the capital intensity of the business.
Capital Allocation: From the Statement of Equity (page F-7):
2023:
Cash Dividends: NT$375,305 million
Share Repurchases: NT$0 (TSMC does not buy back shares)
Shareholder Returns as % of FCF: 82.2%
The prompt also surfaced that TSMC has a stated policy of returning “approximately 70% of free cash flow” to shareholders through dividends (page 23), and the 2023 execution exceeded that target.
What this means: TSMC demonstrates all the characteristics of high-quality business: exceptional margins, high returns on invested capital, strong free cash flow generation, conservative debt levels, and generous shareholder returns. The financial quality matches the competitive position.
Your Action Step:
Build a financial quality scorecard with specific numbers:
Operating margins (and 3-year trend)
ROIC (even simplified calculation reveals quality)
Free cash flow as percentage of net income
Debt-to-equity and interest coverage
Capital allocation (buybacks, dividends, growth investments)
If the numbers don’t support the qualitative story from Phases 1 and 2, you don’t have an investment thesis. You have a hope.
Phase 4: Risks and Valuation Context (15 minutes)
Every 10-K contains a “Risk Factors” section. Most investors skip it because it reads like a legal document covering every conceivable problem. NotebookLM helps you cut through the noise and identify the risks that actually matter.
The Prompt:
Analyze the company's risks and provide valuation context:

1. Material Risk Factors:
   - Identify the 5 most substantial risks based on how much detail/space the company devotes to them
   - Summarize each risk in 2-3 sentences
   - Categorize each as: operational, financial, regulatory, competitive, or geopolitical
   - Note if the company quantifies any potential impact

2. Industry and Cyclical Risks:
   - What cyclical patterns does the company describe?
   - What industry-specific risks are identified?
   - How does the company characterize current industry conditions?

3. Management's Strategic Priorities:
   - What capital allocation priorities does management discuss?
   - What investments or initiatives are described as critical?
   - What does management say about balancing growth vs. profitability?

4. Valuation Context:
   - Does the company provide any industry metrics, multiples, or comparisons?
   - What long-term growth drivers does management identify?
   - Are there any disclosed analysts' estimates or guidance?

5. Historical Volatility:
   - How much have revenues fluctuated year-over-year?
   - How much have margins fluctuated?
   - What events caused the largest historical swings?

Prioritize risks by materiality (space devoted, specificity, quantification) rather than listing every boilerplate risk.
TSMC Example:
This comprehensive prompt extracted the risks that actually matter for investment decisions:
Material Risk Factors:
NotebookLM identified these as the most substantial based on detail and space devoted:
Geopolitical Risk (Cross-Strait Relations) - Categorized as Geopolitical The 2023 10-K devotes extensive discussion (pages 9-11) to potential impacts from cross-strait tensions. Key quote: “Any escalation in the political and military tensions between the PRC and the ROC could disrupt our operations and have a material adverse effect on our business, financial condition and results of operations” (page 9). The company acknowledges that “most of our customers’ orders are currently manufactured” in Taiwan, where “most of our business operations and most of our assets are located.”
Customer Concentration Risk - Categorized as Operational “Revenues from our top ten customers represented 74% of our net revenues in 2023, and one customer accounted for approximately 25% of our net revenues” (page 8). Loss of any major customer would materially impact results. NotebookLM noted this risk is partially mitigated by high switching costs but remains material.
Cyclical Semiconductor Demand - Categorized as Industry/Cyclical The 10-K extensively discusses cyclicality: “The semiconductor industry is highly cyclical and has experienced significant downturns” (page 11). TSMC’s own results demonstrate this: 2023 revenue declined 4.5% year-over-year due to “inventory corrections and weaker end-market demand.”
Technology Transition Risk - Categorized as Operational “Our business depends on our ability to develop and implement advanced process technologies ahead of our competitors” (page 13). If TSMC falls behind in process technology, customer concentration means defections would be rapid and severe. The company must invest $25-35 billion annually just to maintain position.
Talent and Labor Risk - Categorized as Operational “Competition for qualified personnel is intense” (page 16). The specialized nature of advanced semiconductor manufacturing means TSMC depends on retaining highly skilled engineers. Expansion into new geographies (Arizona, Japan, Germany) increases talent challenges.
Industry and Cyclical Risks:
NotebookLM extracted TSMC’s characterization of cycles: “The semiconductor industry historically has been cyclical and subject to significant economic downturns at various times. The semiconductor market experienced significant growth in 2021 and 2022 followed by an industry-wide correction in 2023” (page 29).
Current conditions (as of the 2023 10-K): The company describes “normalization of inventory levels in the supply chain” and expects “gradual recovery in customer demand” but provides no specific timeline.
Management’s Strategic Priorities:
The prompt surfaced three clear priorities:
Technology Leadership: “We plan to continue investing in R&D and capital equipment to maintain our technology leadership” (page 23). This is non-negotiable even during downturns.
Geographic Diversification: Expansion into Arizona, Japan, and Germany is described as “responding to customer needs” while also addressing geopolitical concerns about Taiwan concentration (page 5).
Shareholder Returns: “Our target is to distribute approximately 70% of our annual free cash flow to shareholders through cash dividends” (page 23). This comes after maintaining technology leadership.
Valuation Context:
NotebookLM found limited explicit valuation guidance in the 10-K, but extracted these relevant points:
Long-term growth drivers: AI computing, automotive electrification, 5G infrastructure, IoT proliferation (page 2)
No specific revenue or earnings guidance provided
Management describes “structural demand drivers” that will create “sustainable long-term growth opportunities” despite cyclical fluctuations (page 3)
Historical Volatility:
Revenue volatility (extracted from 3-year financials):
2023: NT$2,161.7 billion (-4.5% YoY)
2022: NT$2,263.9 billion (+42.6% YoY)
2021: NT$1,587.4 billion (+18.5% YoY)
Operating margin volatility:
Remained remarkably stable: 54.6% (2021), 51.3% (2022), 51.2% (2023)
NotebookLM identified that revenue is cyclical but margins are extremely stable, suggesting pricing power that persists through demand fluctuations.
What this means for valuation: You’re not valuing a stable utility. You’re valuing a cyclical, capital-intensive business with exceptional competitive positioning but concentrated geopolitical risk. The valuation must account for:
Cyclicality: Earnings will fluctuate 20-40% with semiconductor cycles
Geopolitical risk premium: Taiwan-specific risk requires 2-3% additional return expectations
Capital intensity: $25-35 billion annual capex is non-discretionary maintenance
Reinvestment opportunity: Unlike mature businesses, TSMC can deploy capital into growth at 25%+ ROIC
Your Action Step:
Create a risk assessment that informs your valuation:
Deal-breaker risks: Problems that would make you avoid the investment entirely
Quantifiable risks: Issues you can estimate probability and impact for (revenue cyclicality, margin compression scenarios)
Risk mitigants: What the company is doing to address major risks
Valuation implications: How risks should affect your required return and multiple assumptions
For TSMC, the geopolitical risk is real and quantifiable. It should meaningfully increase your required rate of return (I’d add 200-300 basis points). But if you believe TSMC’s technological moat persists (which the financial quality supports), the risk might be worth taking at the right price.
The Complete Prompt Template
Here are all four comprehensive prompts in copy-paste format for your own 10-K analysis:
Phase 1 - Business Model Clarity:
Analyze this company's business model and provide a structured summary:

1. Revenue Composition: List all business segments, product lines, or platforms with their percentage of total revenue. If the company reports revenue by geography, include that breakdown as well.

2. Customer Concentration: Identify the largest customers (by percentage of revenue if disclosed), the total percentage of revenue from the top 10 customers, and any dependencies on specific customer relationships.

3. Operational Model: Describe the production or service delivery process, including capacity utilization rates, capital intensity (capex as % of revenue), and whether the business is asset-light or asset-heavy.

4. Unit Economics: If the 10-K discloses any per-unit metrics (subscribers, units sold, average revenue per customer), extract those figures and explain what they reveal about the business model.

Format your response with clear headers for each section and include specific page numbers from the 10-K for all quantitative data.
Phase 2 - Competitive Position:
Extract and analyze this company's competitive position:

1. Stated Competitive Advantages: Summarize what the company identifies as its competitive strengths or advantages. Quote the specific language used and provide page numbers.

2. Market Position: What market share does the company disclose? How has it changed over the past 2-3 years? If specific share numbers aren't provided, describe how the company characterizes its competitive position (leader, challenger, niche player).

3. Investment in Competitive Position:
   - R&D spending as % of revenue for the past 3 years
   - What specific technologies, products, or capabilities is R&D developing?
   - Capital expenditures as % of revenue
   - What is capex being invested in (new capacity, technology upgrades, maintenance)?

4. Barriers to Entry: What does the company describe as barriers preventing new competitors from entering? Look for discussion of regulatory requirements, capital requirements, technical complexity, customer switching costs, or network effects.

5. Competitive Threats: What competitors does the company name? What emerging threats or competitive dynamics does management discuss?

Provide specific dollar amounts and percentages with page citations. I'm looking for quantitative proof of competitive advantages, not just qualitative claims.
Phase 3 - Financial Quality:
Perform a comprehensive financial quality analysis using data from the past 3 years:

1. Profitability Metrics:
   - Operating income and operating margin % for each year
   - Gross margin % for each year
   - Net income and net margin % for each year
   - Identify any unusual items or one-time charges that distort these figures

2. Return on Capital:
   - Extract total assets, current liabilities, and goodwill from the balance sheet
   - Calculate simplified invested capital (Total Assets - Current Liabilities - Goodwill)
   - Calculate ROIC using Operating Income / Invested Capital
   - Show the trend over 3 years

3. Cash Generation:
   - Operating cash flow for each year
   - Capital expenditures for each year
   - Free cash flow (Operating cash flow - Capex)
   - Free cash flow conversion rate (FCF / Net Income)
   - Working capital trends if significant

4. Capital Structure:
   - Total debt (short-term + long-term)
   - Total equity
   - Debt-to-equity ratio
   - Interest expense
   - Interest coverage ratio (Operating Income / Interest Expense)

5. Capital Allocation:
   - Dividends paid
   - Share repurchases
   - Total shareholder returns as % of free cash flow
   - Any acquisitions or major investments

Provide all figures with page citations. Calculate percentages and ratios. Explain any red flags or concerning trends.
Phase 4 - Risks and Valuation Context:
Analyze the company's risks and provide valuation context:

1. Material Risk Factors:
   - Identify the 5 most substantial risks based on how much detail/space the company devotes to them
   - Summarize each risk in 2-3 sentences
   - Categorize each as: operational, financial, regulatory, competitive, or geopolitical
   - Note if the company quantifies any potential impact

2. Industry and Cyclical Risks:
   - What cyclical patterns does the company describe?
   - What industry-specific risks are identified?
   - How does the company characterize current industry conditions?

3. Management's Strategic Priorities:
   - What capital allocation priorities does management discuss?
   - What investments or initiatives are described as critical?
   - What does management say about balancing growth vs. profitability?

4. Valuation Context:
   - Does the company provide any industry metrics, multiples, or comparisons?
   - What long-term growth drivers does management identify?
   - Are there any disclosed analysts' estimates or guidance?

5. Historical Volatility:
   - How much have revenues fluctuated year-over-year?
   - How much have margins fluctuated?
   - What events caused the largest historical swings?

Prioritize risks by materiality (space devoted, specificity, quantification) rather than listing every boilerplate risk.
Save these four prompts. They work for analyzing any company’s 10-K, from Apple to a small-cap industrial business you’ve never heard of. The structure forces NotebookLM to extract what matters while filtering out the noise.
Every free article teaches you a framework. Paid membership gives you the tools to use it on real stocks this week.
Here’s what you get the minute you join:
The Investing Tools Suite -- 4 purpose-built calculators (Reverse DCF, ROIC, ROIIC, WACC) that take the friction out of the numbers so you can focus on understanding the business.
180+ Stock Analysis Infographics -- Your visual cheat sheet for financial statements, valuation multiples, and dividend metrics. Pin them, save them, reference them every time you sit down to research.
Skill Workshops -- Real working sessions walking through actual company analysis, start to finish. Not theory. Practice.
Plus: AI prompt library, dividend analysis course (coming soon), and every new resource added going forward. All included.
I like the framework and find it a very useful way to quickly understand the business and operating environment. However, your 4-part framework doesn't match up with the prompts. Specifically, none of the prompts cover The Outlook points you highlighted. I actually used Gemini in Thinking and Deep Research mode so it pulled in other data points in addition to the 20-F to round out the analysis.
I am new to analytics (and Substack), but not to your podcasts. This is my 1st time actually attempting to do an analysis of a company and I am trying to follow along with this example. When I downloaded the SEC filing for 2023, from the customer relations website for TSMC then the SEC site, 1st I found it's a 20-F not a 10-K, then the # of pages don't match, so I think to myself "maybe it's a different year", but nothing fits, then there are minor differences between what NotebookLM reports to me and your example. I'm not too concerned about the differences because, in general, I can follow your example, plus I get AI makes mistakes and probably won't make the same report 1/2 the time (just a guess). Being new to this, my question is do companies amend their reports or did I grab the wrong report? Can you attach the report you used so we (your followers & subscribers) get answers similar to yours? I really appreciate what you do because this (learning to understand the fundamentals of a company to determine if it's worth my time and money as a part owner) is starting to make sense to me, although I make it hard on myself because I only devote a couple hours a week at learning the process.