
Forget Yield: 5 Metrics That Separate Real Dividend Compounders From the Pretenders
Yield is what the market is offering today. These five tell you whether the dividend will still be there in 10 years.

Dividend investing has a hidden trap. The 7% yield that looks juicy on a stock screener often signals a dividend cut coming, and the investors who chase it get burned twice when the payout falls and the share price follows it down.
Elite dividend growers play a different game. They raise their payout year after year, backed by free cash flow that compounds in the background, building wealth quietly while the high-yield names blow up.
In this article, you will learn five metrics that separate the real dividend growers from the high-yield pretenders, and how to use them on any company you analyze.
In today’s post, we will discuss:
What makes a dividend grower “elite”
The five metrics that matter most
Microsoft and Visa run through all five
How to use this as a screening framework
Common mistakes investors make with dividend stocks
Okay, let’s dive in.
What makes a dividend grower elite
An elite dividend grower is a company that has raised its dividend every year for at least a decade, by meaningful amounts (typically 8%+ annually), funded by growing free cash flow from a high-quality business.
This is a higher bar than the “Dividend Aristocrat” label, which only requires 25 consecutive years of any dividend increase. A company can raise its dividend by a penny each year and qualify. That math barely keeps up with inflation.
Real compounding requires meaningful growth.
When a company raises its dividend at 10% per year, your income doubles roughly every seven years. Hold for 20 years, and your yield-on-cost can hit double digits even if you bought when the starting yield was only 2%.
That math only works if the company can keep the increases going. Five metrics will tell you whether it can.
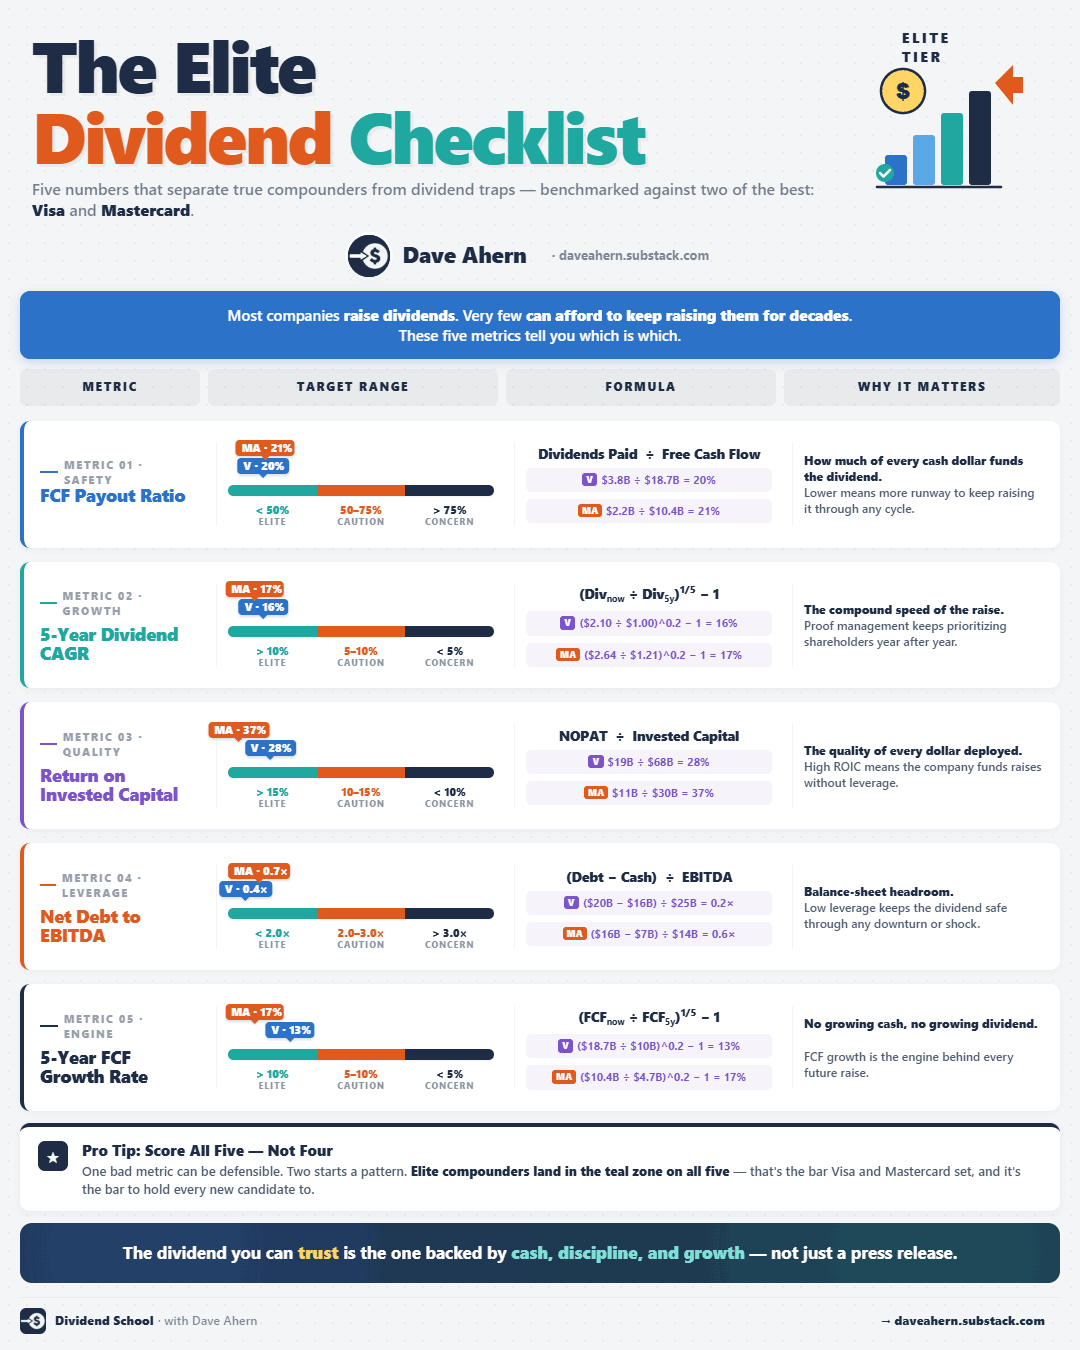
Metric 1: Free cash flow payout ratio
This is the most important number on the list. It tells you how much of the cash the company actually generates is going out the door as dividends.
The formula is simple:
FCF Payout Ratio = Dividends Paid / Free Cash Flow
Where Free Cash Flow = Cash from Operations minus Capital Expenditures.
Both numbers come straight from the cash flow statement in any 10-K. No adjustments, no estimates, no company-specific non-GAAP wizardry.
Here is what we want to see:
Under 50%: lots of room for dividend growth
50% to 75%: healthy but maturing
75% to 90%: getting tight, growth will slow
Above 90%: yellow flag, dividend may stall or get cut
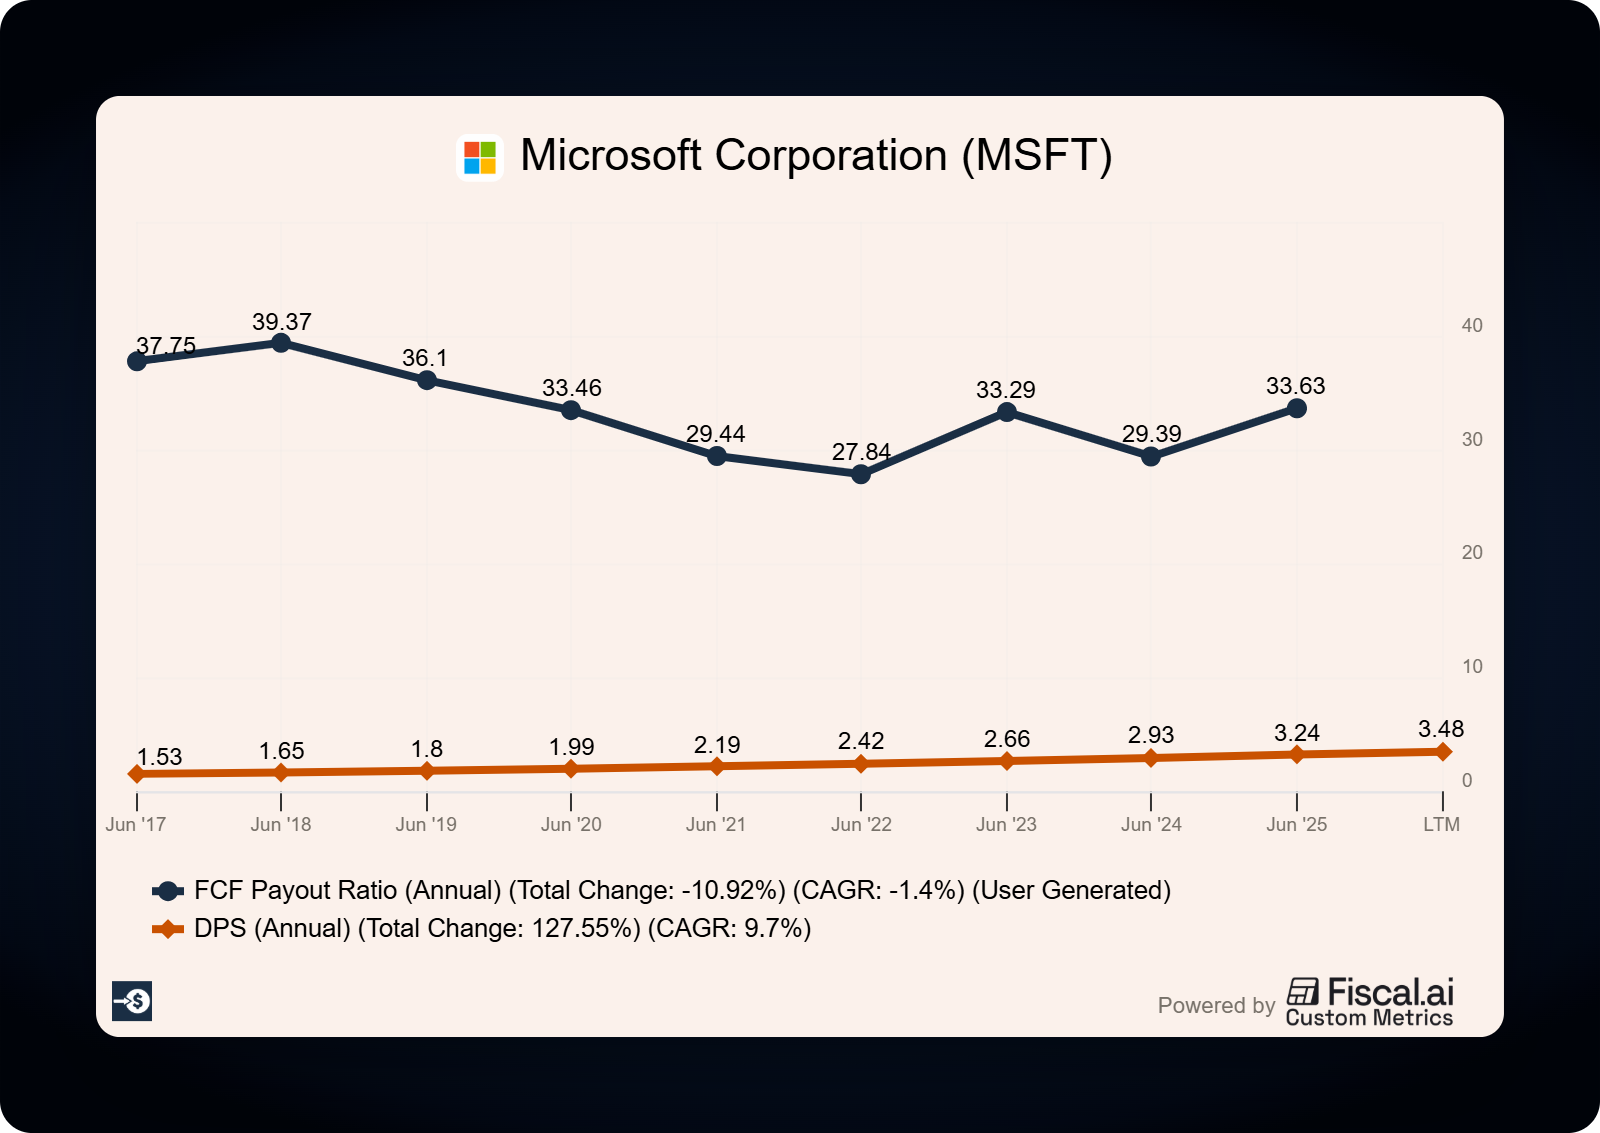
Let’s look at Microsoft as our first guinea pig.
Per Microsoft’s FY2024 10-K (fiscal year ending June 30, 2024):
Cash from operations: $118,548M
Capital expenditures: $44,477M
Free cash flow: $74,071M
Common stock dividends paid: $21,771M
FCF payout ratio: 29.4%
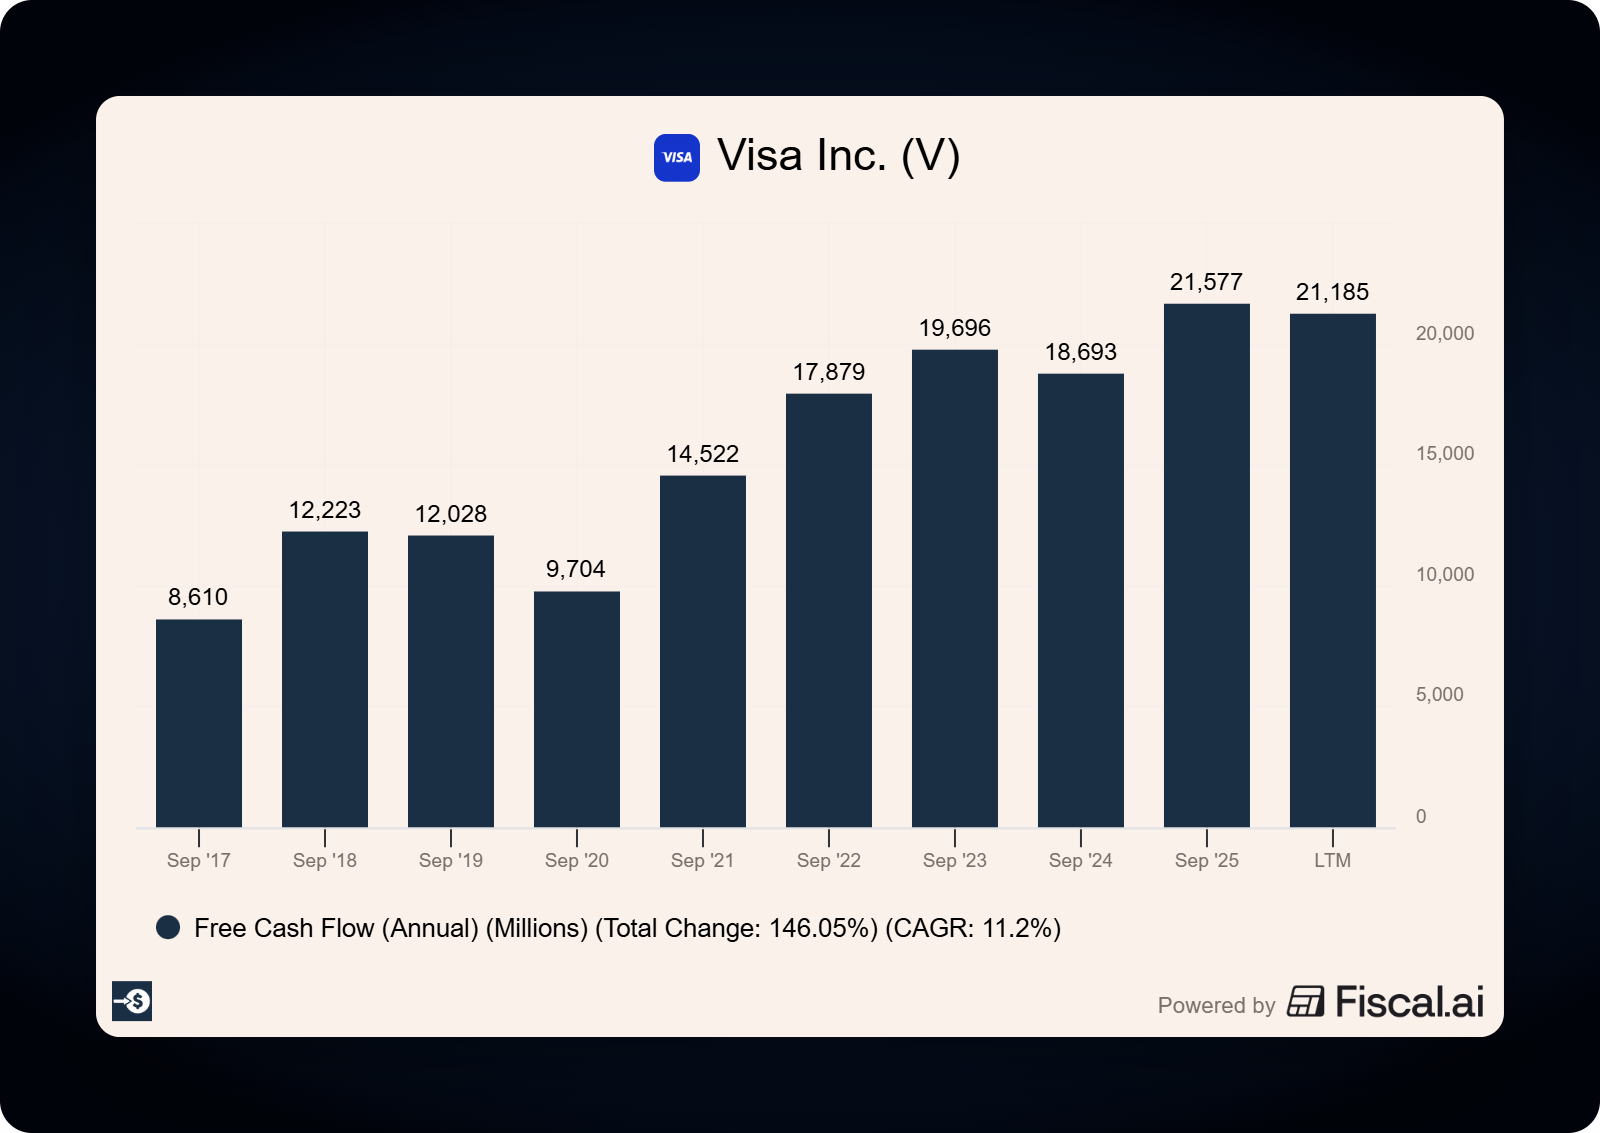
Now let’s run Visa per its FY2025 10-K (fiscal year ending September 30, 2025):
Free cash flow: $21,600M
Dividends paid: $4,600M
FCF payout ratio: 21.3%
Both companies pay out less than a third of their free cash flow. That leaves a fortress of cash for dividend increases, share buybacks, acquisitions, and debt reduction.
Compare those to a struggling dividend payer running a 90% payout ratio. One bad quarter and the dividend is at risk.
Running these five metrics by hand on every company in your watchlist takes hours. Paid subscribers skip the math. You get the calculators that pull SEC data and run the framework in minutes, plus a new dividend-grower deep dive every week applying it to a real company.
Metric 2: Dividend growth rate
A high yield with no growth is a melting ice cube. Inflation eats into your purchasing power, and your real income goes nowhere.
The dividend growth rate tells you whether the company is actually compounding your income stream. The 5-year and 10-year compound annual growth rates (CAGR) are the two I look at.
The formula:
5-Year Dividend CAGR = (Current Dividend / Dividend 5 Years Ago)^(1/5) − 1
What we want to see:
8% or higher: strong compounder
5% to 8%: moderate, often mature businesses
Under 5%: barely beating inflation
Flat or declining: skip it
Microsoft’s quarterly dividend has gone from $0.46 in FY2019 to $0.75 declared in Q4 FY2024. That works out to approximately 10% annual growth over five years.
Visa raised its quarterly dividend from $0.32 in late FY2020 to $0.59 in FY2025. That is roughly 13% annual growth.
Both pass the 8% threshold comfortably. And both have raised their dividend every single year, which matters as much as the rate itself. Consistency builds investor trust and signals management discipline.
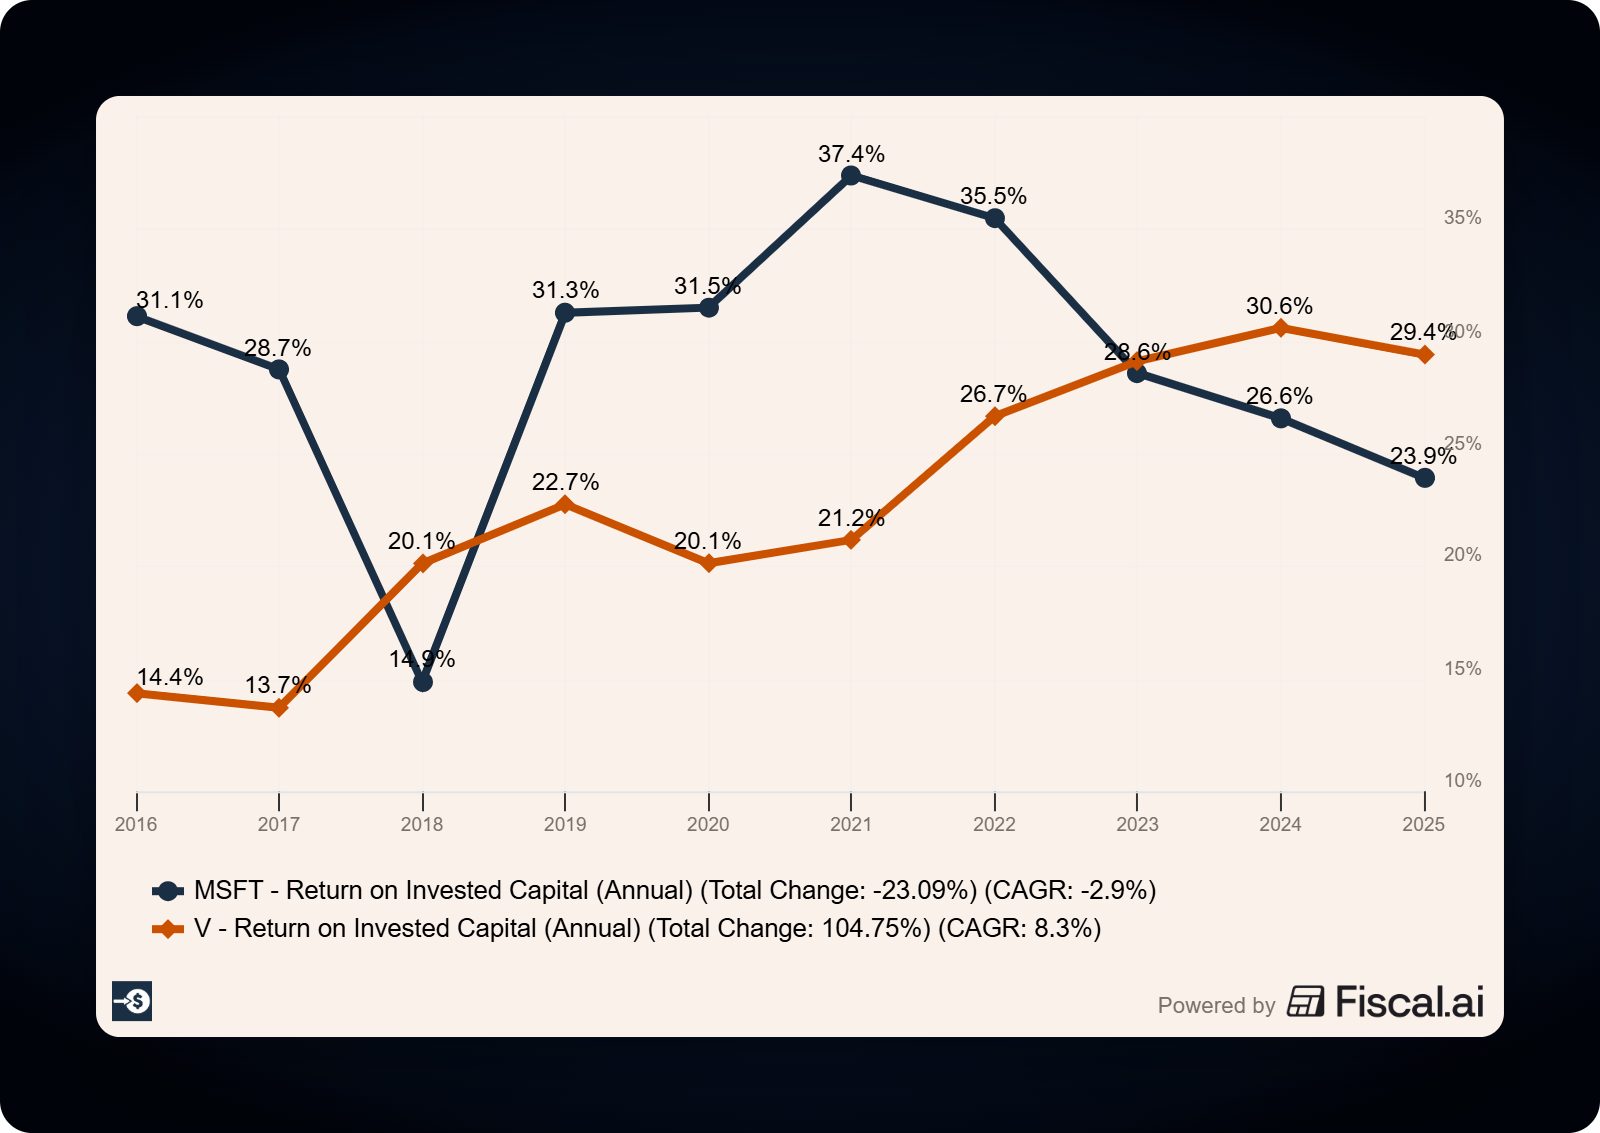
Metric 3: Return on invested capital (ROIC)
Dividend growth has to come from somewhere. The somewhere is the business engine, and ROIC measures how good that engine is.
ROIC tells you how much profit the company generates for every dollar of capital invested in the business. Higher ROIC means the company can grow without raising new capital from shareholders, which leaves more cash available for dividends.
The standard formula:
ROIC = NOPAT / Invested Capital
Where:
NOPAT = Operating Income × (1 − Tax Rate)
Invested Capital = Total Debt + Total Equity
What we want to see:
20% or higher: elite quality business
15% to 20%: high quality
10% to 15%: average
Under 10%: capital-intensive, struggling to create value
Both Microsoft and Visa land firmly in elite territory. Microsoft’s ROIC runs in the high-20% range, and Visa’s typically sits at 25% to 30%+. [Verify exact current figures in latest 10-K or Fiscal.ai before publishing.]
Visa’s number is especially impressive because the business requires almost no physical capital. Each new transaction processed costs the company essentially nothing, which is why Visa can compound dividends at double-digit rates without ever needing to raise capital from shareholders.
This is what Buffett means when he talks about businesses that earn high returns on small capital bases. Those are the diamonds we look for.
Metric 4: Net debt to EBITDA
The fourth metric checks whether the company can survive a downturn without cutting the dividend.
Net Debt to EBITDA tells you how many years of EBITDA it would take to pay off all the company’s debt, after netting out cash on the balance sheet.
The formula:
Net Debt to EBITDA = (Total Debt − Cash) / EBITDA
What we want to see:
Under 2x: strong balance sheet
2x to 3x: manageable, watch closely
3x to 4x: elevated risk
Above 4x: dividend is at real risk in any downturn
Per Visa’s FY2025 10-K:
Total senior notes outstanding: $25.4B
Cash and equivalents: $17.2B
Net debt: $8.2B
EBITDA: $25.2B
Net debt / EBITDA: 0.33x
That is fortress level. Visa could pay off all its debt in about four months of EBITDA.
Microsoft also runs an extremely conservative balance sheet. The company carries an AAA credit rating, the highest available, and historically holds more cash and short-term investments than long-term debt, giving it a net cash position.
When the next recession hits, dividend payers with high debt loads will be the first to cut. Companies like Microsoft and Visa will keep raising.
Metric 5: Free cash flow growth rate
The fifth metric is the engine room. If free cash flow stops growing, dividend growth has to stop too.
Look at the 5-year FCF CAGR. This tells you whether the cash machine is actually expanding.
What we want to see:
10%+: strong underlying growth
5% to 10%: moderate
Flat or declining: dividend growth is borrowed time
Visa’s free cash flow grew from approximately $10.8B in FY2020 to $21.6B in FY2025. That is about 15% annual growth. [Verify FY2020 figure in 10-K.]
Microsoft’s free cash flow has grown at low double-digit rates over the past five years, fueled by Azure cloud expansion and Office 365 subscriptions. [Verify FY2019 FCF in 10-K for exact CAGR.]
Notice how Visa’s 15% FCF growth lines up with its 13% dividend growth. That is the pattern you want to see. The dividend is being funded by real cash growth, not financial engineering.
How to use this in your investing process
Here is how I use these five metrics as a screening checklist on any potential dividend investment:
Pull the most recent 10-K from sec.gov
Calculate FCF Payout Ratio (target: under 60%)
Pull dividend per share for the most recent fiscal year and 5 years ago, calculate the CAGR (target: 8%+)
Look up or calculate ROIC (target: 15%+)
Calculate Net Debt to EBITDA (target: under 3x)
Calculate 5-year FCF CAGR (target: 8%+)
If a company passes all five, it belongs on your shortlist. If it fails two or more, move on.
Notice the absence of dividend yield from this list. These five metrics measure quality and sustainability, which is what protects your dividend income over decades. Yield only tells you what the market is offering you today.
Common mistakes investors make with dividend stocks
Chasing yield without checking sustainability. A 7% yield often means the market expects a cut. AT&T was the textbook case before its 2022 dividend cut. The yield kept rising as the stock fell, and investors who bought for income got hit twice.
Using the earnings payout ratio instead of FCF. Net income includes depreciation, stock-based compensation, and other non-cash items that distort the picture. FCF tells you whether the dividend is actually being funded by cash coming in the door. A company with a 60% earnings payout ratio could be running a 120% FCF payout ratio, which means it is borrowing or selling stock to pay the dividend.
Treating Dividend Aristocrat status as a guarantee. The list requires 25 years of any increase. A company growing its dividend at 2% per year qualifies, even though that growth barely keeps up with inflation.
Buying without checking the balance sheet. A company with stretched debt cannot defend its dividend in a downturn, no matter how long its track record. When credit markets tighten, dividends are the first thing CFOs cut to preserve cash.
Confusing yield-on-cost with current yield. Long-term holders of Microsoft from 10 years ago now have a yield-on-cost well above the current yield, simply because the dividend has grown faster than the stock price. That is the compounding you are buying when you focus on dividend growth.
Closing takeaway
Elite dividend growers share five traits: low FCF payout ratios, double-digit dividend growth, high ROIC, strong balance sheets, and growing free cash flow. Find companies that check all five boxes and you build a portfolio that compounds your income for decades.
That is going to wrap up our discussion for today.
As always, thank you for taking the time to read this post, and I hope you find something of value on your investing journey.
If I can further assist, please don’t hesitate to reach out.
Until next time, take care and be safe out there,
Dave
P.S. The five metrics above are how I separate the elite dividend growers from the rest. On June 1, I am opening something I have been building for a long time. It is called Dividend School, and it is where I will teach you to build a dividend portfolio that pays you to live, one quality company at a time. Watch your inbox this week. The full story is coming.
Exceptionally informative
Great breakdown and advice.