
DCF Without the Theater: A Minimalist Approach

Most discounted cash flow models are elaborate works of fiction.
Not because DCF is flawed as a concept. It’s actually the purest expression of what a business is worth: the cash it will generate over its lifetime, discounted back to today. The problem is what happens when investors sit down to build one. They create 47-row spreadsheets, project revenue growth to the decimal point for the next decade, and produce a “fair value” of $147.32. That false precision isn’t analysis.
It’s theater.
Today, I want to show you a different approach. One that uses DCF as a thinking tool rather than a price-target generator. You’ll learn to identify the two or three assumptions that actually drive a valuation, ignore everything else, and use the framework to ask better questions rather than produce false answers.
The Core Problem With Most DCF Models
Here’s a dirty secret about discounted cash flow analysis: roughly 70-80% of the value in most models comes from the terminal value, the estimate of what the business is worth at the end of your projection period.
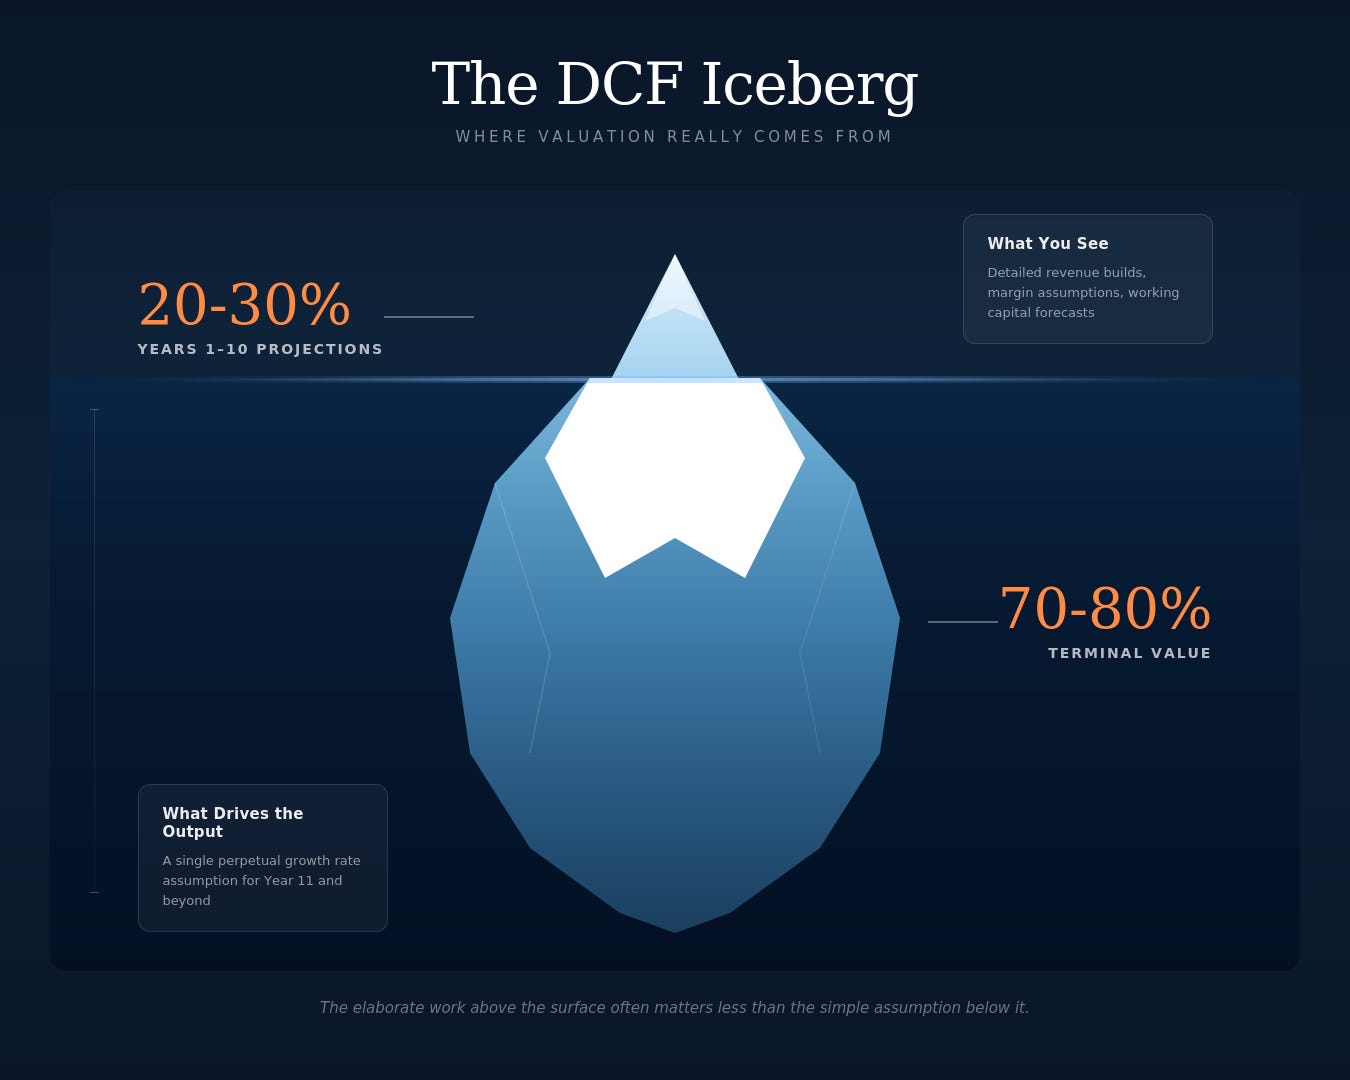
Think about what that means. You’re spending hours forecasting Years 1 through 10 with detailed revenue builds, margin assumptions, and working capital adjustments. But the bulk of your calculated value depends on a single growth rate you plug into a perpetuity formula for Year 11 and beyond.
This isn’t a flaw you can model away. It’s structural. The math of discounting means that cash flows far in the future (and the terminal value representing all cash flows after your projection period) get compressed into a single number that dominates your output.
The minimalist response: Stop pretending you can forecast with precision. Instead, identify the few variables that actually matter and focus your energy there.
What Actually Drives a DCF
Every DCF model, no matter how complex, comes down to four inputs:
Current free cash flow (your starting point)
Growth rate (how fast that cash flow increases)
Duration of growth (how long elevated growth continues before normalizing)
Discount rate (the return you require to own this asset)
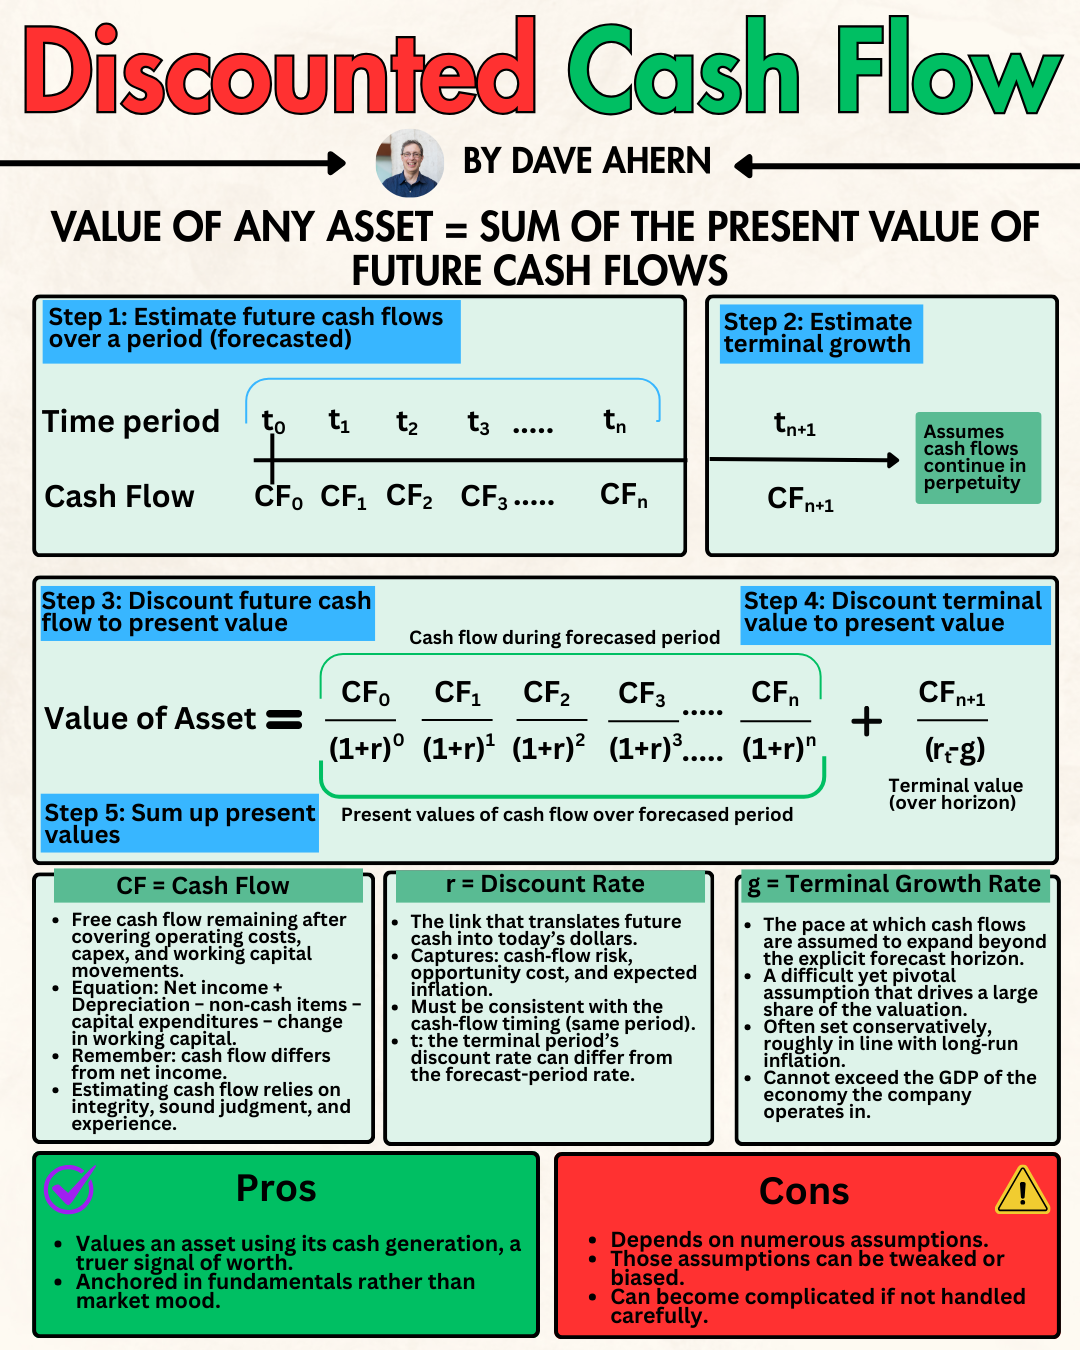
That’s it. Everything else in a fancy model (working capital builds, capex schedules, margin expansion assumptions) eventually flows into one of these four buckets.
The minimalist approach means being honest about what you actually know:
Current free cash flow: You can measure this. It’s in the SEC filings. High confidence.
Discount rate: You can decide this based on your required return and risk assessment. Moderate confidence.
Growth rate and duration: You’re guessing. Low confidence, but these drive most of the value.
This asymmetry should change how you use DCF. Instead of building elaborate models that obscure your uncertainty, build simple ones that expose it.
A Minimalist DCF: Walmart
Let’s work through a real example. Walmart is a good starting case because it’s a mature, stable business where forecasting is less delusional than usual.
Step 1: Establish Current Free Cash Flow
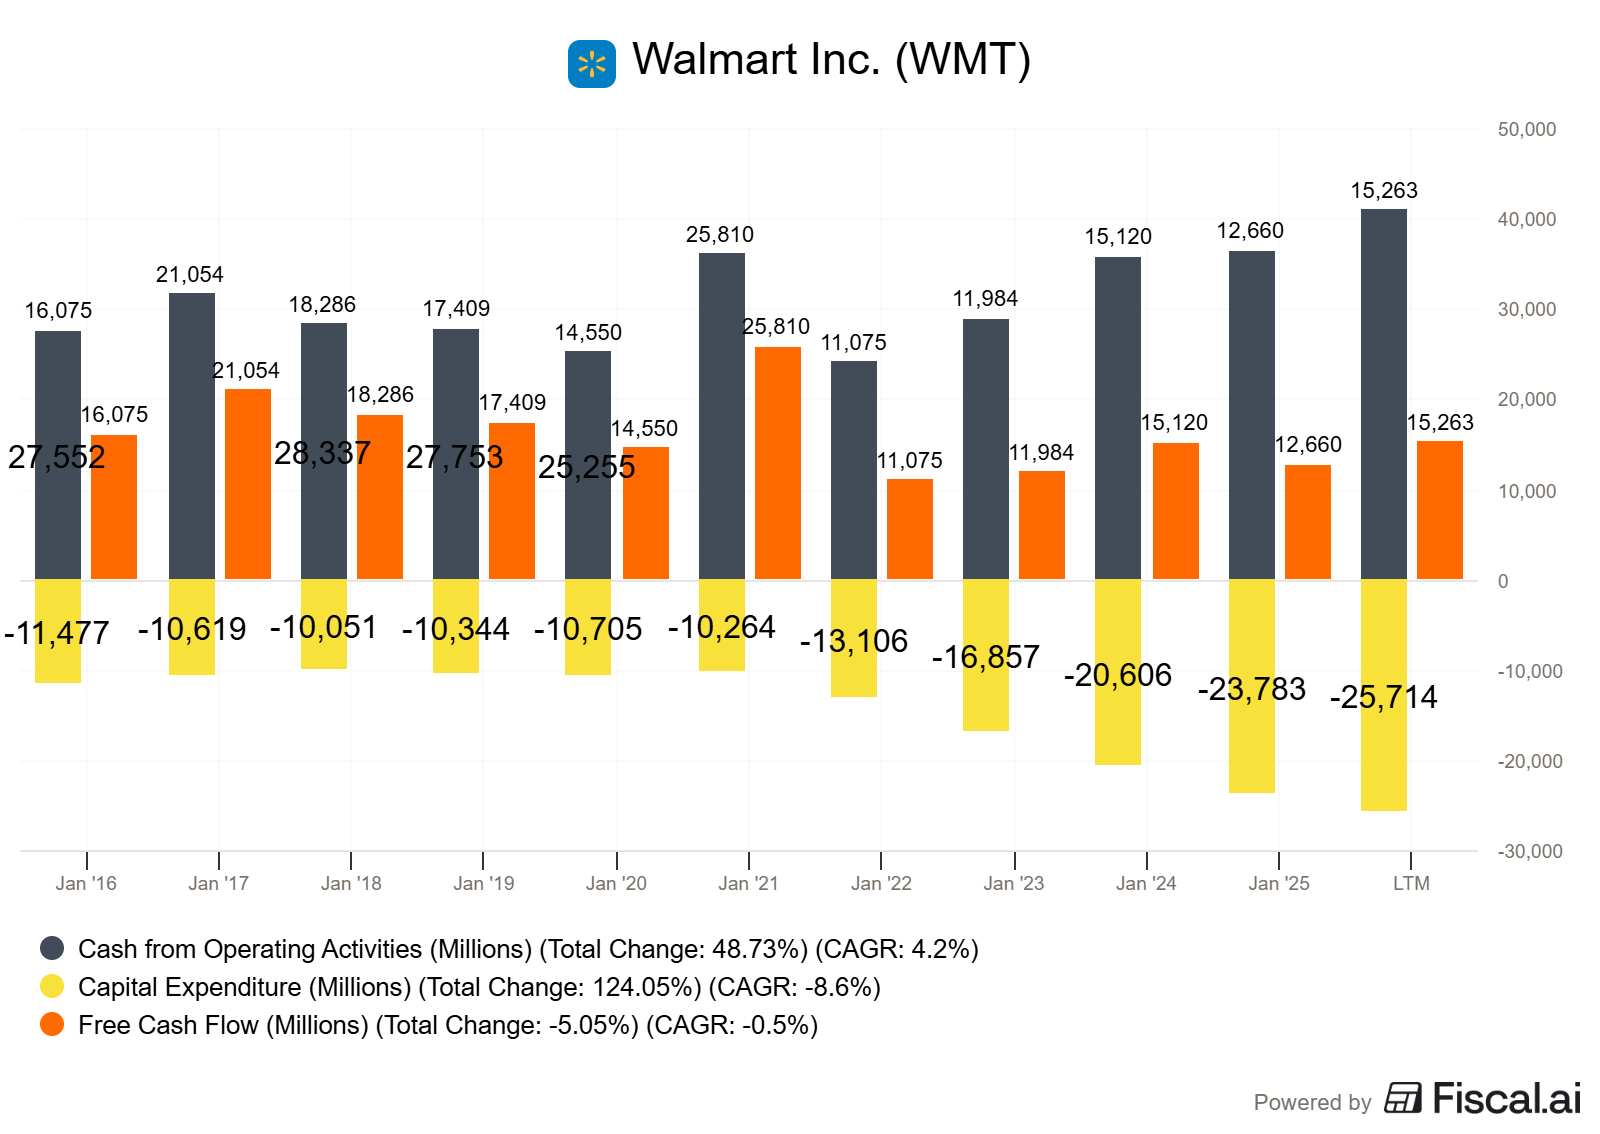
Free cash flow equals operating cash flow minus capital expenditures. From Walmart’s fiscal year 2024 10-K (fiscal year ending January 31, 2024):
Operating cash flow: $35,276 million
Capital expenditures: $20,606 million
Free cash flow: $14,670 million
With 8,108 million shares outstanding, that’s $1.81 in free cash flow per share.
That’s our starting point. One number, directly from the source.
Step 2: Make Explicit Assumptions (Not Hidden Ones)
Here’s where most models go wrong. They bury assumptions inside complicated builds. We’re going to state ours plainly:
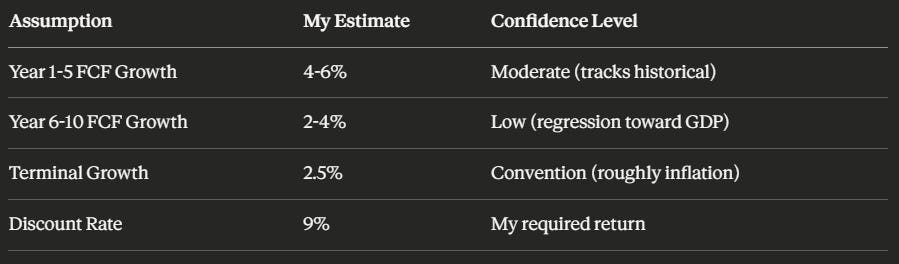
Notice I’m using ranges, not point estimates. A model that tells you Walmart is worth exactly $187.43 is misleading. A model that tells you it’s probably worth between $30 and $35 under conservative assumptions is being honest about the math.
Step 3: Calculate a Range, Not a Number
Using the low end of assumptions (4% near-term growth, 2% later growth, 9% discount rate):
Year 10 FCF per share: $2.44
Terminal value: $2.44 × 1.025 ÷ 0.065 = $38.46
Present value of terminal: $38.46 ÷ 2.37 = $16.24
Present value of Years 1-10 cash flows: $13.80
Total value: approximately $30 per share
Using the high end of assumptions (6% near-term growth, 4% later growth, 9% discount rate):
Year 10 FCF per share: $2.95
Terminal value: $2.95 × 1.025 ÷ 0.065 = $46.46
Present value of terminal: $46.46 ÷ 2.37 = $19.63
Present value of Years 1-10 cash flows: $15.20
Total value: approximately $35 per share
Step 4: Compare to Current Price
As of January 2026, Walmart trades at approximately $118 per share.
Wait. Our conservative DCF says $30-35, but the stock trades at $118? What’s going on?
This is where the minimalist DCF earns its keep. The model isn’t broken. It’s telling you something important: the market is using very different assumptions than our conservative inputs.
To justify $118 with a 9% discount rate, you’d need to assume Walmart grows free cash flow at 12-15% annually for a decade. That’s aggressive for a mature retailer.
Alternatively, the market might be using a much lower discount rate. If we drop to 7% (reflecting today’s lower interest rate environment), our terminal value roughly doubles. Adding slightly higher growth assumptions makes $118 more justifiable.
The point isn’t that our model is “right” and the market is “wrong.” The point is that you now understand exactly which assumptions are embedded in the current price. You can make an informed decision about whether you believe those assumptions.
Where False Precision Becomes Dangerous: Alphabet
Now, let’s see how this framework handles a different kind of company.
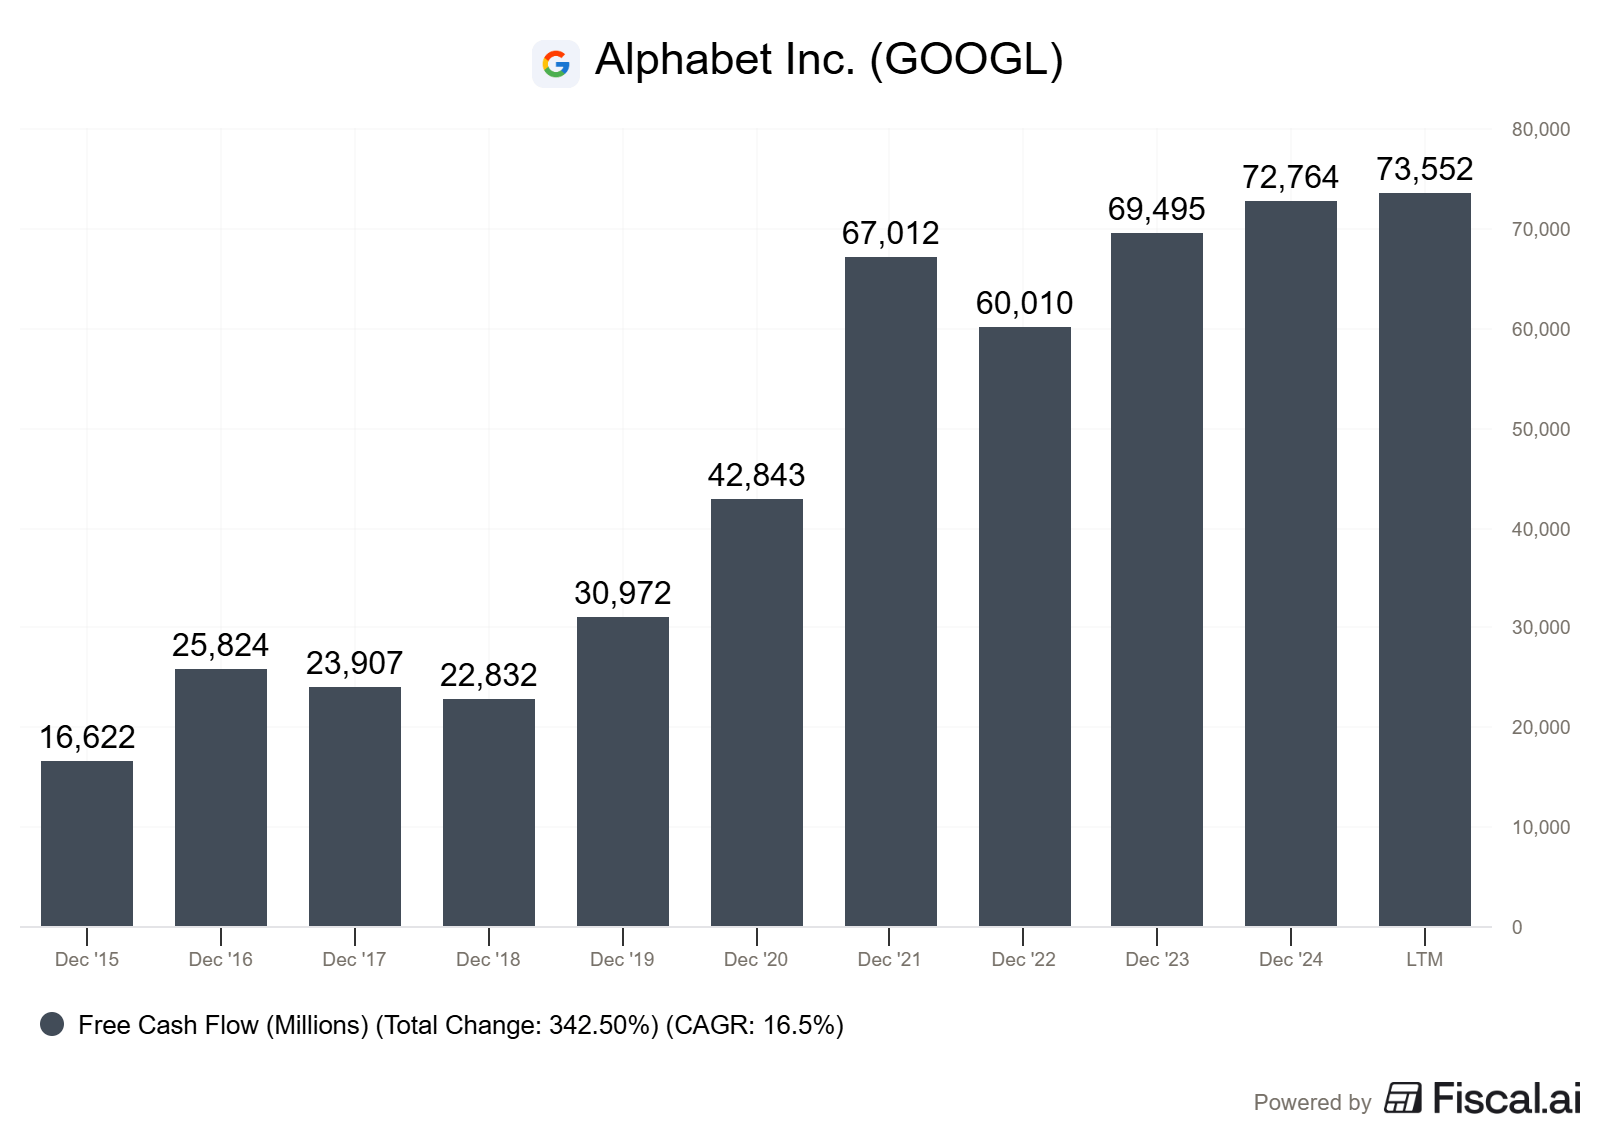
Alphabet (Google’s parent) generates enormous free cash flow. From their 2024 10-K:
Operating cash flow: $125,299 million
Capital expenditures: $52,535 million
Free cash flow: $72,764 million
With 12,447 million shares outstanding, that’s $5.85 in free cash flow per share.
The starting number is huge and verifiable. So far, so good.
But here’s where the theater begins. What growth rate do you assume for Alphabet’s free cash flow?
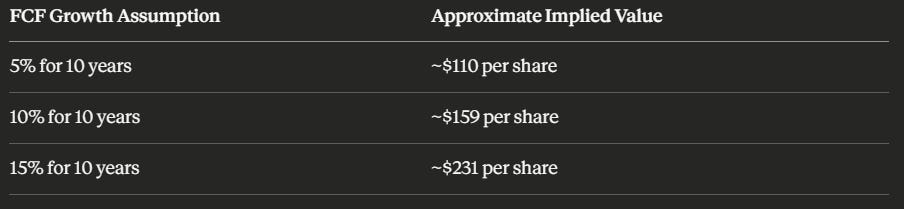
5% (mature company, search is saturated)?
10% (cloud is still growing, AI investments pay off)?
15% (AI creates entirely new revenue streams)?
0% (AI disrupts search, regulatory pressure mounts)?
Each assumption is defensible. Each produces a wildly different valuation. Let me show you how sensitive Alphabet’s valuation is to the growth assumption (using 9% discount rate and 2.5% terminal growth):
Alphabet currently trades at $332 per share with a market cap of $4 trillion.
The spread between these scenarios is enormous. Note that even the most optimistic scenario (15% growth over a decade) doesn’t fully justify the current price at a 9% discount rate. The market is expecting either higher growth, a lower discount rate, or both.
This isn’t a modeling failure. It’s the model telling you the truth: Alphabet’s value depends heavily on assumptions about the future that nobody can verify today.
The minimalist response isn’t to build a more elaborate model with AI revenue projections and cloud growth buildups. That just hides your uncertainty behind more rows in a spreadsheet.
The minimalist response is to acknowledge: “I don’t know which growth scenario is right. Here’s what the stock is pricing in, and here’s what I’d need to believe to find it attractive.”
Reverse DCF: The Minimalist’s Best Friend
Instead of building a model to produce a price target, try working backward. Ask: What assumptions does the current stock price imply?
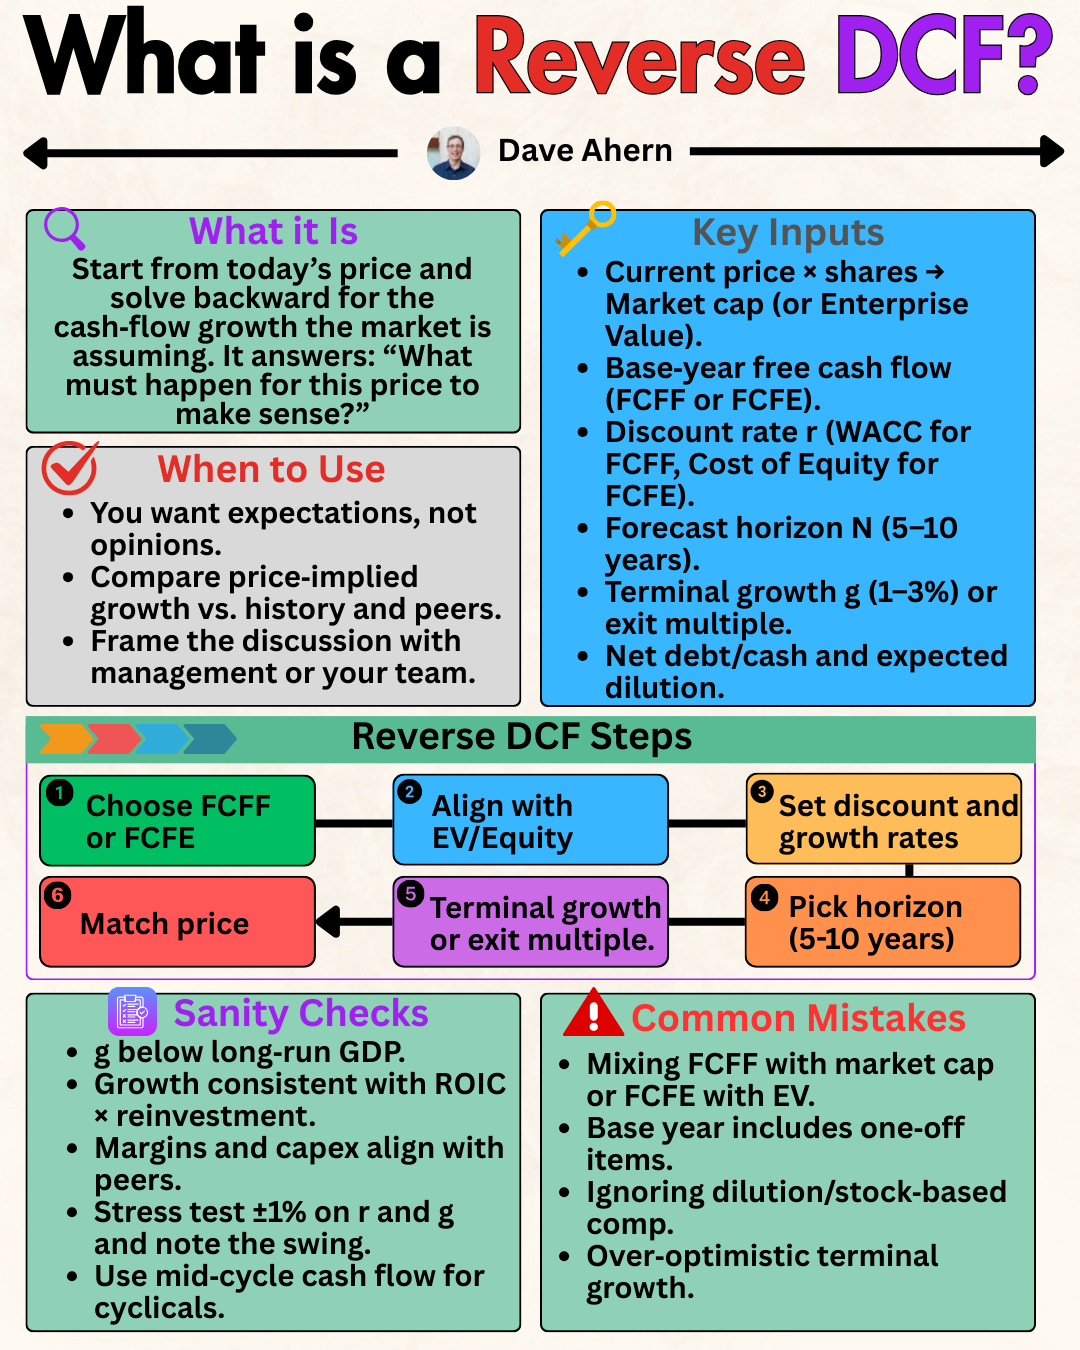
This is called a reverse DCF, and it’s far more useful than forward projections for most investors.
Here’s how it works:
Start with the current stock price and market cap
Input your discount rate and terminal growth assumptions
Solve for the implied growth rate the market is pricing in
For Alphabet, at a stock price of $332 and current free cash flow of $5.85 per share, assuming a 9% discount rate and 2.5% terminal growth, the market implies approximately 18-20% annual FCF growth over the next decade.
Now you have a concrete question to answer: Do I believe Alphabet can grow free cash flow at 18-20% annually for ten years?
For context, that would mean growing from $72.8 billion in annual free cash flow to roughly $380- $480 billion by 2034. That’s a massive number. It’s not impossible, but it requires Alphabet to find enormous new profit pools beyond its current businesses.
This reframes the entire exercise. You’re not pretending to know what Alphabet is worth. You’re evaluating whether the market’s embedded assumptions seem reasonable, optimistic, or pessimistic.
Above, we walked through how to build a minimalist DCF using real-world numbers from Walmart and Alphabet, and why reverse DCF often outperforms forward projections. Below, I'll outline my five principles for using this framework, explain when to skip DCF entirely, and address the most common mistakes I see investors make with these models.
