
Costco: Membership Flywheel and Negative Working Capital

Costco is a case study in quality: a simple model (membership + low price) that compounds through discipline.
The magic is in the accounting, negative working capital, recurring membership revenue, and per‑share stewardship, which together sustain ROIC above WACC. Today, we unpack the mechanics you can reuse on other companies.
TL;DR
Costco monetizes trust through recurring membership fees and passes most unit‑level scale back to members via lower prices.
Accounting tells the story: deferred membership revenue, negative working capital, and high asset turns support ROIC > WACC.
Owner earnings differ from GAAP: normalize for membership deferrals, maintenance capex, and working capital seasonality.
Evidence of moat: 92.9% renewal rate in the US/Canada and 90.5% worldwide (FY2024), stable gross/operating margin bands, and durable store-level unit economics.
Copy this analysis to other retailers by starting at unit economics, then building ROIC/WACC bridges and cash conversion analysis.
Why it matters
For quality investors, the destination is compounding above the firm’s cost of capital. The route is discipline: durable unit economics, reinvestment runway, and capital allocation that compounds per share. Costco shows how:
Base rates: Broadline retail margins are thin; moats are rare. Winning long‑term requires high inventory turns, loyal customers, and low SG&A relative to volume.
Where investors go wrong:
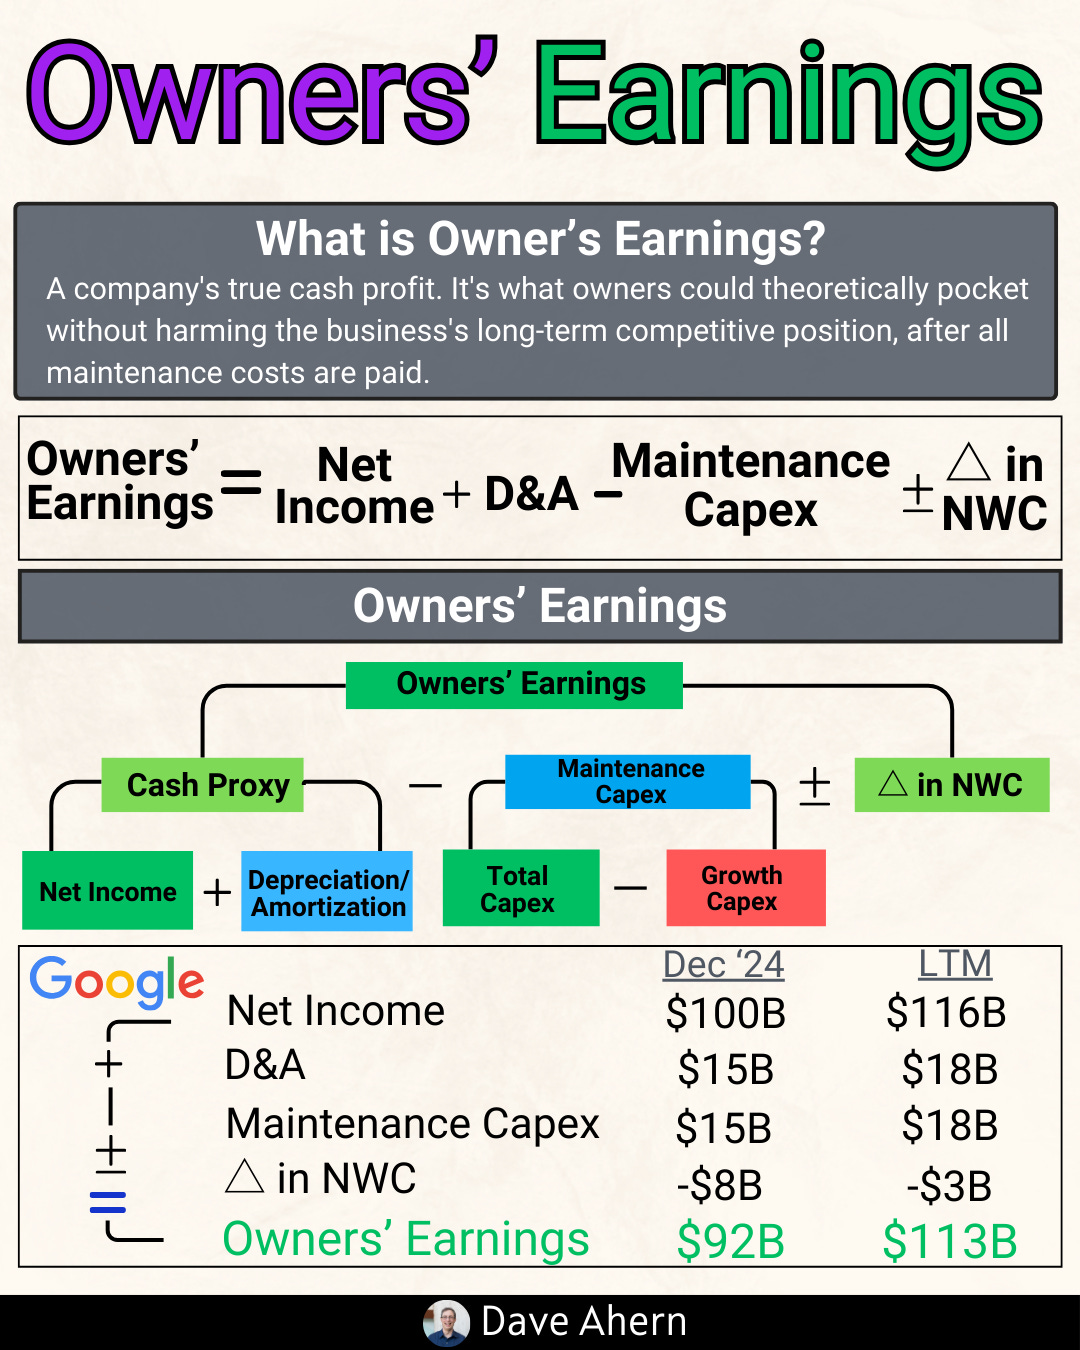
Focusing on GAAP earnings without reconciling to “owner earnings” (free cash flow available to equity)
Ignoring working capital quality (negative cash conversion is a structural edge)
Underweighting renewal rates and membership economics (recurring revenue with minimal cost of goods sold)
Costco’s counterexample: Membership fees, very high renewal rates, and negative working capital mean the business can earn attractive returns despite low gross margins.
Core concepts (quality-investing angle)
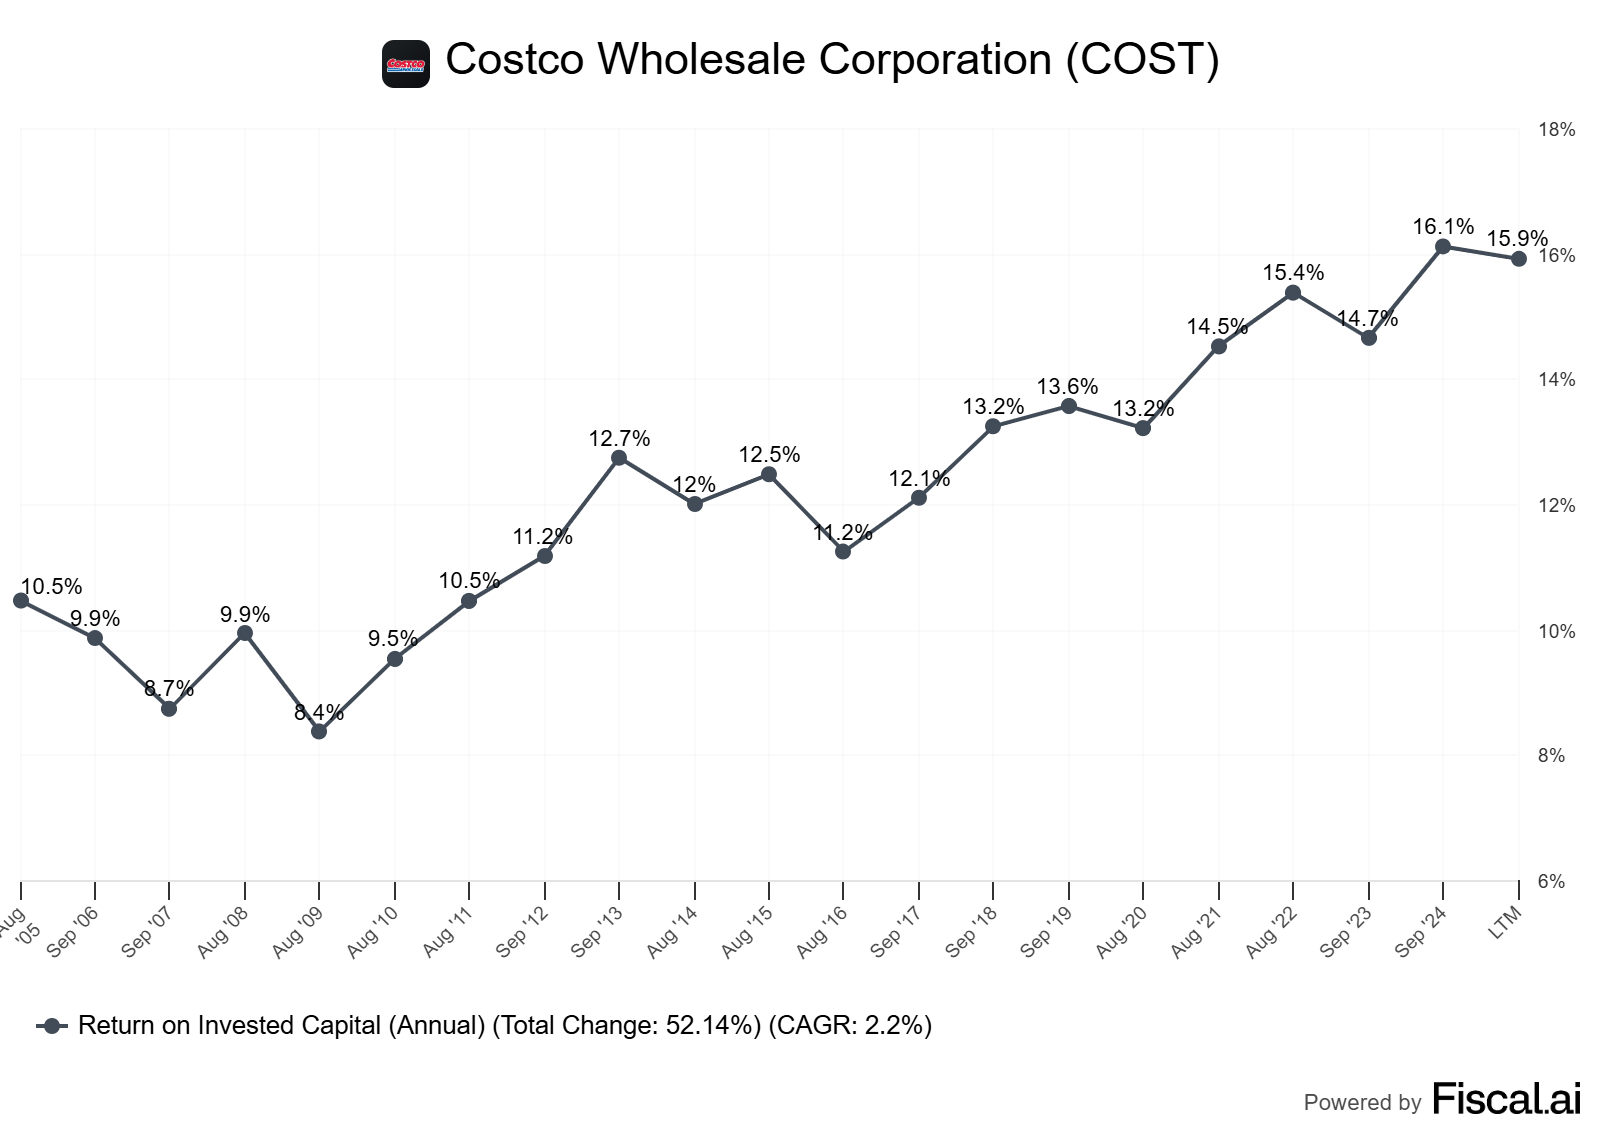
ROIC vs WACC and value creation
ROIC (return on invested capital) measures after‑tax operating income per dollar of operating capital used. WACC is the weighted average cost of capital, which is the blended cost of equity and debt.
Value is created when ROIC > WACC. For retailers, ROIC is usually driven more by asset turns (sales/invested capital) than by margins.
Costco’s design — limited SKUs, high throughput, cross-docking, and membership incentives — reduces turns and capital needs.
Reinvestment runway and capital intensity
Capital intensity is low to moderate per warehouse, but scale and site quality matter.
Reinvestment comes from new warehouses, e‑commerce, and ancillary services (e.g., gas, optical).
Expansion is deliberate: 890 warehouses worldwide at year-end FY2024, up from 861 in FY2023, with further openings anticipated after year-end (Costco FY2024 10-K, as of December 2024).
Unit economics and per‑share metrics
“Unit”: a warehouse plus its local membership base.
Unit‑level success: dense member base, high renewal rates, strong traffic, and high share of wallet.
Per‑share framing: Costco mixes ordinary dividends with occasional large special dividends; share count changes modestly (443,073,537 shares outstanding as of Oct 1, 2024 per 10‑K). Buybacks are not the centerpiece; reinvestment and special dividends are.
Moat durability and evidence (not claims)
Evidence: extremely high renewal rates (92.9% US/Canada; 90.5% worldwide at FY2024 year‑end), steady traffic, and purchasing scale that feeds low prices (Costco FY2024 10‑K, as of Dec 2024).
Switching costs: low on paper, but the sunk cost of membership, perceived value, and habit create behavioral “stickiness.”
Organizational moat: culture and SG&A discipline; store operations tightly standardized.
Case/Accounting Saturday focus: accounting nuances and economic reality
Membership fees are deferred revenue recognized ratably over the membership term; they carry very high incremental margins.
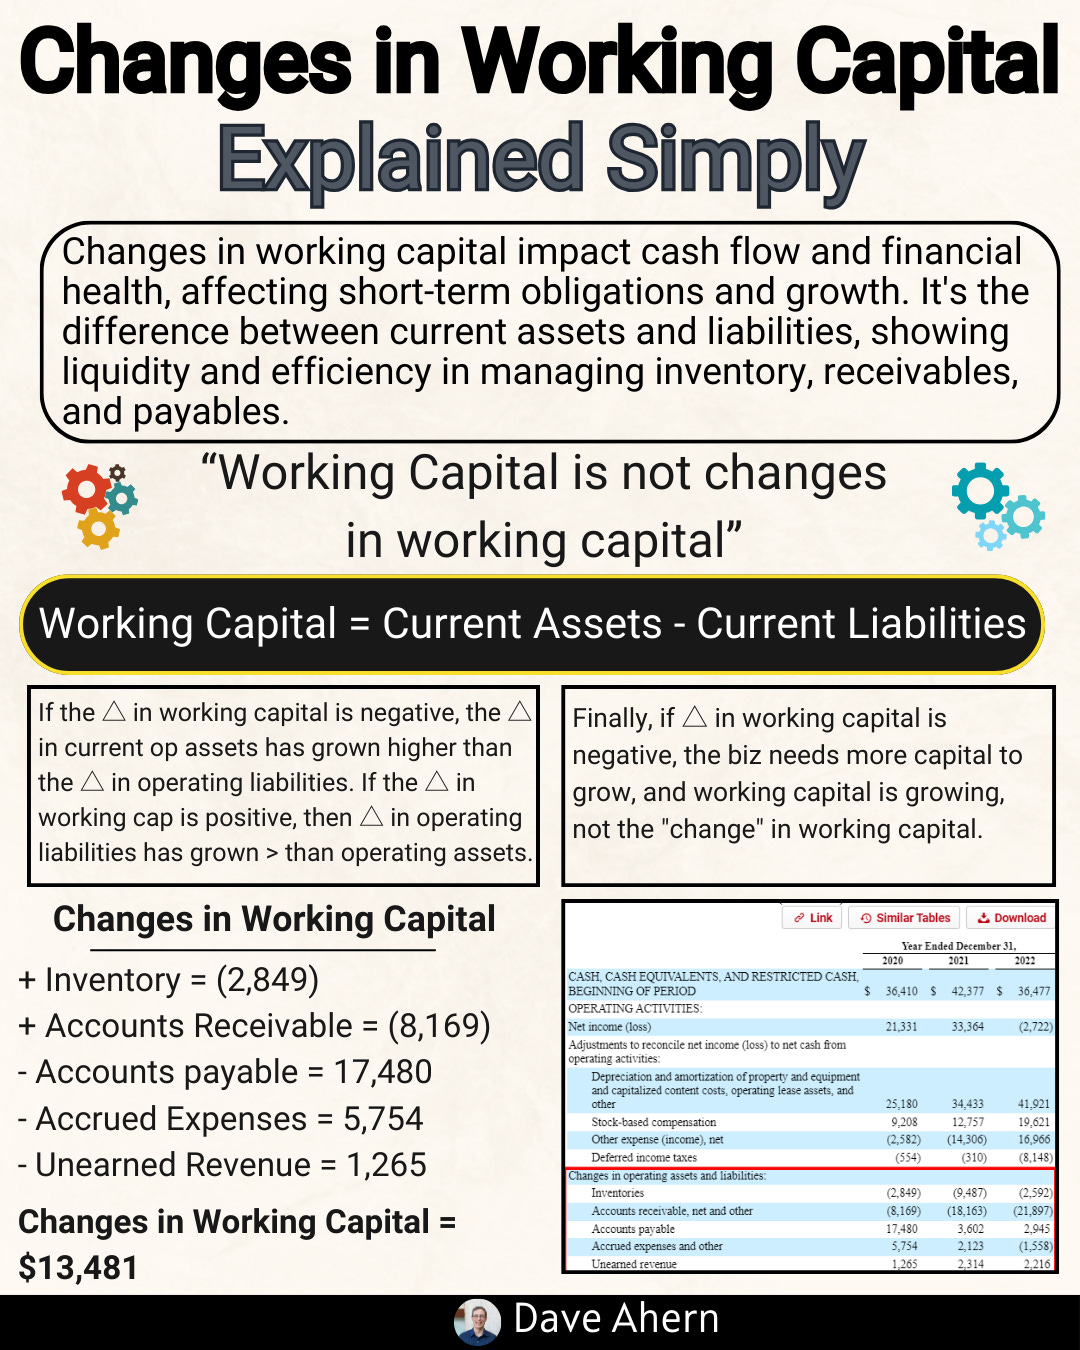
Negative working capital (NWC): Costco often sells inventory before paying suppliers — effectively “supplier financing” that lowers invested capital. From the 10‑K: “We often sell inventory before we are required to pay for it...” (Business section; as of FY2024).
Owner earnings vs GAAP: adjust for non‑cash items, normalize membership revenue deferrals, separate growth vs maintenance capex, and treat working capital seasonality carefully.
Worked example: Costco
We’ll highlight trends and mechanics; use the data as of FY2024 with contextual notes.
Scale and footprint: 890 warehouses at FY2024 year‑end, across the US, Canada, Mexico, Japan, the UK, Korea, Australia, Taiwan, China, Spain, France, Iceland, New Zealand, and Sweden (FY2024 10‑K, as of Dec 2024). The Annual Report map shows 897 locations as of Dec 31, 2024.
Membership engine:
Renewal rate: 92.9% US/Canada and 90.5% worldwide at end of FY2024 (FY2024 10‑K).
Paid members: ~76.2 million; total cardholders: ~136.8 million (FY2024).
Executive members represent a large share of sales; fee increase effective Sep 1, 2024 (Gold Star/Business to $65; Executive $130; maximum 2% reward cap lifted to $1,250) (FY2024 10‑K).
Financial highlights (FY2024):
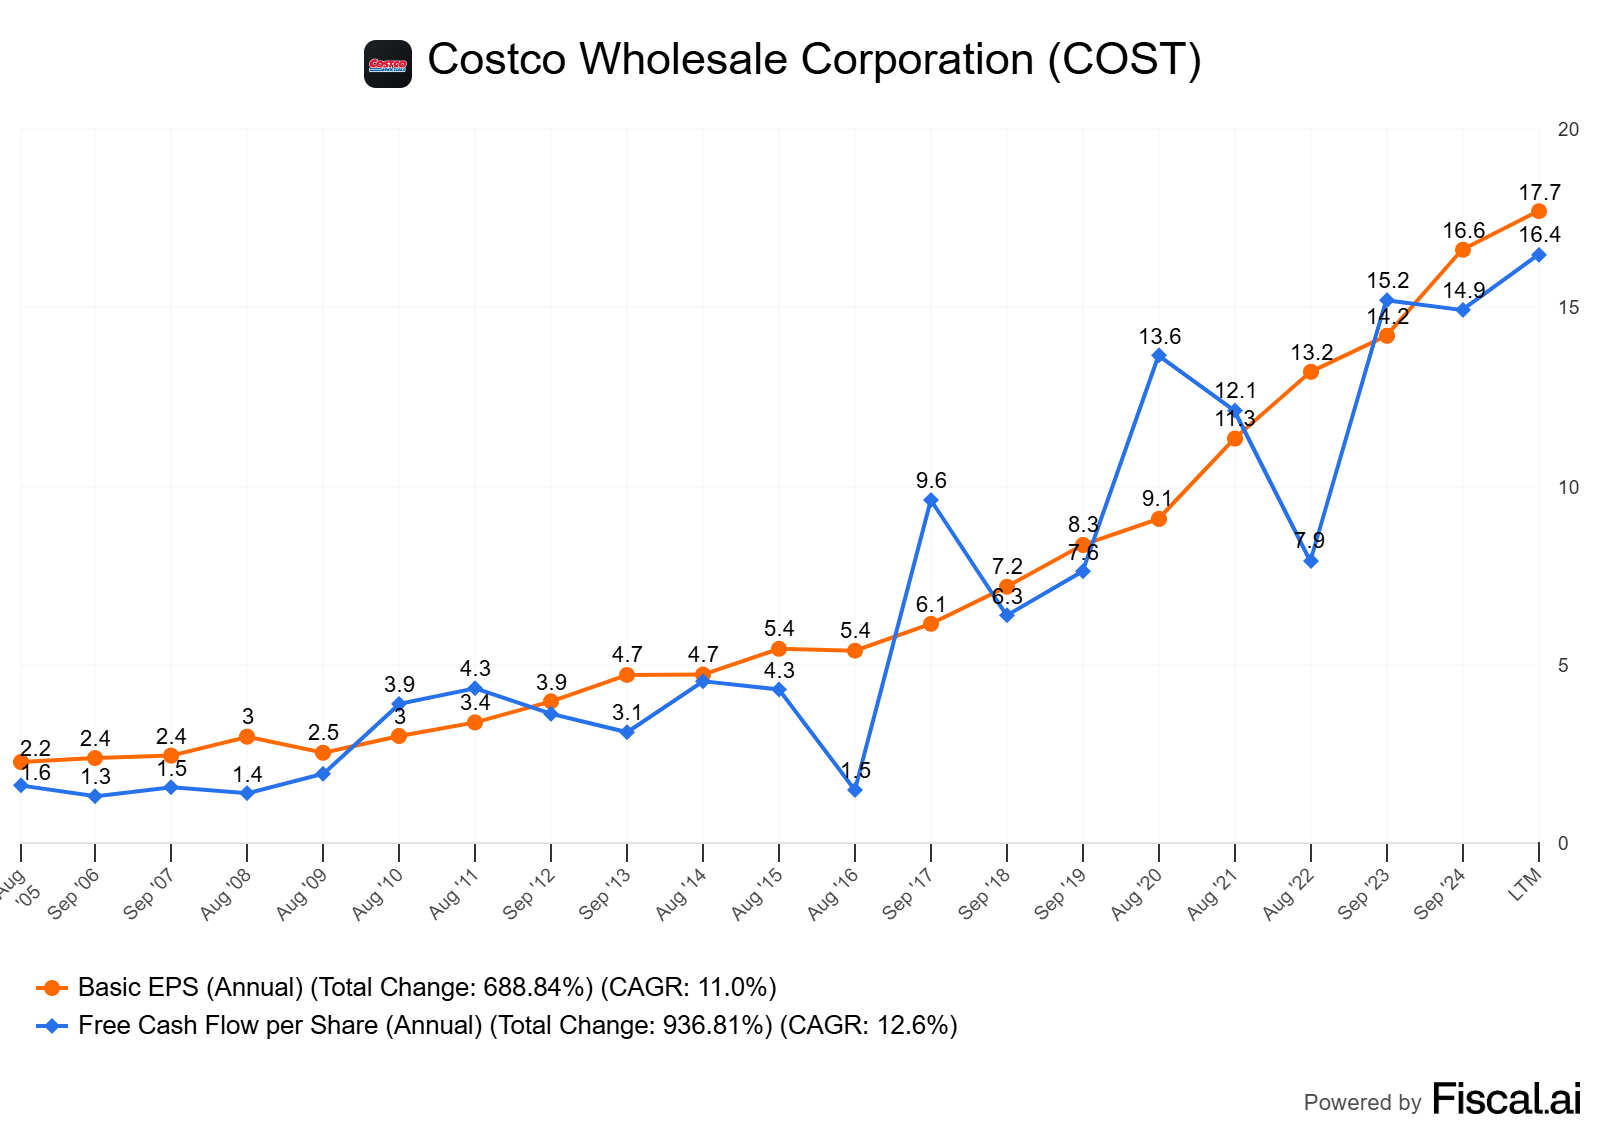
Net sales: $249.6B; net income: $7.4B ($16.56 diluted EPS); membership fee revenue: $4.8B; special dividend: $15/share in Jan 2024 (2024 Annual Report, as of Dec 2024).
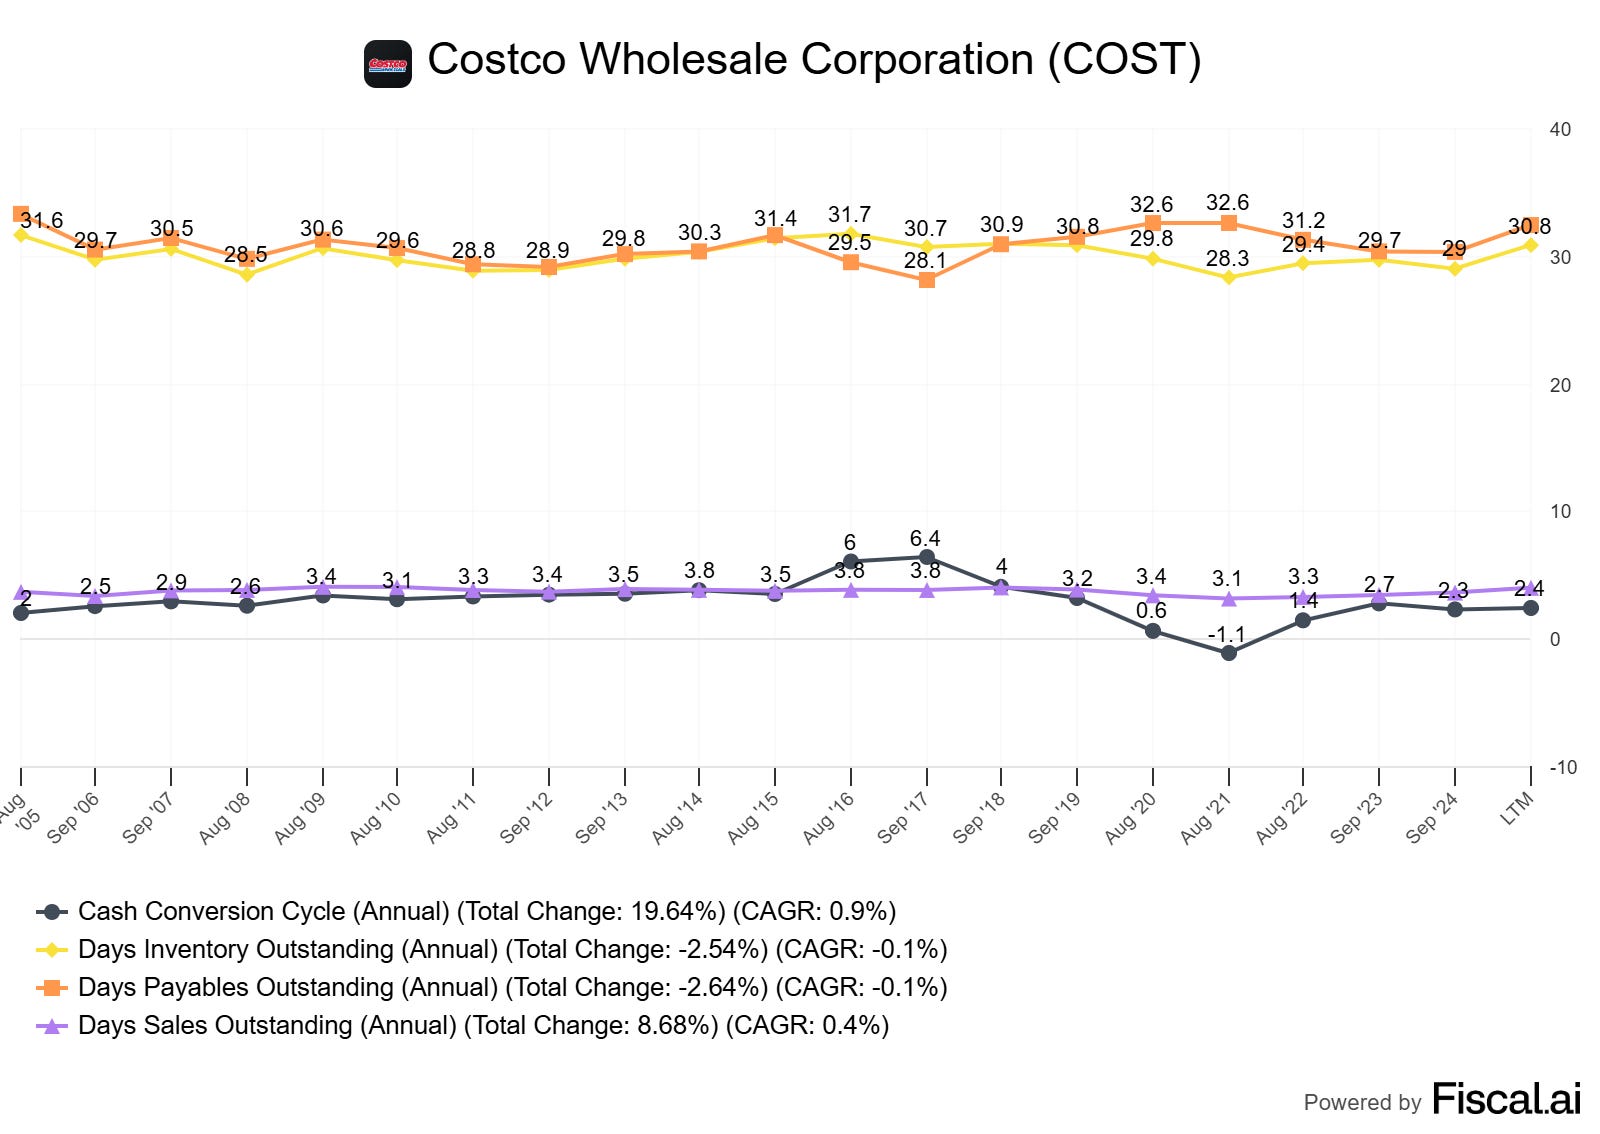
Negative working capital:
Inventory turns remain high; payables days often exceed inventory days, resulting in a negative cash conversion cycle (CCC) — a structural advantage, especially during inflationary periods (per 10-K Business section).
Accounting bridges and trend lenses
Margins: Operating margin bands are tight (Costco’s model is to keep gross margins low and drive volume). Stability here is a moat signal.
ROIC vs. WACC: Although not directly reported in the 10-K, the business design (deferred revenue, negative working capital, high turnover) supports ROIC > WACC.
FCF conversion: Membership fees convert to cash rapidly; normalize for working capital seasonality and growth capex to evaluate “owner earnings.”
Capital allocation scorecard
Reinvestment: steady new warehouse openings.
Dividends: regular dividends plus episodic special dividends (e.g., $15/share in Jan 2024).
Buybacks: opportunistic and modest relative to market cap; per‑share compounding relies more on organic growth and dividends than on large net repurchases.
SBC: present but not the primary lever; monitor dilution vs buybacks.
Caveats and alternative interpretations
Thin margins mean execution risk: any slippage in shrink, labor, or logistics can hit earnings.
Membership fee increases must be rare and justified by value — a pricing‑power test.
International new market risk varies (local retail ecosystems, regulatory environments, and consumer preferences).
How to do this yourself
Step‑by‑step process you can apply to any retailer (or similar subscription‑supported model):
Gather the data
Filings: 10‑K/20‑F, 10‑Q (membership/loyalty details, segment notes, capital commitments, contractual obligations, revenue recognition, and share count).
Investor presentations/press releases for renewal rates, store count, and capex cadence.
If disclosed, historical warehouse cohorts (maturity curve).
Reconstruct ROIC
NOPAT = Operating income × (1 − tax rate).
Invested capital = Net working capital + Net PP&E + Capitalized operating leases (if you choose) + Intangibles used in operations.
Decision rule: Favor businesses with ROIC − WACC > 5% sustained over a cycle.
Inspect the cash conversion cycle
CCC = DSO + DIO − DPO.
Negative CCC indicates supplier financing; validate it across multiple years.
Decision rule: Persistent negative or near‑zero CCC with no deterioration in inventory quality is a positive.
Reconcile GAAP to “owner earnings”
Start with net income.
Add D&A and non‑cash items (exclude stock‑based compensation if you treat it as a real cost; then account for dilution separately in per‑share).
Adjust working capital for sustainable vs transitory changes; consider excluding membership revenue deferral/inflation artifacts to avoid double counting.
Subtract maintenance capex (estimate by sustaining unit count/quality; growth capex is separate).
Decision rule: Prefer stable owner earnings conversion (over multi‑year average) near or above net income in steady‑state.
Analyze unit economics
Define the economic unit (store, cohort, or region).
Estimate ramp to maturity, steady‑state margin, and cash payback period.
Decision rule: Look for short payback periods and strong incremental returns on new units.
Evaluate moat durability with evidence
Renewal rates, churn, pricing spread vs peers, margin stability in inflation/deflation, and customer satisfaction proxies.
Decision rule: Evidence beats claims. Ten years of renewal and margin stability is powerful.
Per‑share framing
Track EPS/FCF per share and share count.
Score capital allocation: reinvestment vs buybacks vs dividends/specials.
Decision rule: Avoid serial diluters without a superior reinvestment ROI.
Pitfalls and false positives
Confusing short‑term inventory timing with structural negative CCC — validate across cycles.
Treating SBC as “free”: it’s either a cash payout deferred or dilution — account for it in per‑share terms.
Overestimating growth runway: site scarcity, market saturation, and international execution can cap compounding.
Ignoring tax and lease nuances in ROIC calculations — stay consistent in what you include in invested capital.
Extrapolating one‑off special dividends into a perpetual capital‑return rate.
Checklist / one-pager
ROIC − WACC ≥ 5% sustained?
CCC ≤ 0 (or improving) without inventory quality deterioration?
Renewal rate stability (multi‑year, high 80s to 90s+) with pricing power evidence?
Owner earnings ≥ multi‑year average net income, after maintenance capex?
Per‑share metrics rising (EPS, FCF/share) with controlled share count?
Capital allocation consistent: reinvestment where IRRs are highest; specials only when excess cash > reinvestment needs.
Margin bands stable over cycles?
Clear evidence of moat: price leadership, scale economics, operational discipline.
Glossary
ROIC: Return on invested capital; NOPAT divided by operating capital.
WACC: Weighted average cost of capital; blended cost of equity and debt.
CCC: Cash conversion cycle; DSO + DIO − DPO.
Maintenance capex: Spending to sustain current operations (vs growth capex).
Owner earnings: Cash flows available to owners after maintenance needs.
Deferred revenue: Cash received before revenue is earned (e.g., membership fees).
Asset turns: Sales divided by invested capital; a ROIC driver.
Renewal rate: % of members who renew over a period; proxy for loyalty/moat.
Further reading
Costco FY2024 Annual Report (includes 10‑K) — company narrative and key metrics (as of Dec 2024).
Costco Investor Relations News Releases — quarterly operating updates (as of 2024–2025).
SEC Filings page for Costco — full historical 10‑K/10‑Q archive (as of 2024–2025).
References
Costco 2024 Annual Report and Form 10‑K (Fiscal year ended Sep 1, 2024): membership counts, renewal rates, fee changes, dividends, and business model details (as of Dec 2024). PDF
Costco FY2024 Operating Results press release: quarterly context and membership fee revenue (as of Sep 2024). Investor Relations
Costco FY2025 Q3 Operating Results press release: sales growth context (as of May 2025). Investor Relations
SEC filing archive for Costco: renewal rate, membership, and share count disclosures (as of 2024–2025). SEC Filings
Costco FY2024 10‑K membership section: renewal rates 92.9% US/Canada and 90.5% worldwide; fee increase effective Sep 1, 2024 (as of Dec 2024). 10‑K in Annual Report PDF
Disclaimer
Educational content, not investment advice.