
💰Why We're Avoiding This 10% Yielder
How To Spot a Dividend Trap From Scratch: Conagra ($CAG)

A double-digit dividend yield from a 100-year-old food company sounds like found money.
That is exactly when I slow down.
When I screened high yielders recently, Conagra Brands (CAG) jumped out with a yield north of 10%. I read the filings, ran the numbers, and passed. This post walks through why.
The lesson matters more than the stock. A high yield is the last number I check. The number that lures you in tells you almost nothing about whether the cash will keep flowing. The business does.
In today’s post, we will learn:
What a yield trap actually is, and why the yield rises
How to analyze the business before you touch the dividend
How to read payout ratios and free cash flow payout ratios
A simple checklist for stress-testing any high yield
The common mistakes that catch income investors
Okay, let’s dive in and use Conagra as our guinea pig.
Why a high yield is usually a symptom
Dividend yield is simple math. You take the annual dividend per share and divide it by the share price.
That means a yield can climb for two very different reasons.
The healthy reason is that a company raises its dividend while the business grows underneath it. The unhealthy reason is that the share price collapses while the dividend stays put. The yield looks identical on a screener. The story behind it is night and day.
Conagra is the second kind.
The company last raised its dividend in October 2023, to an annualized $1.40 per share ($0.35 a quarter) from $1.32, and it has not raised that rate since (per Conagra’s fiscal 2024 and fiscal 2025 8-K earnings releases). The yield did not climb because the payout grew. It climbed because the stock fell more than 40% from its 52-week high.
That is the definition of a yield trap. A fat yield created by a falling price, attached to a business that is shrinking.
The trap works because the headline number is real. You really do collect that yield, right up until the dividend gets cut. And when it gets cut, the price usually falls again, so you lose on both ends.
So the yield is where I finish. The business is where I start.
Step one: analyze the business, not the dividend
A dividend is an output. It gets paid out of the cash a business generates. If the cash dries up, the dividend follows, no matter how proud management is of the streak.
So the first question is always the same. Is the underlying business getting stronger or weaker?
Let’s look at Conagra’s top line. Here are net sales over the last few years:
FY2025 net sales: $11.6 billion, down 3.6% (organic down 2.9%)
FY2024 net sales: $12.05 billion
FY2026 guidance: organic net sales change of (1)% to 1%, basically flat
(per Conagra’s fiscal 2025 10-K and third-quarter fiscal 2026 earnings release)
Sales have been flat to down for three straight years. A packaged-food company living on legacy brands like Healthy Choice, Marie Callender’s, Banquet, and Slim Jim is fighting falling volumes and price-sensitive shoppers.
Flat revenue is survivable. Falling earnings power is the real problem.
Here is the metric that tells the story. Adjusted EPS strips out one-time items and shows the underlying profit trend:
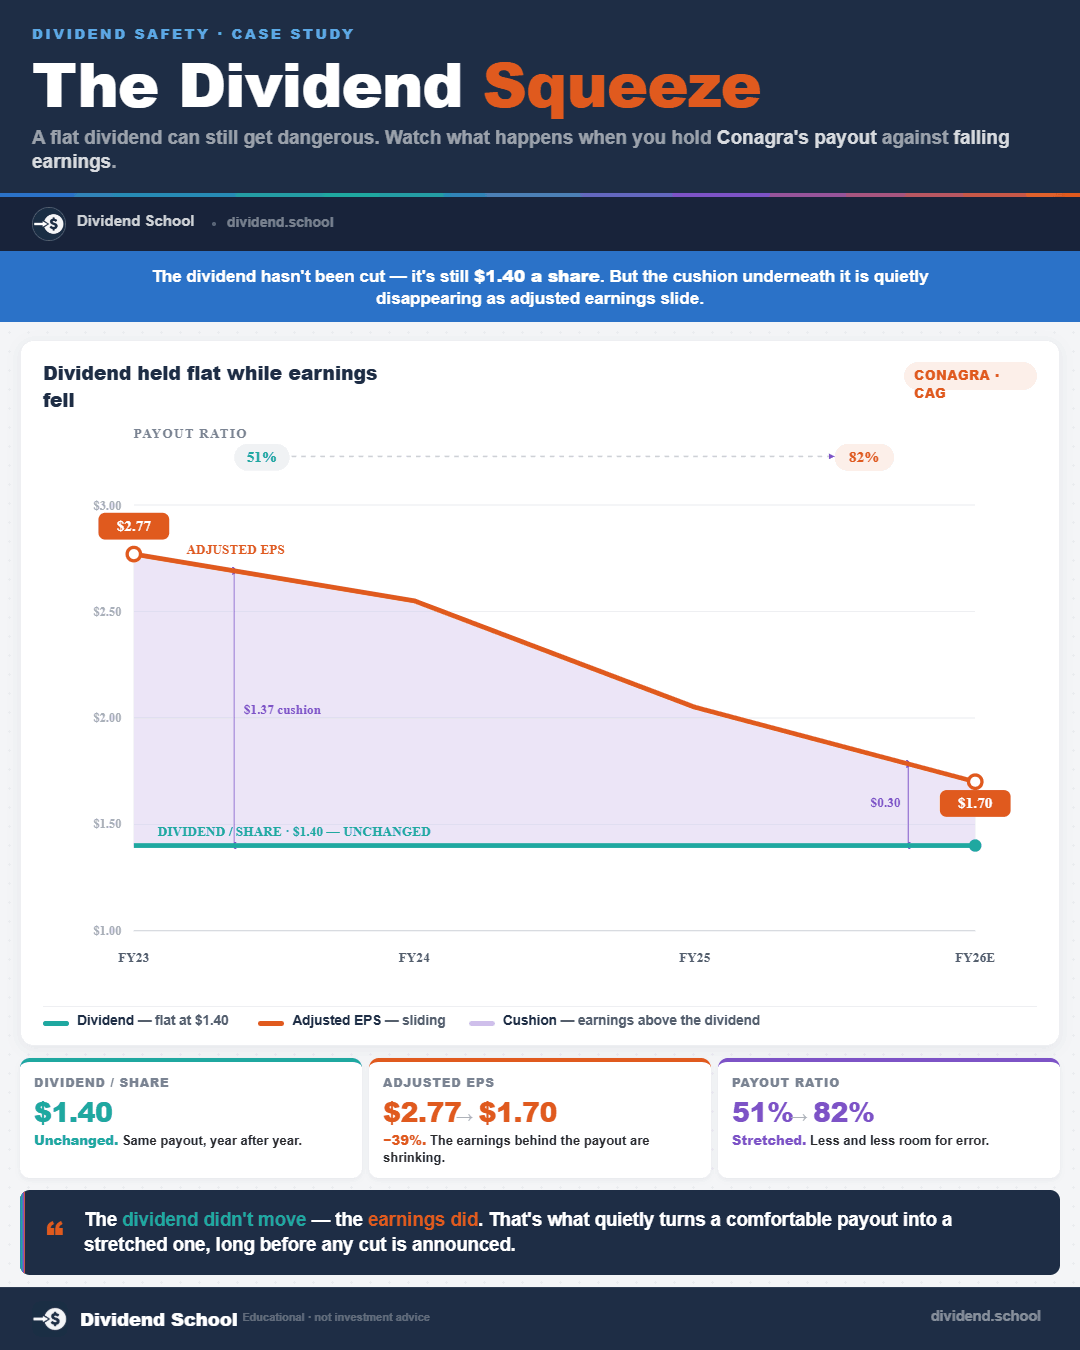
FY2023 adjusted EPS: $2.77
FY2024 adjusted EPS: $2.67
FY2025 adjusted EPS: $2.30
FY2026 guidance: approximately $1.70
(per Conagra’s fiscal 2023 through fiscal 2025 8-Ks and the third-quarter fiscal 2026 earnings release)
Through fiscal 2025, adjusted EPS is already down about 17%. If guidance holds, that becomes a roughly 39% decline by fiscal 2026, against a dividend that has been frozen at $1.40 since the last raise. You can already feel the squeeze coming.
If you want to spot a yield trap before it traps you, that is the whole reason this newsletter exists. One dividend breakdown in your inbox, free, every week.
The impairment nobody wants to talk about
Now for the part that put this stock in my too-hard pile.
In its second quarter of fiscal 2026, Conagra reported a diluted loss of $1.39 per share, driven mainly by non-cash goodwill and brand impairment charges (per the second-quarter fiscal 2026 8-K).
An impairment is management telling you, in accounting language, that the brands carried on the balance sheet are worth less than they used to think. When a food company writes down the value of its own brands, it is admitting the moat is leaking.
These charges are non-cash, so they do not directly drain the bank account. They matter anyway. They are the clearest signal that the business is worth less than it was, and they dragged Conagra’s trailing earnings into the red, which is why the stock now screens with no meaningful P/E at all.
A company impairing its own brands is the opposite of the See’s Candies story, where the brand let Buffett raise prices for fifty years.
Step two: stress-test the dividend with payout ratios
Once you understand the business, you test whether it can keep funding the payout. I use two ratios, and I always look at the trend, not a single year.
The first is the payout ratio. You divide the dividend per share by earnings per share. It tells you what slice of profit goes out the door.
Watch what happens as the dividend gets raised once, then frozen, while earnings fall:
FY2023: $1.32 / $2.77 = 48%
FY2024: $1.40 / $2.67 = 52%
FY2025: $1.40 / $2.30 = 61%
FY2026 (guided): $1.40 / $1.70 = 82%
The payout ratio climbed from the high 40s toward a guided 82% in three years. After the October 2023 raise, the dividend never moved again. Earnings did all the work. A payout pushing past 80% leaves almost no cushion for a bad year.
The second ratio is the one I trust most for a capital-heavy business: the free cash flow payout ratio.
Free cash flow is the cash left after a company pays to run and maintain itself. You take cash from operations and subtract capital expenditures. Dividends get paid in cash, so cash coverage is what actually keeps the check from bouncing.
On a full-year basis, fiscal 2025 looked fine:
Cash from operations: about $1.7 billion
Capital expenditures: $389 million
Free cash flow: about $1.3 billion ($1,303 million)
Dividends paid: $669 million
Free cash flow payout ratio: 51%
(per Conagra’s fourth-quarter fiscal 2025 8-K and the fiscal 2025 proxy statement)
Fifty-one percent is comfortable. If I had stopped at the fiscal 2025 annual report, I would have called this dividend safe.
So I looked at the most recent numbers. They tell a different story.
When the cushion starts to thin
Here is fiscal 2026 so far, straight from the earnings releases.
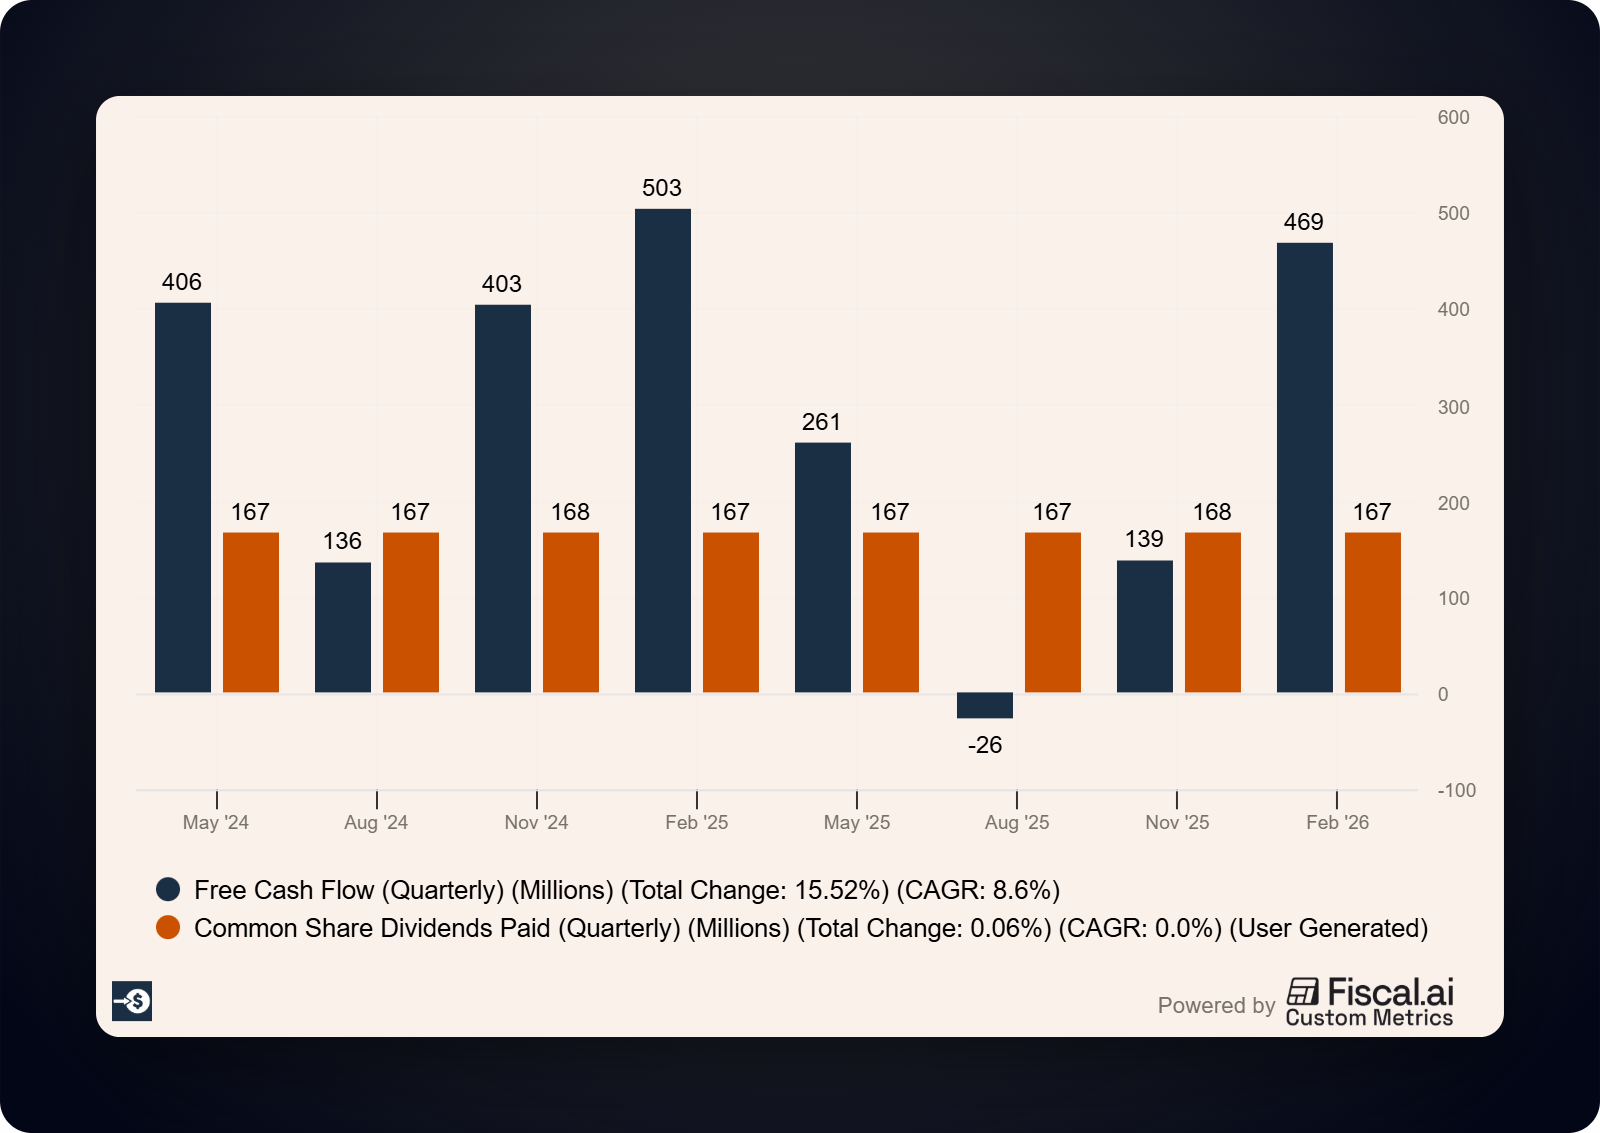
First quarter (8-K):
Free cash flow: negative $26 million
Dividends paid: $167 million
First half (8-K):
Free cash flow: $113 million
Dividends paid: $335 million
Free cash flow payout ratio: 296%
In the first half of its current year, Conagra paid out nearly three times the free cash flow it produced. The balance sheet covered the gap.
Now, one honest caveat. Food companies generate most of their cash in the back half of the fiscal year, so a weak first-half payout ratio always looks scarier than the full year will. In its third-quarter update, management guided full-year free cash flow conversion of about 105% of adjusted net income.
That points to full-year free cash flow well below the $1.3 billion Conagra earned in fiscal 2025, against a dividend that still costs about $669 million a year. The full-year payout is probably still covered. The cushion that was 51% is heading toward the high 70s, on a business whose earnings are still falling.
A shrinking margin of safety on a shrinking business is how a safe-looking dividend turns into an unsafe one.
Step three: check the balance sheet for competing claims
The cash that pays the dividend is the same cash that pays down debt. When a company carries a lot of debt, those two priorities fight.
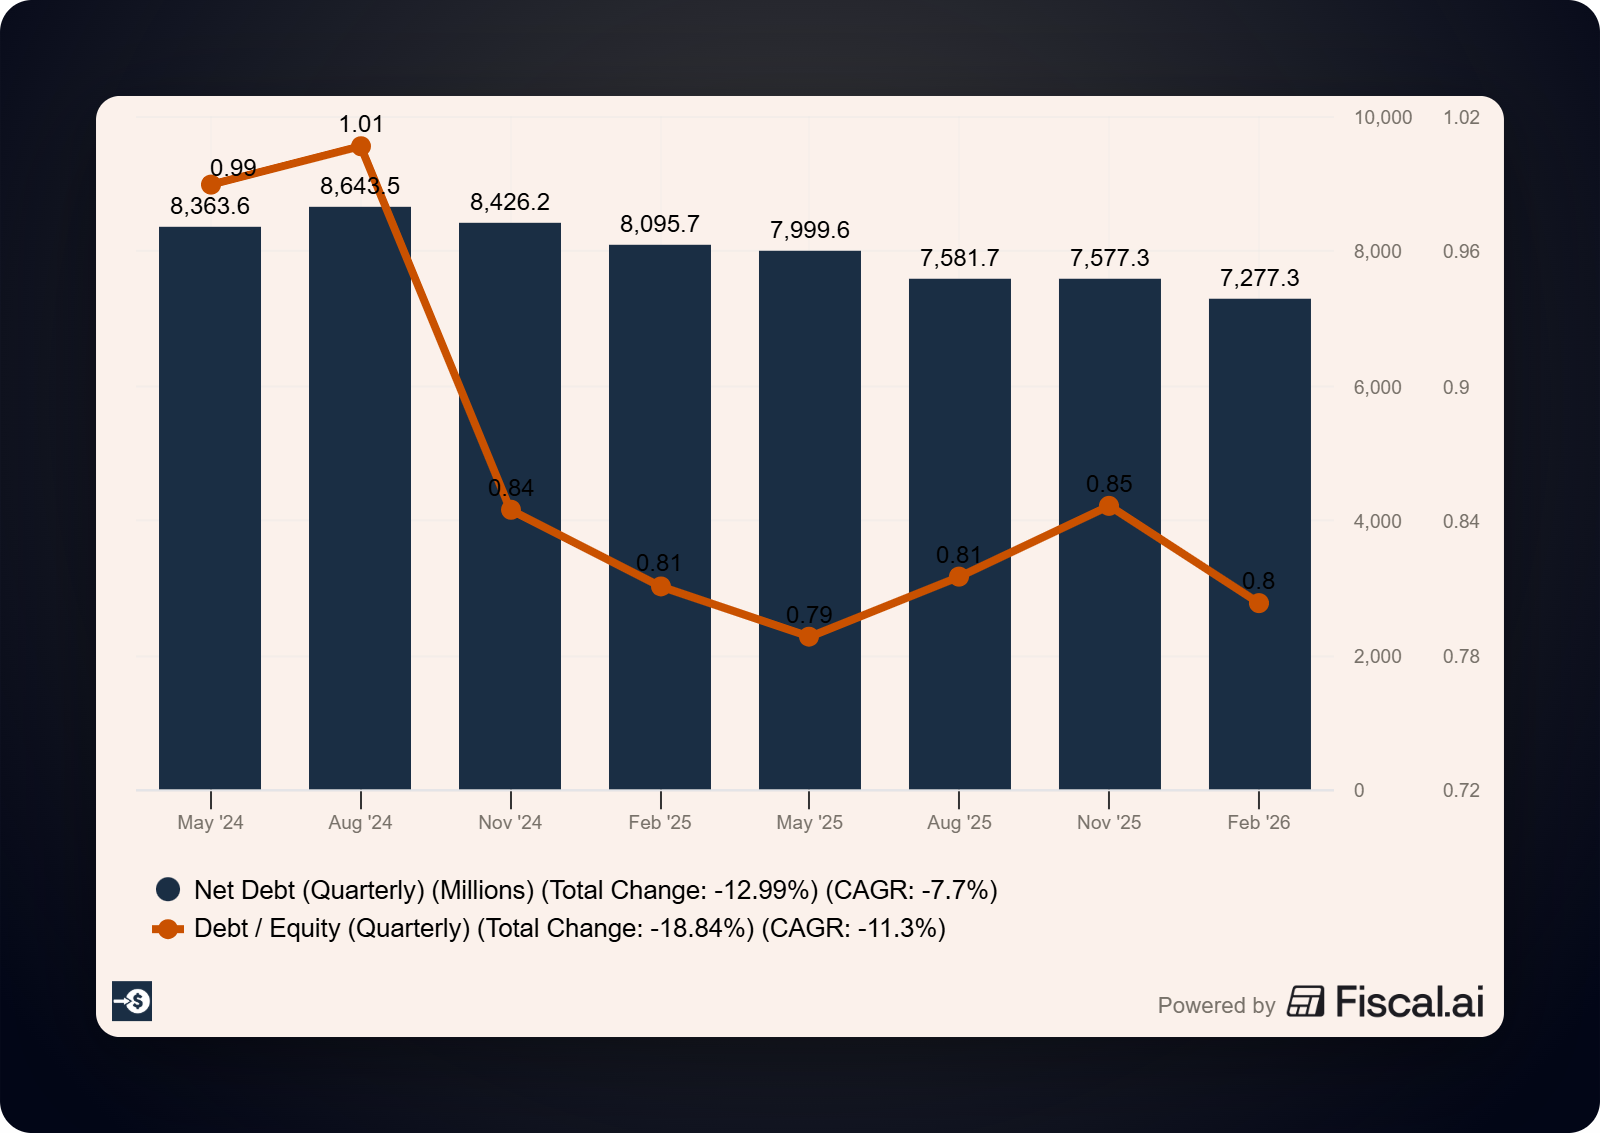
Conagra ended fiscal 2025 with net debt of about $8.0 billion and a net leverage ratio of 3.6 times (per the fourth-quarter fiscal 2025 8-K). Management has been clear that protecting its investment-grade credit rating and reducing leverage sit at the top of the list.
That is the bind. Earnings are falling, the payout ratio is climbing toward 80%, free cash flow is shrinking, and a big debt load is competing for every dollar. Something usually gives. More often than not, the dividend is the release valve.
How to use this in your own process
You do not need a finance degree to run this analysis. You need the habit of asking the questions in the right order.
Here is the checklist I use on any stock with a yield that looks too good:
Why is the yield high? Did the dividend grow, or did the price fall? A price-driven yield is a red flag.
Is the business growing or shrinking? Check three years of revenue and adjusted EPS, not one.
Are there impairments? A company writing down its own brands or goodwill is telling you something.
What is the payout ratio, and which way is it trending? A frozen dividend plus falling earnings equals a rising payout. Above 80% is a warning.
Is the dividend covered by free cash flow? Use cash from operations minus capital expenditures, and look at the full year alongside the recent trend.
How much debt is competing for the cash? High leverage plus a high payout narrows a company’s options fast.
Run those six questions and the high yielders sort themselves into two piles pretty quickly.
Common mistakes income investors make
The biggest one is buying the yield and skipping the business. The screener shows 10%, the brand name feels familiar, and the analysis stops there.
The second is trusting reported EPS without looking closer. Conagra’s reported earnings have been whipped around by a big tax benefit in one year and impairments in another. Adjusted EPS and free cash flow give you a cleaner read on what the business actually earns.
The third is anchoring on one good year. Fiscal 2025’s free cash flow payout of 51% looked great in isolation. The trend underneath it was the real signal.
The last one is assuming a long-paying company will always pay. A dividend is a board decision, reviewed every quarter. A board defending a credit rating will choose the balance sheet over the payout when it is forced to choose.
The takeaway
A dividend is only as safe as the business behind it, so analyze the company first and let the yield be the last number you check.
I passed on Conagra because the business is shrinking, the brands are being impaired, the payout ratio is marching toward 80%, and the cash cushion is thinning while a heavy debt load competes for the same dollars. The 10% yield is the bait. The deteriorating business is the trap.
That does not make Conagra un-investable at every price, and it does not guarantee a cut next quarter. It means the headline yield is doing a poor job of describing the risk, and that is reason enough for me to look elsewhere for my income.
That is going to wrap up our discussion for today.
As always, thank you for taking the time to read this post, and I hope you find something of value on your investing journey.
If I can further assist, please don’t hesitate to reach out.
Until next time, take care and be safe out there,
Dave