
Comparing Dividend Kings: JNJ vs. PG vs. KO

Three companies. Over 190 combined years of consecutive dividend increases. Each one a household name you have probably used this week. But which one actually deserves your investment dollars?
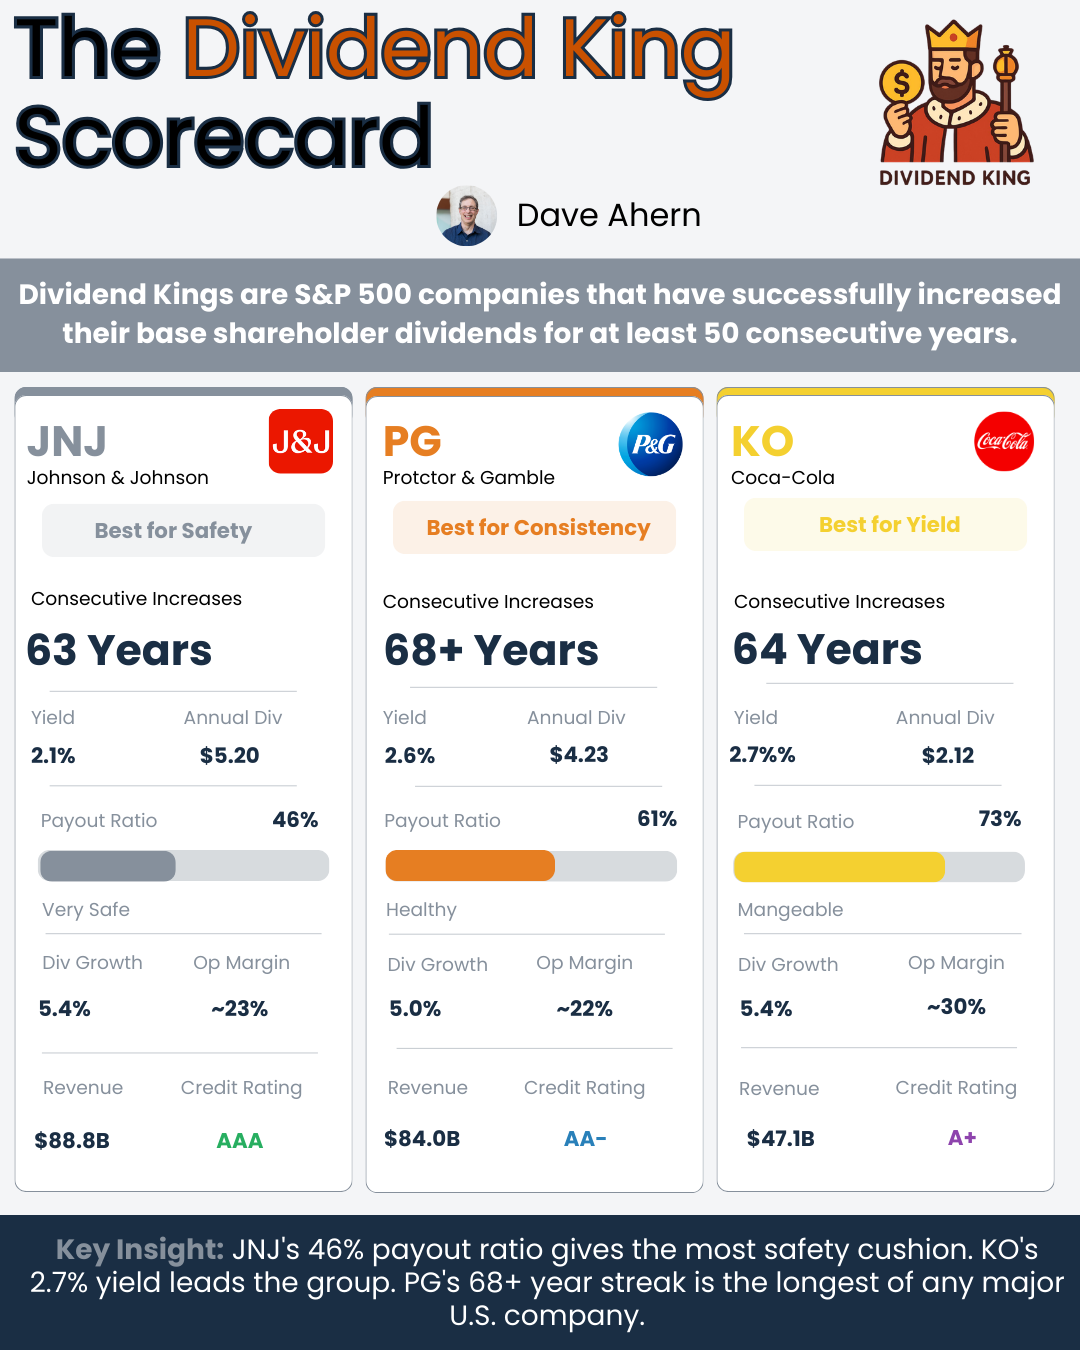
Johnson & Johnson (JNJ), Procter & Gamble (PG), and Coca-Cola (KO) sit at the top of the Dividend King list. All three have raised their payouts for more than 60 consecutive years, surviving recessions, pandemics, wars, and every market crash in between. For income investors, these three names come up in almost every portfolio conversation.
The problem is that “Dividend King” status alone does not tell you whether the stock is a good investment today. A long streak of dividend increases is impressive, but it is backward-looking. What matters is whether the company can keep growing that dividend for the next 10, 20, or 30 years. That requires looking under the hood at the business fundamentals driving those payouts.
In today’s post, we will learn:
What Makes a Dividend King (and Why It Matters)
How JNJ, PG, and KO Compare on Revenue, Margins, and Cash Flow
The Dividend Track Record: Yield, Growth Rate, and Payout Safety
Balance Sheet Strength and Financial Resilience
How to Use This Framework in Your Own Investing Process
Okay, let’s dive in and learn more about these three Dividend Kings.
What Makes a Dividend King (and Why It Matters)
A Dividend King is a company that has increased its dividend for at least 50 consecutive years. Only about 55 companies in the entire U.S. stock market qualify. Think about what that means. A 50-year streak requires raising the dividend through the 1970s stagflation, the early 1980s recession, the dot-com crash, the 2008 financial crisis, and the 2020 pandemic.
That kind of consistency does not happen by accident. It requires a business with durable competitive advantages, disciplined capital allocation, and products or services that people keep buying regardless of economic conditions. Warren Buffett would call these businesses with “wide moats.”
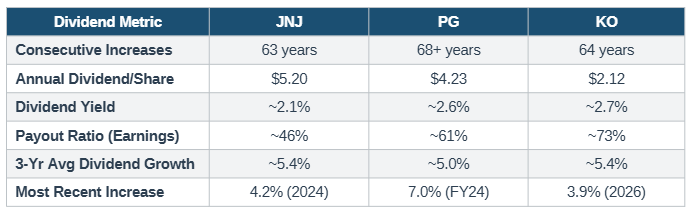
Our three companies today sit in elite territory even among Dividend Kings. Johnson & Johnson has raised its dividend for 63 consecutive years. Procter & Gamble leads the pack with over 68 consecutive years of increases (the longest active streak among major U.S. companies). Coca-Cola just announced its 64th consecutive annual increase in February 2026. These are not just Dividend Kings. They are the royalty of the royalty.
But here is the key insight: the streak itself is the output, not the input. The input is the quality of the business underneath. Let’s examine what drives each company’s ability to keep that streak alive.
Want to run this comparison yourself on any dividend stock? Paid members get my Dividend Safety Spreadsheet, with built-in formulas for payout ratios, yield analysis, and balance sheet scoring. No manual math required.
Understanding the Three Businesses
Before we compare the numbers, we need to understand what each company actually does. This is Buffett’s first filter: invest in businesses you can understand.
Johnson & Johnson (JNJ) operates in two segments following the spin-off of its consumer health division (now Kenvue) in 2023. The company’s Innovative Medicine segment sells pharmaceutical products like Darzalex, Tremfya, and Stelara. The MedTech segment makes surgical instruments, orthopedic devices, and contact lenses. JNJ reported full-year 2024 revenue of $88.8 billion, with operational sales growth of 5.9%. The company is heavily R&D-intensive, investing $17 billion (19.4% of sales) back into its pipeline during 2024.
Procter & Gamble (PG) is the world’s largest consumer staples company. Think Tide, Charmin, Pampers, Gillette, Crest, and Bounty. The company operates across five segments: Fabric & Home Care, Baby, Feminine & Family Care, Beauty, Health Care, and Grooming. PG reported fiscal year 2024 (ending June 2024) revenue of $84.0 billion with organic sales growth of 4%. This company’s advantage is brand power across everyday necessities that consumers constantly repurchase.
Coca-Cola (KO) is the world’s largest non-alcoholic beverage company. Beyond its flagship Coca-Cola brand, the portfolio includes Sprite, Fanta, Minute Maid, Dasani, and Coca-Cola Zero Sugar. The company reported full-year 2024 net revenue of $47.1 billion with organic revenue growth of 12%. KO operates as a concentrate and syrup manufacturer, licensing its brands to independent bottling partners worldwide. This asset-light model is fundamental to understanding its financial profile.
Each company sells products that are essentially recession-proof. People still need medicine, laundry detergent, and something to drink regardless of what the economy is doing. That defensive quality is what enables the multi-decade dividend streaks.
Head-to-Head: The Financial Comparison
Now let’s look at where these three companies stand on the metrics that matter most for dividend investors. I’ll walk through each category and explain what the numbers tell us.
Revenue and Growth
Johnson & Johnson is the largest of the three by revenue, generating $88.8 billion in fiscal year 2024 (per its Q4 2024 earnings release filed with the SEC on January 22, 2025). Procter & Gamble follows at $84.0 billion (per its fiscal year 2024 10-K). Coca-Cola is smaller at $47.1 billion but punches well above its weight on profitability metrics, which we will see shortly.
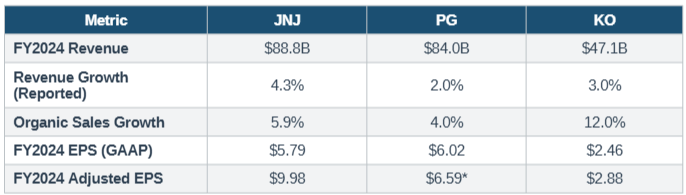
*PG reports Core EPS; JNJ and KO report Adjusted/Comparable EPS. Sources: SEC filings (earnings releases and 10-K).
A few things jump out from this table. Coca-Cola’s 12% organic revenue growth leads the group by a wide margin. However, context matters here. More than half of KO’s price/mix growth came from inflationary pricing in Argentina, which inflates the organic growth number. Still, even adjusting for that, KO delivered a strong top-line performance. JNJ’s 5.9% operational growth is impressive for a company of its size, driven primarily by the Innovative Medicine segment. PG’s 4% organic growth represents its sixth consecutive year of 4%+ organic growth, which speaks to consistency.
The large gap between JNJ’s GAAP EPS ($5.79) and adjusted EPS ($9.98) deserves attention. That $4.19 difference is primarily attributable to acquired in-process research and development (IPR&D) charges related to acquisitions throughout 2024. These are real expenses, but they represent investments in future growth rather than operational deterioration. Still, investors should always check what gets excluded from “adjusted” numbers.
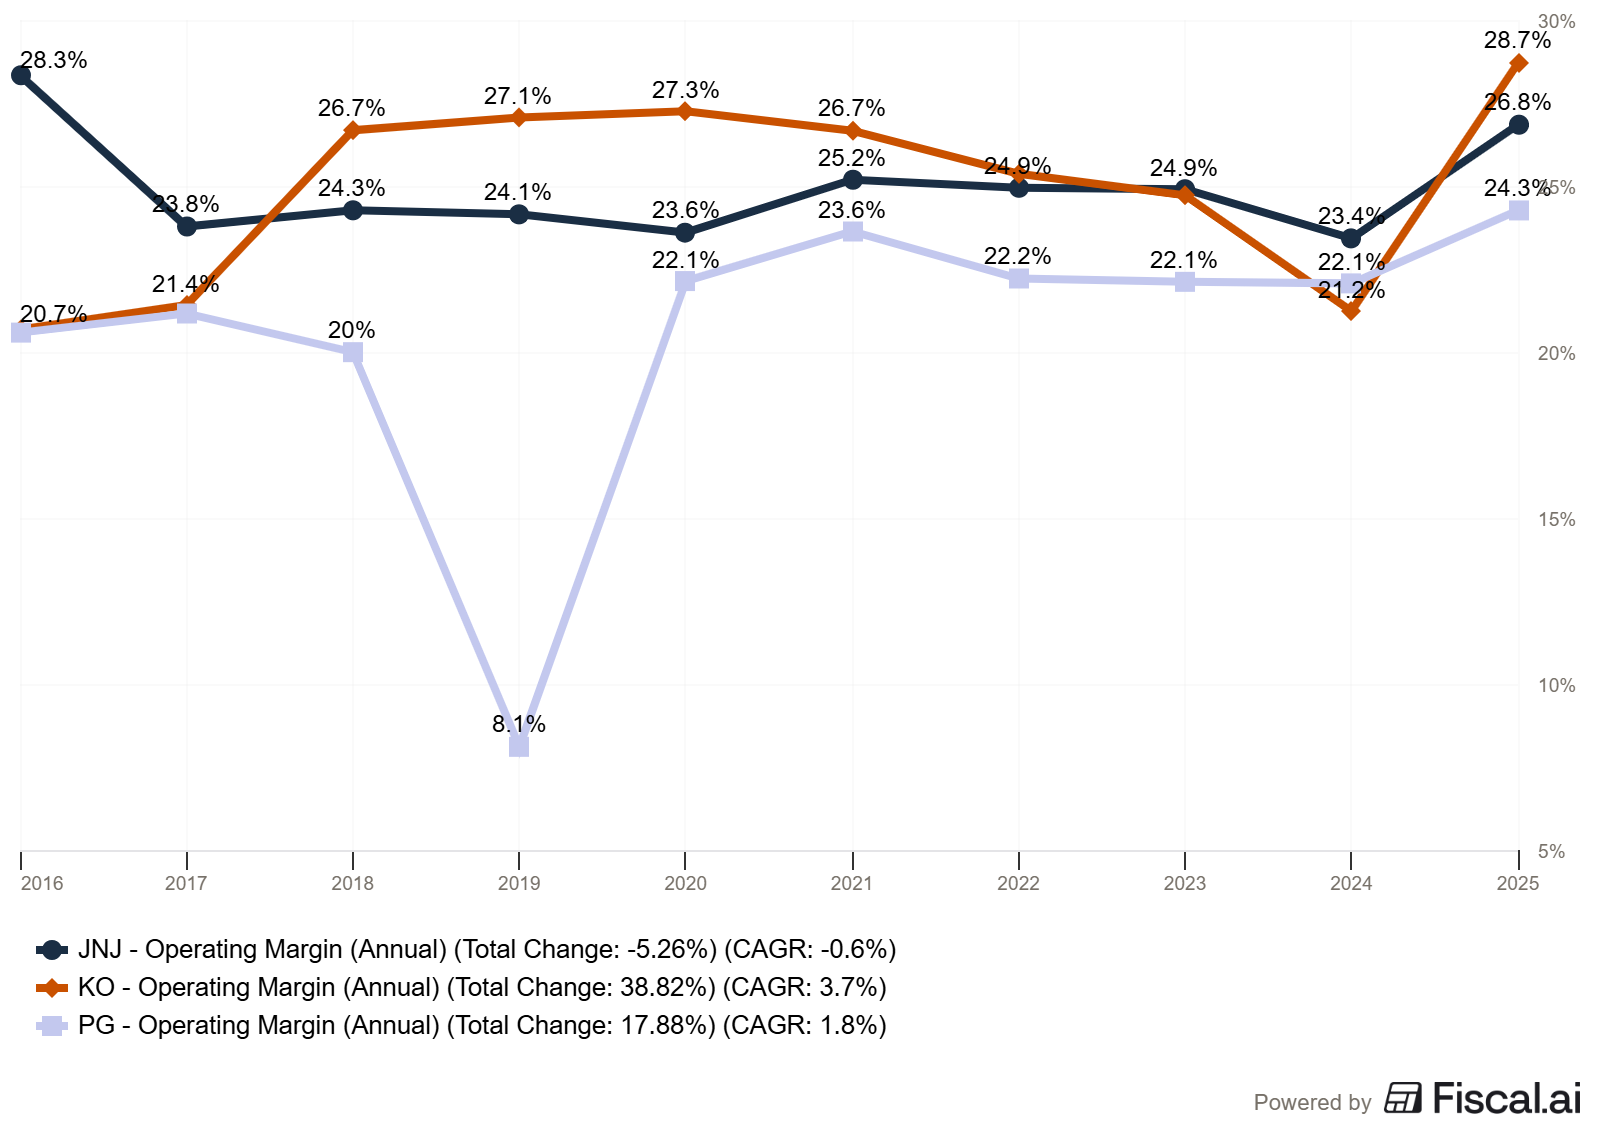
Profitability and Margins
This is where the three companies start to look quite different. Coca-Cola’s asset-light business model produces significantly higher margins than its peers.
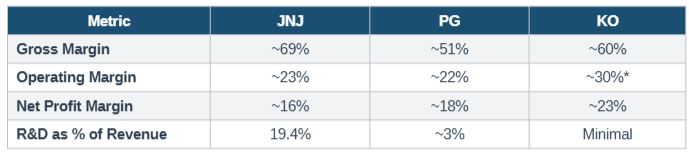
*KO comparable operating margin (non-GAAP) of 30.0%. GAAP operating margin was 21.2% due to comparability-related items. Sources: SEC filings.
JNJ has the highest gross margin at roughly 69%, which makes sense for a pharmaceutical and medical device company. However, its heavy R&D spending (19.4% of revenue) pulls the operating margin down to around 23%. This is the trade-off with pharma: you earn fat gross margins, but you must continually invest billions to keep the pipeline full.
Coca-Cola’s comparable operating margin of 30% is the best in this group. The concentrate model is brilliantly simple. KO manufactures syrup and sells it to bottlers who handle the capital-intensive work of production, distribution, and refrigeration. This means KO captures high-margin revenue without carrying the heavy fixed assets on its balance sheet.
Procter & Gamble sits in the middle. Its ~51% gross margin reflects the reality of manufacturing physical products (detergent, diapers, razors) at scale. The company has been driving margin improvement through productivity savings and pricing power, squeezing 140 basis points of core gross margin expansion in fiscal 2024.
The takeaway for dividend investors: higher margins mean more cash flow available to fund dividends. KO’s asset-light model gives it the most breathing room. JNJ’s margins are strong but require constant reinvestment. PG’s margins are steady but face pressure from input costs and marketing spend.
Seeing the margin differences is one thing. Knowing whether a 46% payout ratio is actually safe or a 73% ratio is actually dangerous takes more context. That is exactly what the Dividend Safety Spreadsheet handles for you. Plug in any ticker and get a scored breakdown in minutes.
The Dividend Track Record
Now we get to the part that income investors care about most. Let’s compare the dividend metrics that reveal whether these companies can sustain and grow their payouts.
Sources: SEC filings (dividend announcements), company earnings releases, and financial data services.
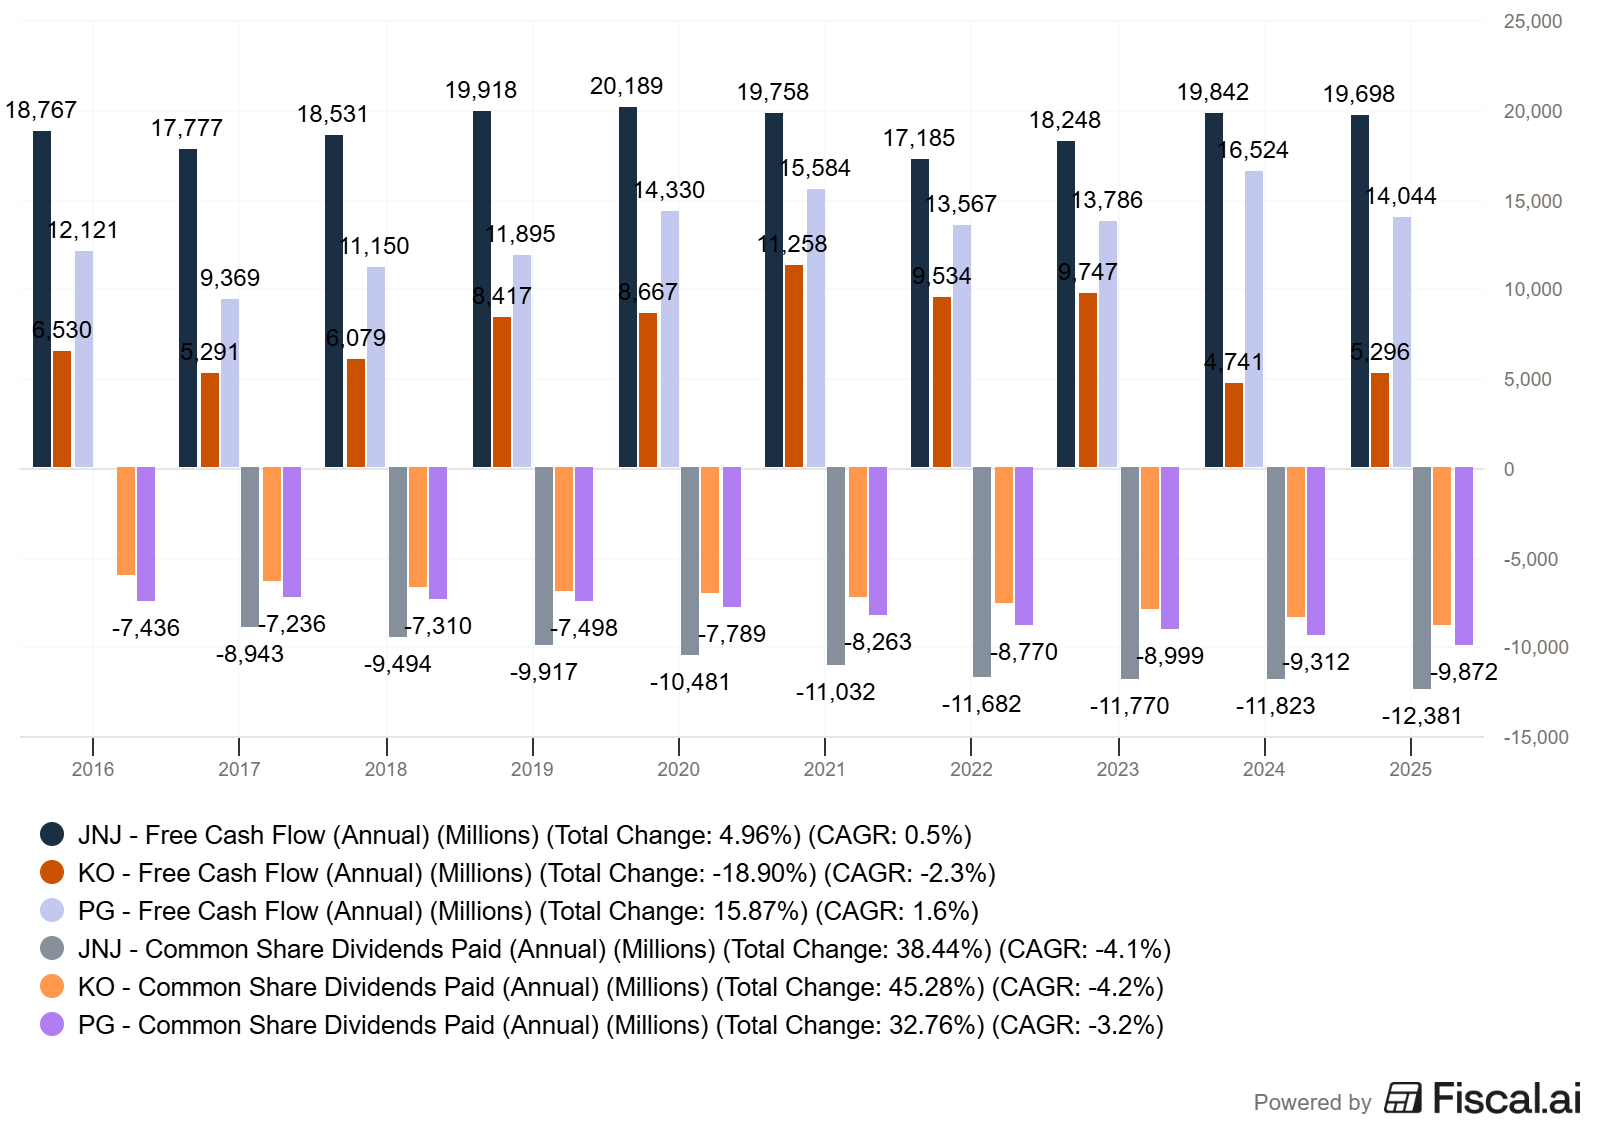
This table reveals important differences. JNJ has the lowest payout ratio at approximately 46%, meaning it distributes less than half its earnings as dividends. That is a substantial margin of safety. Even if earnings dropped significantly, JNJ could maintain and grow its dividend for years without stress. This is partly because JNJ’s post-Kenvue business (pharma and MedTech) generates strong free cash flow. The company produced roughly $20 billion in free cash flow during 2024 and returned $11.8 billion to shareholders through dividends.
PG sits in the middle with a ~61% payout ratio. This is healthy for a consumer staples company with predictable cash flows. The company returned over $14 billion to shareholders in fiscal 2024 through approximately $9 billion in dividends and $5 billion in share repurchases. PG’s 68+ consecutive years of increases (the longest active streak) is the gold standard.
KO has the highest payout ratio at roughly 73% of free cash flow. This is by design. Management has guided this ratio to remain near 75% over the long term. The company generated $10.8 billion in adjusted free cash flow (excluding a one-time $6.0 billion IRS tax litigation deposit) during 2024. Berkshire Hathaway, led by Warren Buffett, still holds 400 million shares, a testament to the dividend’s reliability.
Key insight: If dividend safety is your priority, JNJ’s 46% payout ratio gives you the most cushion. If current yield matters more, KO’s 2.7% edges out the group. If you want the longest proven track record, PG’s 68+ year streak is unmatched.
Balance Sheet Strength
A dividend is only as safe as the balance sheet backing it. Companies with excessive debt may be forced to cut dividends during downturns to service their obligations. Let’s compare how these three stack up.
Johnson & Johnson carries one of only two AAA credit ratings among U.S. corporations (the other being Microsoft). That is the highest possible rating, indicating virtually zero credit risk. At the end of 2024, JNJ held $25 billion in cash and marketable securities against approximately $37 billion in total debt. With $20 billion in annual free cash flow, JNJ could theoretically eliminate its entire net debt position in less than a year. That is fortress-level balance sheet strength.
Procter & Gamble maintains an AA- credit rating from S&P, which is still solidly investment grade. The company generated $19.8 billion in operating cash flow during fiscal 2024, giving it ample room to cover its dividend obligations and invest in the business. PG’s balance sheet is less remarkable than JNJ’s but entirely adequate for a consumer staples company.
Coca-Cola carries an A+ credit rating. The company’s 2024 cash flow from operations came in at $6.8 billion on a reported basis, but this number was depressed by a $6.0 billion deposit related to an IRS tax litigation matter. Adjusting for that one-time item, operating cash flow was approximately $12.8 billion, which is more representative of KO’s normal cash generation. The IRS dispute is worth monitoring, but KO’s business fundamentals remain sound.
The takeaway: JNJ’s AAA credit rating puts it in a class of its own. No other company in this comparison (or almost anywhere else) can match that level of financial strength. PG and KO are both strong, but JNJ is the clear winner on balance sheet quality.
Competitive Advantages: What Protects These Dividends?
Buffett teaches us that dividends ultimately flow from competitive advantages. A company without a moat will eventually see its profits erode, and the dividend will follow. Each of these companies possesses a different type of moat.
JNJ’s moat is patents and switching costs. Pharmaceutical products are protected by patents that grant temporary monopolies. Once a doctor prescribes a drug like Darzalex for multiple myeloma, switching to an alternative involves medical risk. MedTech products have similar stickiness because surgeons train on specific instruments. The risk is patent expiration. When key drugs lose exclusivity, revenue can decline sharply unless the pipeline replaces them. JNJ’s $17 billion R&D budget is the price of maintaining this moat.
PG’s moat is brand power and shelf space. Tide has been the number-one detergent brand for decades. Pampers dominates the diaper category globally. These brands occupy prime shelf space at retailers, which creates a self-reinforcing cycle: strong brands get better placement, which drives more sales, which funds more marketing, which strengthens the brand. Private-label competition is the primary threat, but PG has historically defended its position through product innovation and premium positioning.
KO’s moat is the global distribution network and brand. Coca-Cola is available in over 200 countries, with 2.2 billion servings consumed daily. That distribution infrastructure took over a century to build and would be nearly impossible to replicate. The brand itself is one of the most recognized on Earth. As Buffett has noted, Coca-Cola has pricing power because consumers are willing to pay more for the brand versus a generic alternative.
Red Flags and Risks to Monitor
No investment is without risk. Here are the specific concerns I would watch for each company.
For JNJ: the biggest risk is the pharmaceutical patent cliff. Key drugs like Stelara (which generated significant revenue) are losing patent protection. The pipeline must deliver replacement revenue through new approvals. Additionally, litigation risk (e.g., talc lawsuits) has been an ongoing overhang. The planned separation of the DePuy Synthes orthopedics business could also reshape the company’s profile.
For PG: volume pressure is the concern. Fiscal 2024 shipment volumes were flat, meaning all growth came from pricing. At some point, consumers push back on price increases, especially during periods of economic softness. Private-label brands have been gaining share in several categories. PG also faces a potential $400 million after-tax tariff headwind, which could pressure margins.
For KO: the IRS tax dispute is the elephant in the room. The $6.0 billion deposit made in 2024 relates to a transfer pricing case that could ultimately cost the company billions more. Currency headwinds are also a persistent challenge for KO, with management guiding for a 6% to 7% currency headwind on comparable EPS in 2025. Health-conscious consumer trends and potential sugar taxes represent longer-term structural risks, though the Zero Sugar line has been growing strongly (13% volume growth in Q4 2025).
How to Use This Framework in Your Investing Process
The comparison above is not just about these three stocks. It is a template you can apply to any dividend company. Here is the framework, distilled into five questions.
1. Is the business model durable? Ask whether the company sells products people need regardless of the economy. All three of our companies pass this test. Many high-yield stocks in sectors like energy or real estate do not.
2. Can the company afford the dividend? Check the payout ratio against both earnings and free cash flow. Below 60% is comfortable. Above 80% warrants closer scrutiny. JNJ’s 46% is excellent. KO’s 73% is manageable but leaves less room for error.
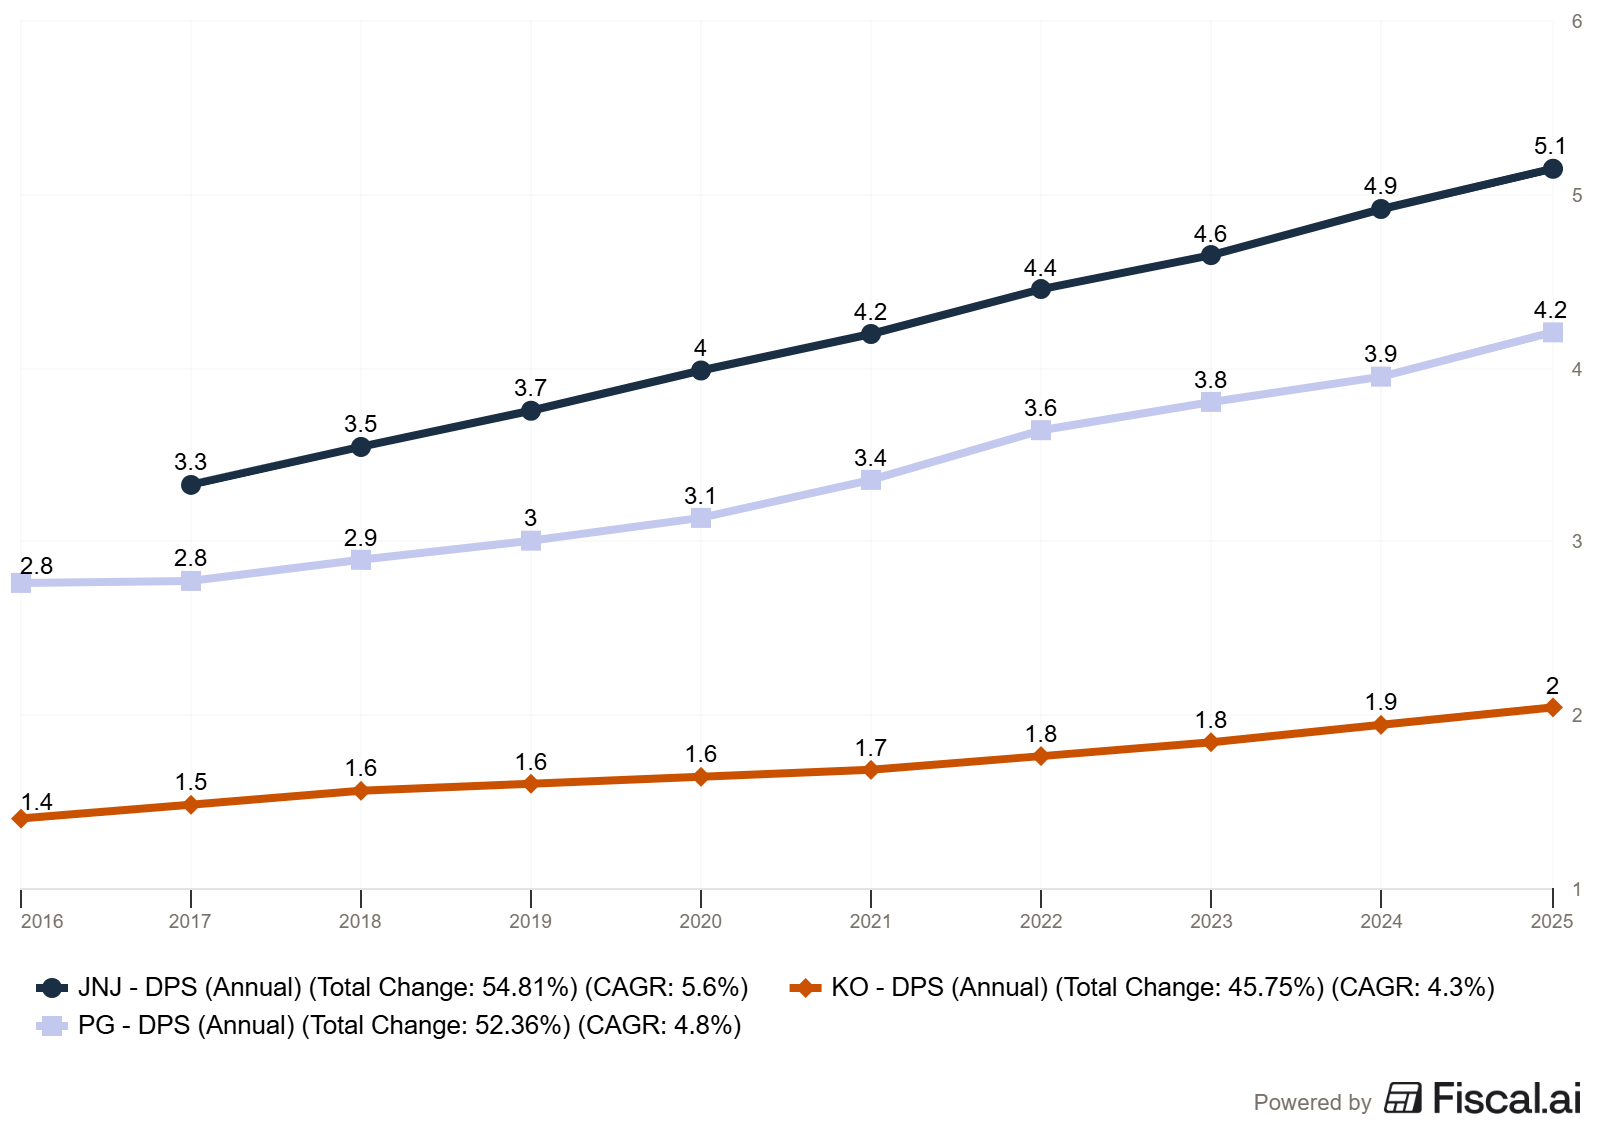
3. Is the dividend growing faster than inflation? A 5% annual dividend growth rate doubles your income roughly every 14 years. All three companies are growing dividends at approximately 4% to 5% annually, which keeps pace with or exceeds typical inflation.
4. How strong is the balance sheet? Look at credit ratings, net debt levels, and the debt-to-operating cash flow ratio. A company that can’t service its debt will eventually cut its dividend. JNJ’s AAA rating sets the standard.
5. What could break the streak? Identify the single biggest risk to the dividend and assess its probability. For JNJ, it is a patent expiration. For PG, it is volume declines. For KO, it is the IRS dispute. If you understand the risk, you can monitor it.
Common Mistakes When Comparing Dividend Kings
Before we wrap up, three pitfalls I see investors make repeatedly when evaluating these types of companies.
Chasing the highest yield. At current prices, KO yields approximately 2.7%, PG yields about 2.6%, and JNJ yields around 2.1%. The difference between 2.1% and 2.7% on a $10,000 investment is $60 per year. That is not enough to drive the decision. Total return (dividend income plus price appreciation) matters far more than yield alone.
Ignoring adjusted vs. GAAP earnings. JNJ’s GAAP EPS of $5.79 versus adjusted EPS of $9.98 is a 72% difference. Always understand what is being excluded and whether those exclusions are truly one-time items or recurring costs the company keeps “adjusting” away.
Treating all Dividend Kings as interchangeable. These three companies operate in completely different industries with different growth profiles, margin structures, and risk factors. A pharmaceutical company facing patent cliffs is nothing like a beverage company with a 130-year-old brand. Evaluate each on its own merits.
Investor Takeaway
All three companies are exceptional businesses with decades-long track records of rewarding shareholders. But they are not identical, and the right choice depends on what you prioritize.
If you want the strongest balance sheet and most room for dividend growth, Johnson & Johnson stands out. Its AAA credit rating, 46% payout ratio, and accelerating pharmaceutical pipeline make it the most financially resilient of the three. The risk is pipeline execution.
If you want the most proven track record of consistency and a business you never have to worry about, Procter & Gamble is your company. Its 68+ years of dividend increases are the longest of any major U.S. company. The risk is modest growth in a mature consumer staples market.
If you want the highest current yield, strong pricing power, and Buffett’s endorsement, Coca-Cola fits the bill. Its asset-light model generates impressive margins, and the brand is virtually indestructible. The risks are IRS litigation and currency headwinds.
The best approach for most dividend investors? Own all three. They operate in different industries, face different risks, and generate income in different ways. Together, they provide diversified exposure to some of the highest-quality businesses in the world.
That is going to wrap up our discussion for today.
As always, thank you for taking the time to read this post, and I hope you find something of value on your investing journey.
If I can further assist, please don’t hesitate to reach out.
Until next time, take care and be safe out there,
Dave
If this five-question framework changed how you evaluate dividend stocks, the spreadsheet turns it into a repeatable process. It is the same tool I use every time I compare Dividend Kings for the portfolio.
Excellent dissertation
For most investors and answers it “own all three”. A very good analysis! In fact, I do (maybe the reason I like your essay!).