

CME Group runs the exchanges where the world trades interest rate, stock index, oil, gold, and grain futures, and the clearing house that guarantees every one of those trades. It pays us twice: a regular quarterly dividend, and a once-a-year bonus sized to whatever cash is left over.
In today’s post, we will discuss:
The dividend most screeners miss
The bet
What CME Group does
How CME makes money
The moat and the competition
The financials
Is the dividend safe?
Where the growth comes from
Management and capital allocation
The risks
What CME is worth
The decision
Okay, let’s dive in and figure out what a company that pays out nearly everything it earns is worth to an income investor.
1. The dividend most screeners miss
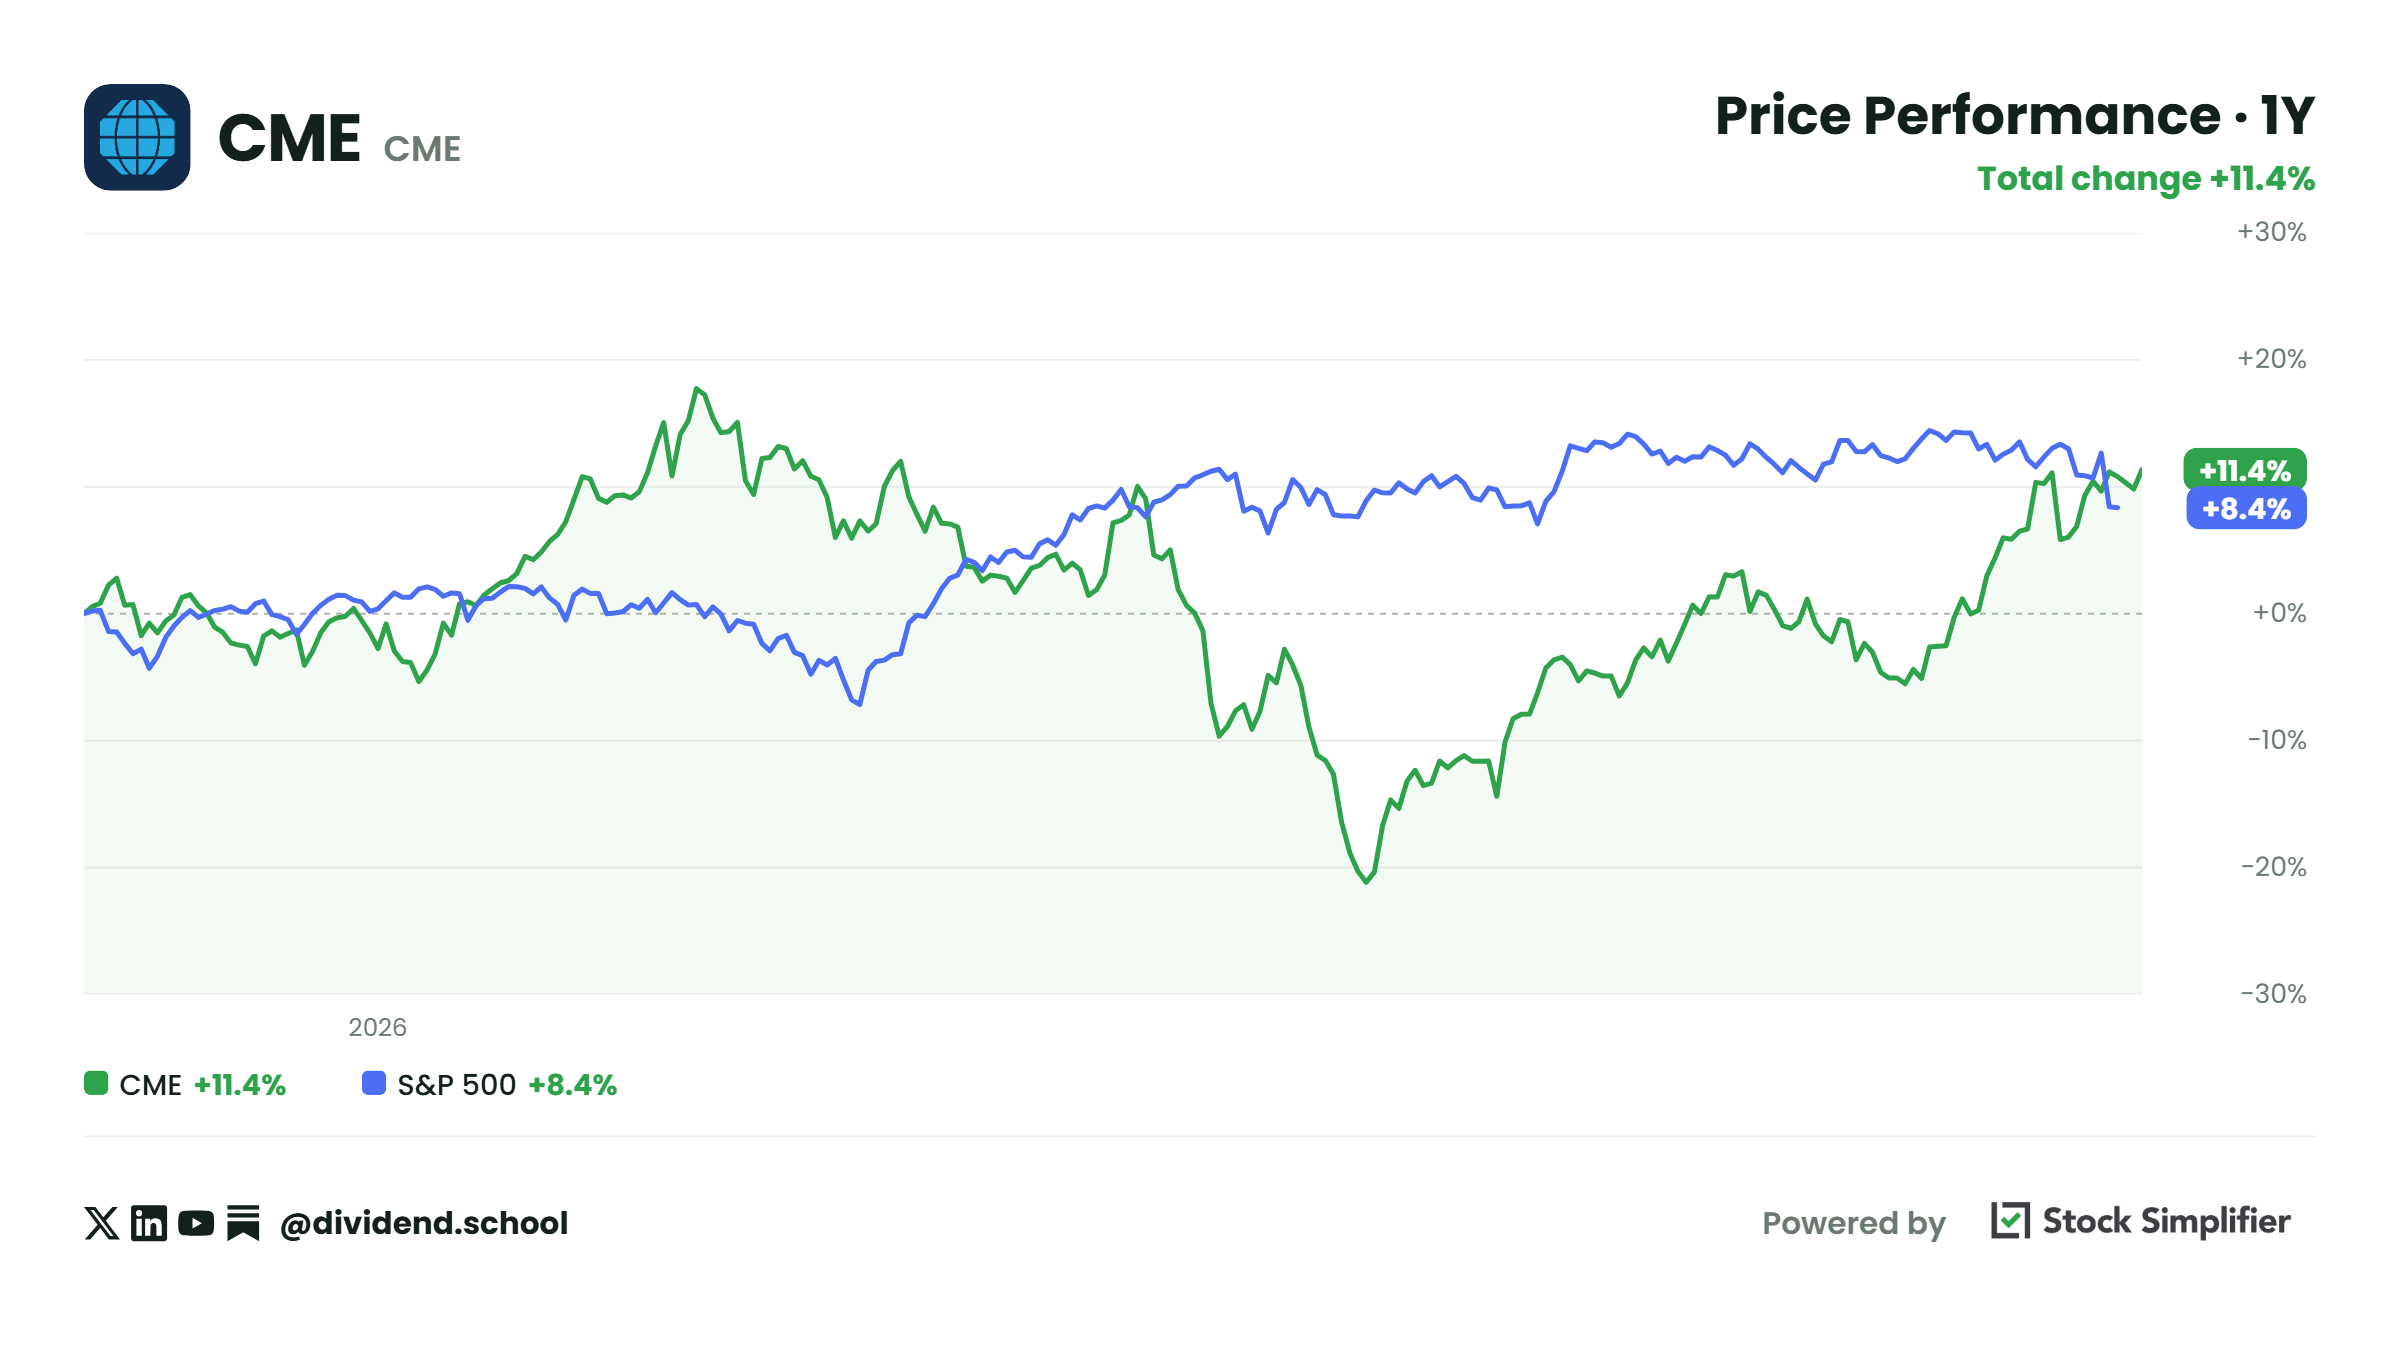
Pull up CME Group on Yahoo Finance or Morningstar, and we see a forward dividend yield of 1.70%.
That’s the regular dividend, $1.30 a quarter, $5.20 a year, against a $305.89 share price. For a company growing earnings at double digits, 1.70% is fine. It’s also not why anyone owns CME for income.
What the screeners leave out is a second dividend. On February 12, CME declared a $ 6.15-per-share dividend, paid on March 26 alongside the regular first-quarter check. It cost the company $2.2 billion. CME calls it the annual variable dividend, and it has paid one every year since 2012.
Add the two together:
Regular dividend: $5.20 a year
Variable dividend: $6.15, paid once
Total: $11.35 a share
Yield on the total: 3.71% ($11.35 / $305.89)
A 1.70% yield and a 3.71% yield are two different stocks. The screener reports what CME pays every quarter, and the variable is no promise. The amount changes every year based on how much cash CME has left over, and it has gone down before.
So which number should we use?
That depends on where the variable comes from, how reliable it is, and what we should pay for a stream of income that’s 46% steady and 54% bonus. One timing note for our calendars: for the last decade, the variable was declared in December and paid in January. This year CME moved it to February, with the first-quarter dividend, a week after it reported full-year results.
CME is also in both my personal portfolio and the Dividend Universe Portfolio.
If you already read a company’s dividend policy in the 10-K and check what it paid against what it earned, you don’t need this newsletter. If you’ve been meaning to and haven’t gotten around to it, that’s what we do here, one company a month, filings open, math shown.
2. The bet
CME Group owns the benchmark futures contracts for interest rates, the S&P 500, oil, gold, and corn, and it clears every trade made on them. It makes money on volume, keeps 65 cents of every revenue dollar as operating profit, and spends almost nothing to maintain the business.
Our bet is that trading volume keeps growing faster than the economy because the world keeps finding new risks to hedge, and CME keeps handing us nearly all the cash. We collect a regular dividend that grows 4% to 8% a year, plus a variable component that tracks earnings.
Is the bonus dependable enough to count on, and what is the whole package worth? That’s what the rest of the article works out.
3. What CME Group does
Think of CME as the toll road for risk.
A farmer in Iowa wants to lock in a price for corn he hasn’t harvested yet. An airline wants to know what it will pay for jet fuel next summer. A pension fund wants to protect a $10 billion bond portfolio in case the Fed raises rates. A bank wants to bet on the opposite. None of them want to shake hands directly, so they all use CME.
CME runs four exchanges, all brought under one roof through mergers:
CME, the Chicago Mercantile Exchange: stock-index futures, currencies, and interest rates
CBOT, the Chicago Board of Trade: Treasury futures, corn, soybeans, and wheat
NYMEX: crude oil and natural gas
COMEX: gold, silver, and copper
It also owns BrokerTec, where banks trade U.S. Treasuries and repo, and EBS, a currency trading platform, both from the 2018 NEX acquisition. And it owns 27% of S&P Dow Jones Indices, the company behind the S&P 500 and the Dow.
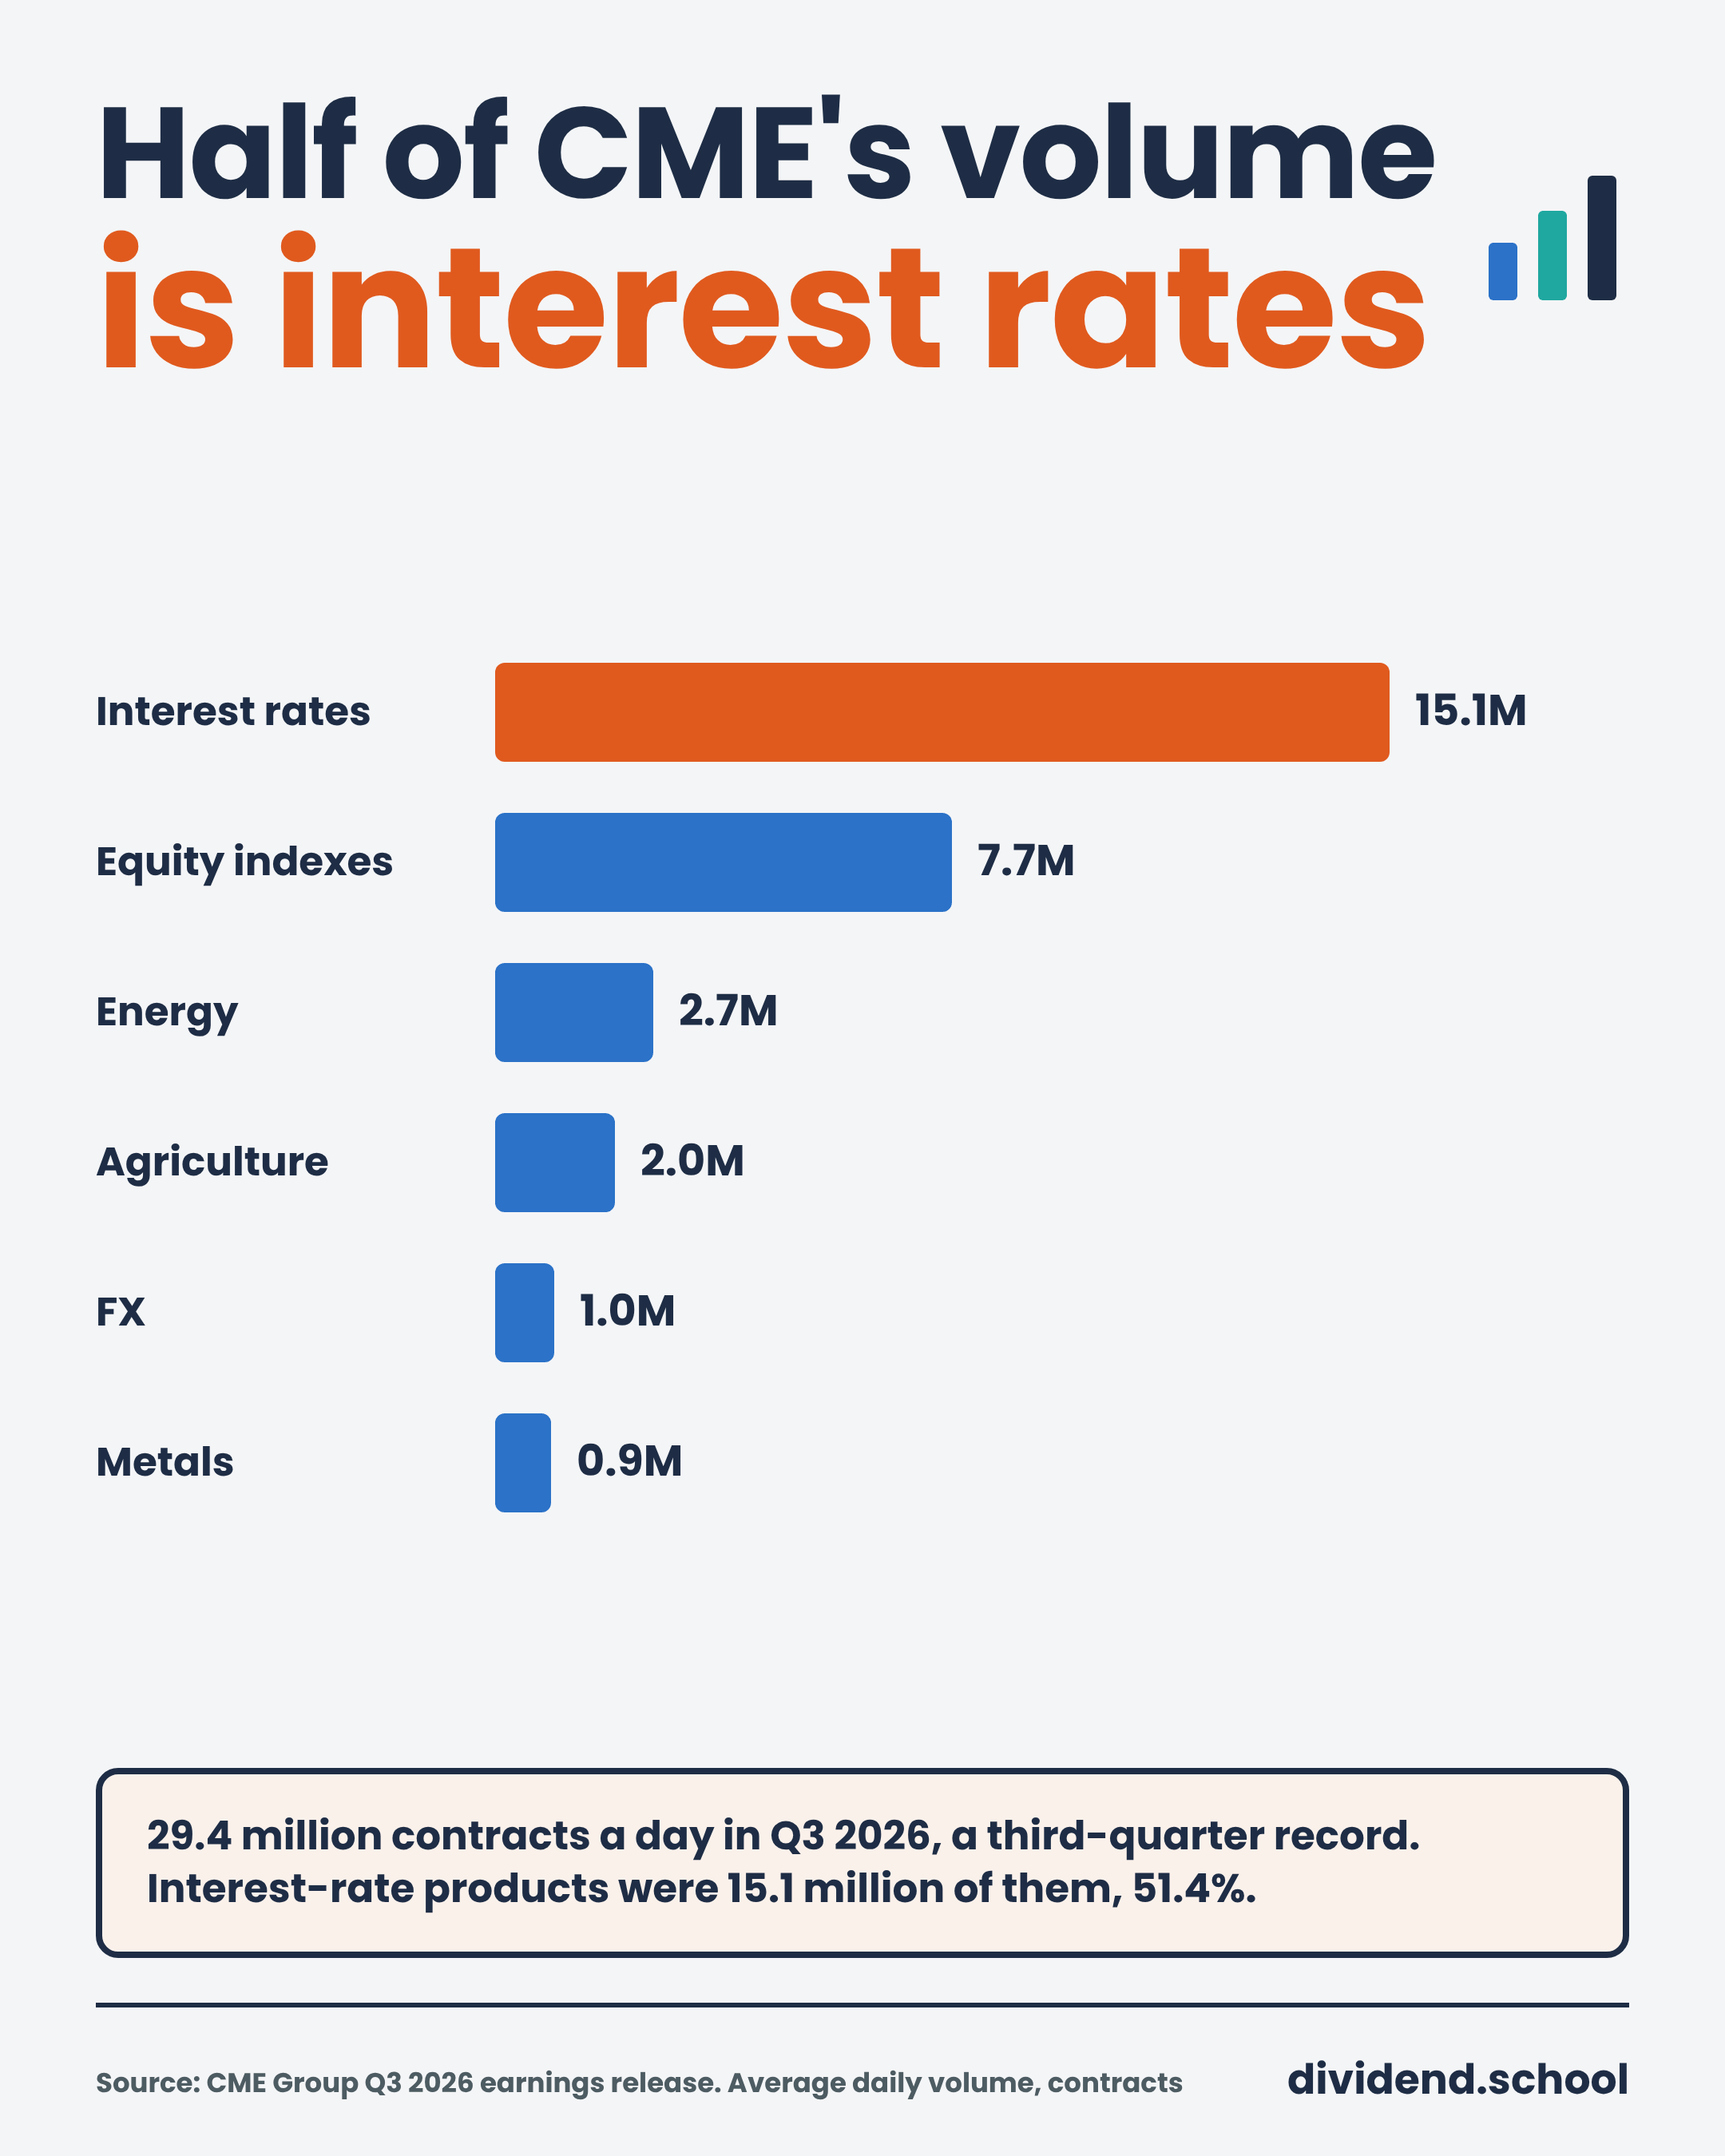
Interest rates are the biggest piece. Of 29.4 million contracts traded a day in the third quarter, 15.1 million were interest-rate products, 51.4% of the total. Every time the bond market gets nervous about the Fed, CME gets busier.
And here’s what the business looked like in the third quarter:
29.4 million contracts a day, the best third quarter in CME’s history
Volume up 16.3% from 25.3 million a day a year earlier
Double-digit volume growth in all six asset classes
9 million contracts a day from outside the U.S., another third-quarter record
Love the consistency. CME also set full-year records for volume, revenue, and adjusted earnings in 2025, its fourth record year in a row.
Exchanges and clearing houses 101: how CME gets paid on every contract
Before we can judge CME’s dividend, we need to understand how an exchange earns its money. It works differently from almost anything else we cover, and it explains why the dividend works the way it does.
First, what’s a futures contract? It’s an agreement to buy or sell something at a set price on a set date. The farmer agrees today to sell 5,000 bushels of corn in December at $4.50. If corn falls to $4.00, the contract pays him the difference and his harvest price is protected. If it rises to $5.00, he gives up the upside. He traded the chance of a windfall for certainty.
Most futures never end with anyone delivering corn or oil. Traders close them out before the date. What matters is the price change along the way.
Second, who guarantees the deal? If the farmer’s buyer goes bust, who pays? This is the job of the clearing house, and it’s the most important thing CME does.
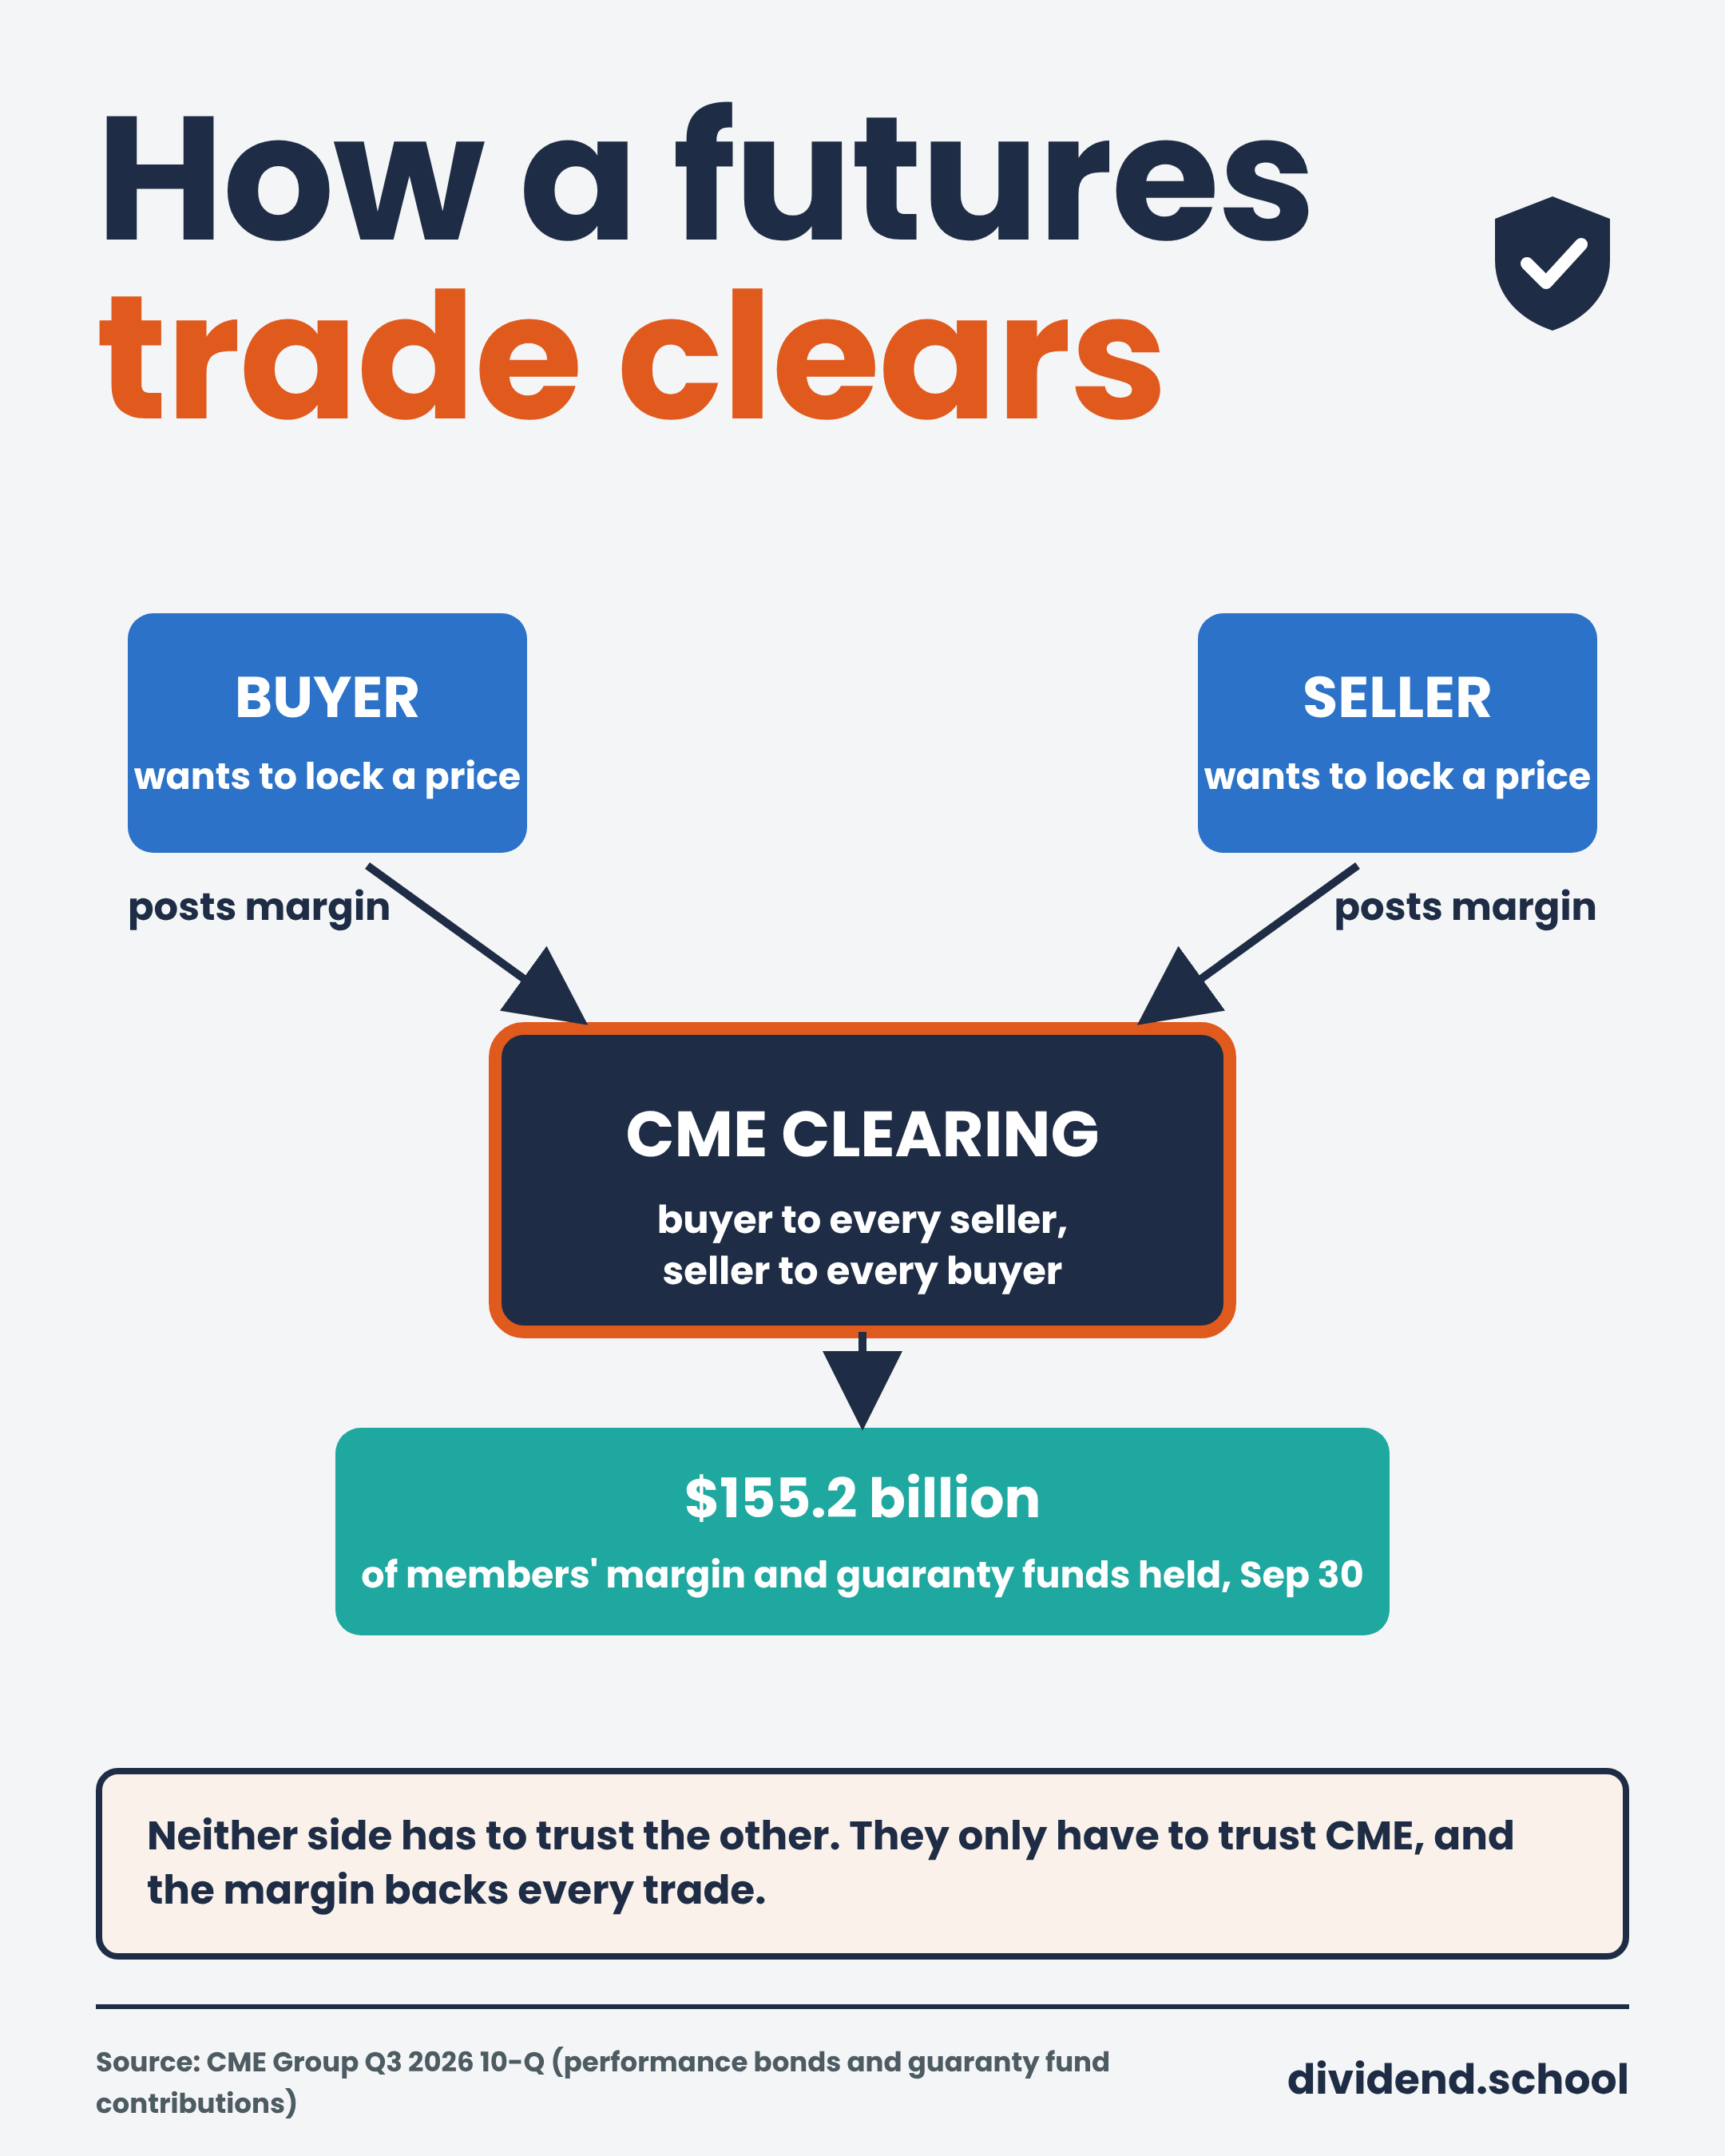
When a trade goes through CME, the clearing house steps in as the middleman. It becomes the buyer to every seller and the seller to every buyer. Neither side has to trust the other. They only have to trust CME.
To protect itself, the clearing house makes both sides post collateral, called a performance bond, or margin. If prices move against a trader, the clearing house collects more collateral every day. If a trader can’t pay, the clearing house uses that collateral first.
How much money is that?
As of September 30, CME held $155.2 billion of performance bonds and guaranty fund deposits from its clearing members. That money belongs to the traders and their brokers, not to CME. It sits on the balance sheet as both an asset and a liability, which is why CME reports total assets of $192.1 billion when the business itself is a fraction of that.
Third, how does CME get paid? For our purposes, three ways:
A fee on every contract. Traders pay CME a fee to trade and to clear each contract. The average fee is called the rate per contract (RPC in the filings)
Market data. Banks, hedge funds, and brokers pay for CME’s live prices, because CME sets the price for oil, Treasuries, and the S&P 500 futures everyone else watches.
Interest on the collateral. CME invests the cash collateral and keeps a slice of the interest. Most of it gets passed back to the clearing members.
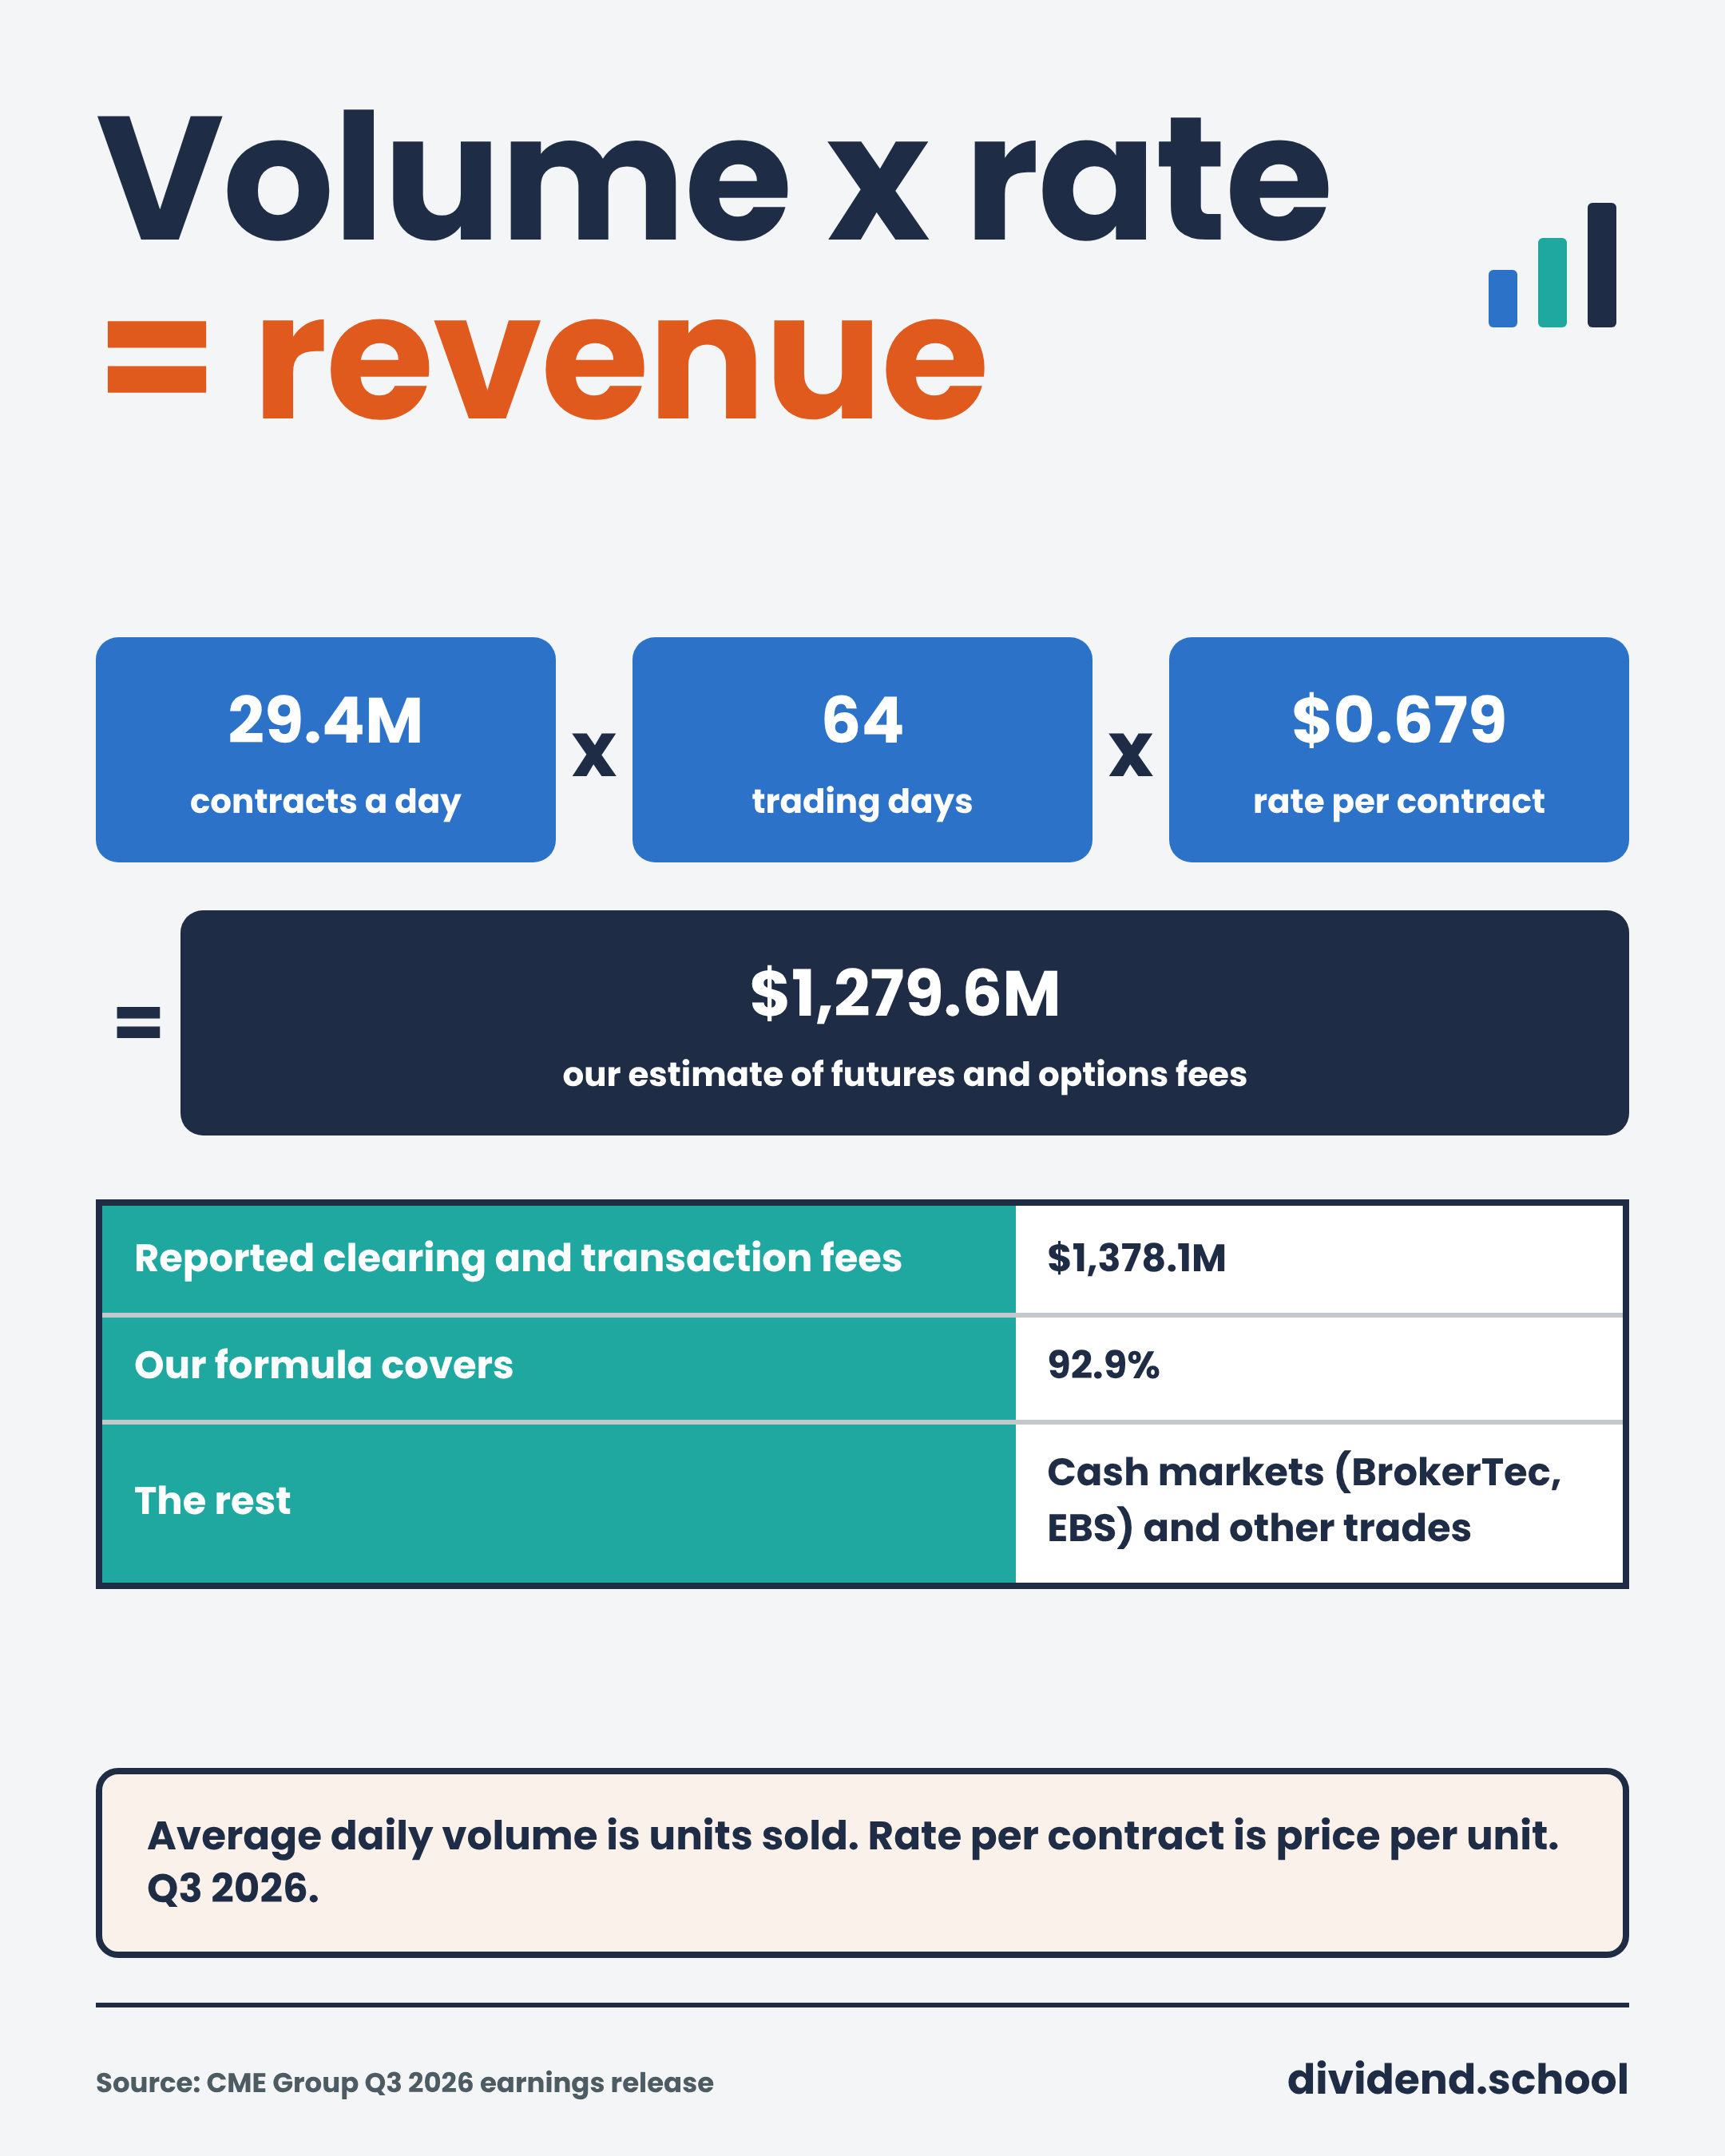
For those of us used to analyzing normal companies, here’s the bridge. Average daily volume is units sold. Rate per contract is price per unit. Multiply them by the trading days in the period, and we get most of the revenue line:
Fees = average daily volume x trading days x rate per contract
Let’s run it on the third quarter:
29.445 million contracts a day x 64 trading days = 1.88 billion contracts
1.88 billion contracts x $0.679 = $1,279.6 million
CME reported $1,378.1 million of clearing and transaction fees. Our $1,279.6 million is 92.9% of it ($1,279.6M / $1,378.1M). The rest is fees on trades outside futures and options, including the BrokerTec and EBS cash markets, which the volume and rate figures don’t count.
Fourth, why do traders keep coming back? Two words, and they’re the whole moat: liquidity and netting.
Liquidity means a big trader can buy or sell in size without moving the price. Traders go where the other traders are, and once a market settles on one exchange, it rarely moves.
Netting is subtler. If a hedge fund holds Treasury futures, SOFR futures, and S&P 500 futures at CME, the clearing house can offset the risks against each other and require less collateral overall. CME says it saved clients $100 billion a day in collateral this way in the third quarter, a new high. A trader who moves one product to a rival exchange loses that saving on the whole book.
So what does that tell us?
Once positions are open at CME, moving them costs real money. A rival has to beat CME on price by more than the collateral a trader gives up by leaving.
Three questions we ask about any exchange, CME included:
Is volume growing, and across how many products?
Is the rate per contract holding, or are they cutting price to keep volume?
Do the biggest contracts have a serious rival?
CME scores well on the first. The second is a watch item: the average rate fell to $0.679 from $0.702 a year earlier, and it fell inside equity, energy, and metals, not only from more of the cheaper interest-rate contracts. The third is where we’ll spend time in section 5.
4. How CME makes money
Here’s the third quarter by revenue line:
Clearing and transaction fees: $1,378.1 million, 79.3% of revenue
Market data: $243.1 million, 14.0%
Other: $116.1 million, 6.7%
Total revenue: $1,737.3 million
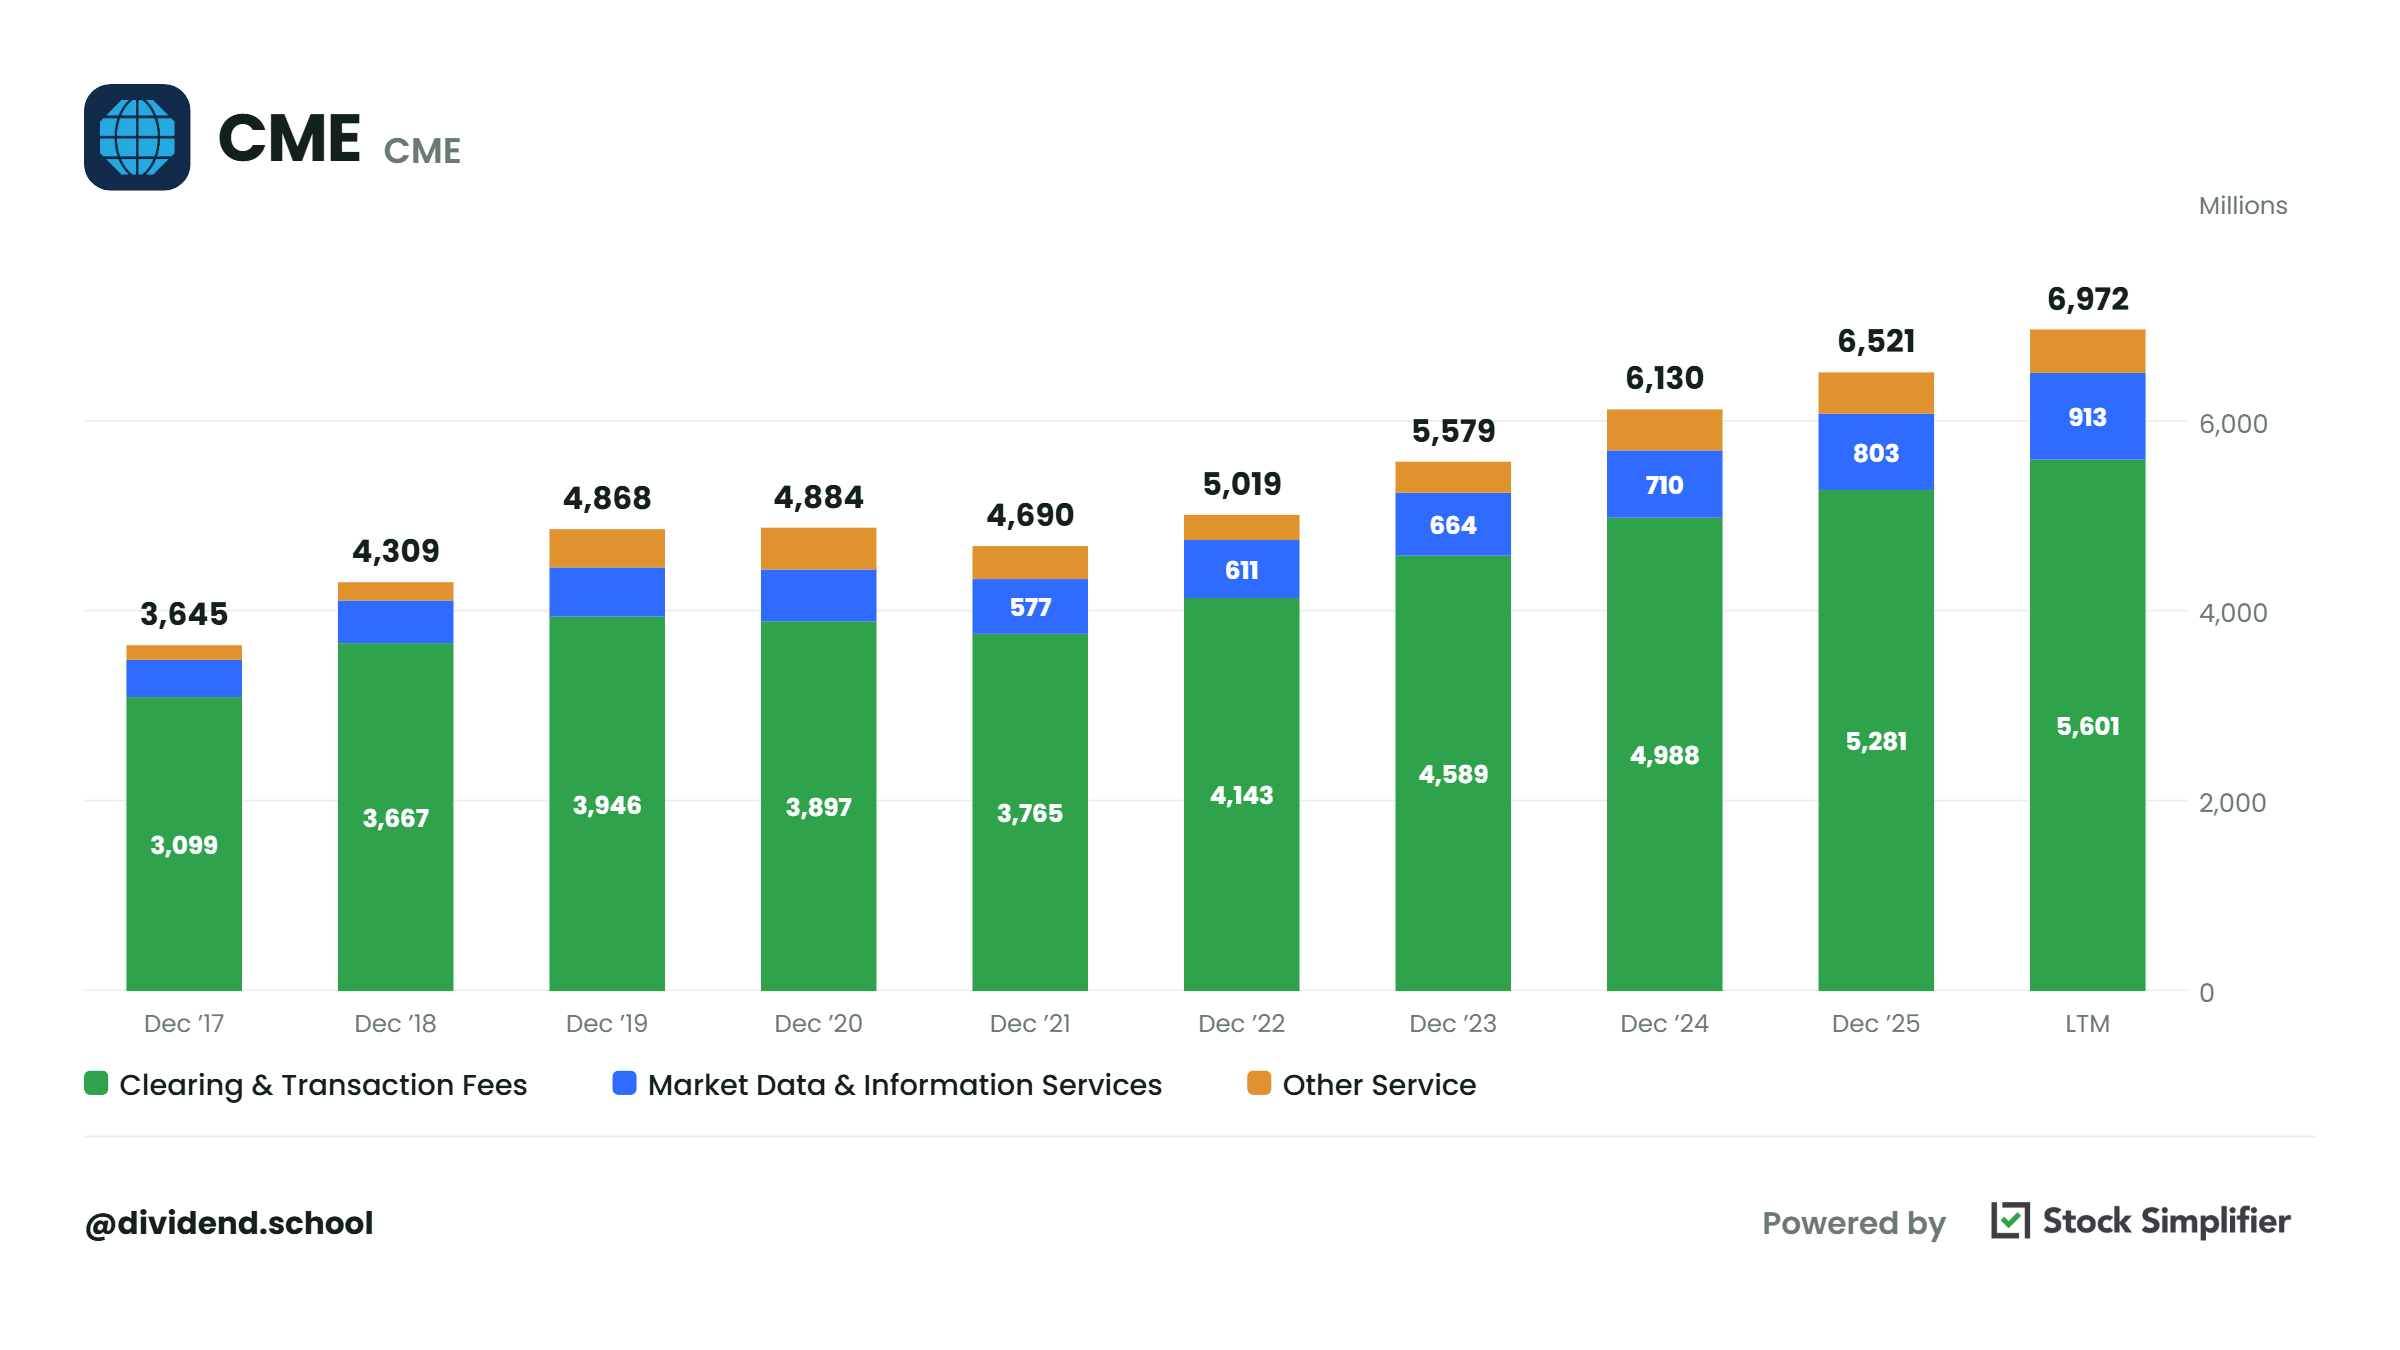
Four out of every five dollars we see come from trading. That’s both the strength and the weakness of the business. When markets are busy, CME is a cash machine. When markets go quiet, volume drops and revenue with it.
Market data is the steadier piece. It’s a subscription, and it grew 20.0% in the third quarter after a record $803 million in 2025, up 13%.
The good news for us is that costs barely move with volume. CME spent $595.9 million running the business in the third quarter, up 5.5% from a year earlier, while revenue rose 13.0%. Operating income rose 17.4%. That’s operating leverage: in a busy quarter, most of the extra revenue drops to the bottom line.
The money below the operating line
CME’s income statement has a second half most of us skip, and we shouldn’t here.
Two things live below operating income:
Interest on the collateral, after paying most of it back to clearing members
CME’s share of profit from the joint ventures, mainly the 27% of S&P Dow Jones Indices
In the first nine months of 2026, that added $635.2 million to pretax income, with $302.9 million from the joint ventures. When the Fed cuts rates, the interest piece shrinks. We come back to that in the risks.
Here are our headline results:
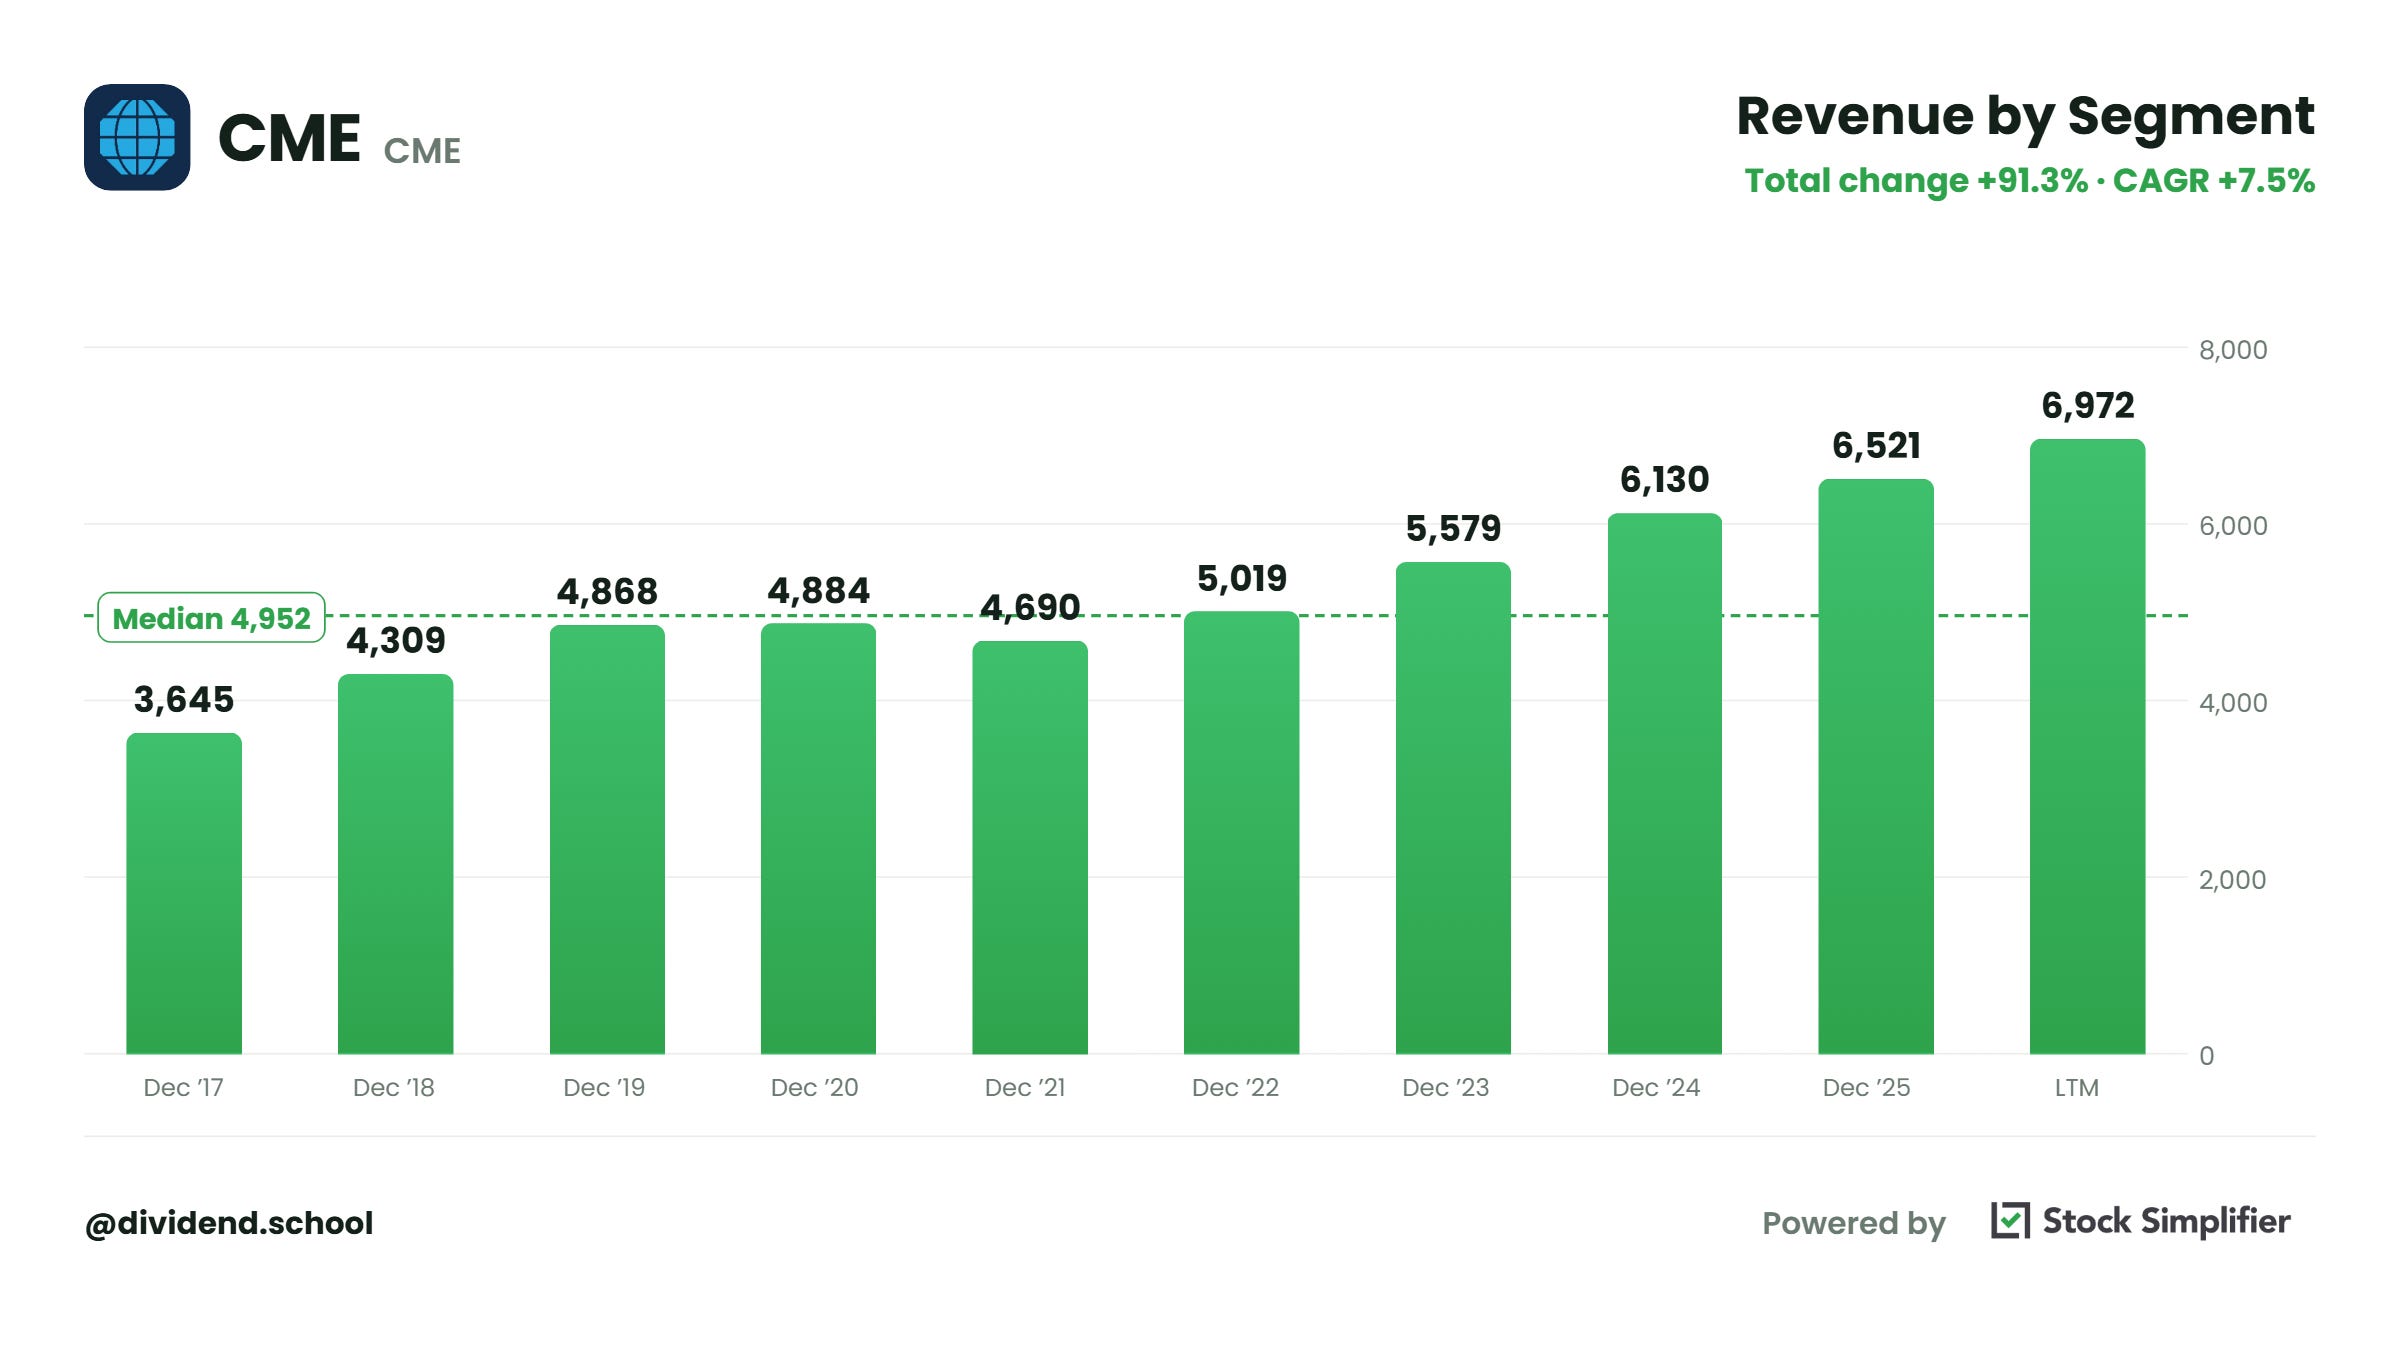
2025 revenue: $6,520.6 million, up 6.4% from $6,130.1 million
2025 adjusted EPS: $11.20, up 9.2% from $10.26
2025 GAAP EPS: $11.16, up 15.4% from $9.67
Q3 2026 revenue: $1,737.3 million, up 13.0% from $1,537.6 million
Q3 2026 adjusted EPS: $3.02, up 12.7% from $2.68
First nine months 2026 adjusted EPS: $9.38, up 11.3% from $8.43
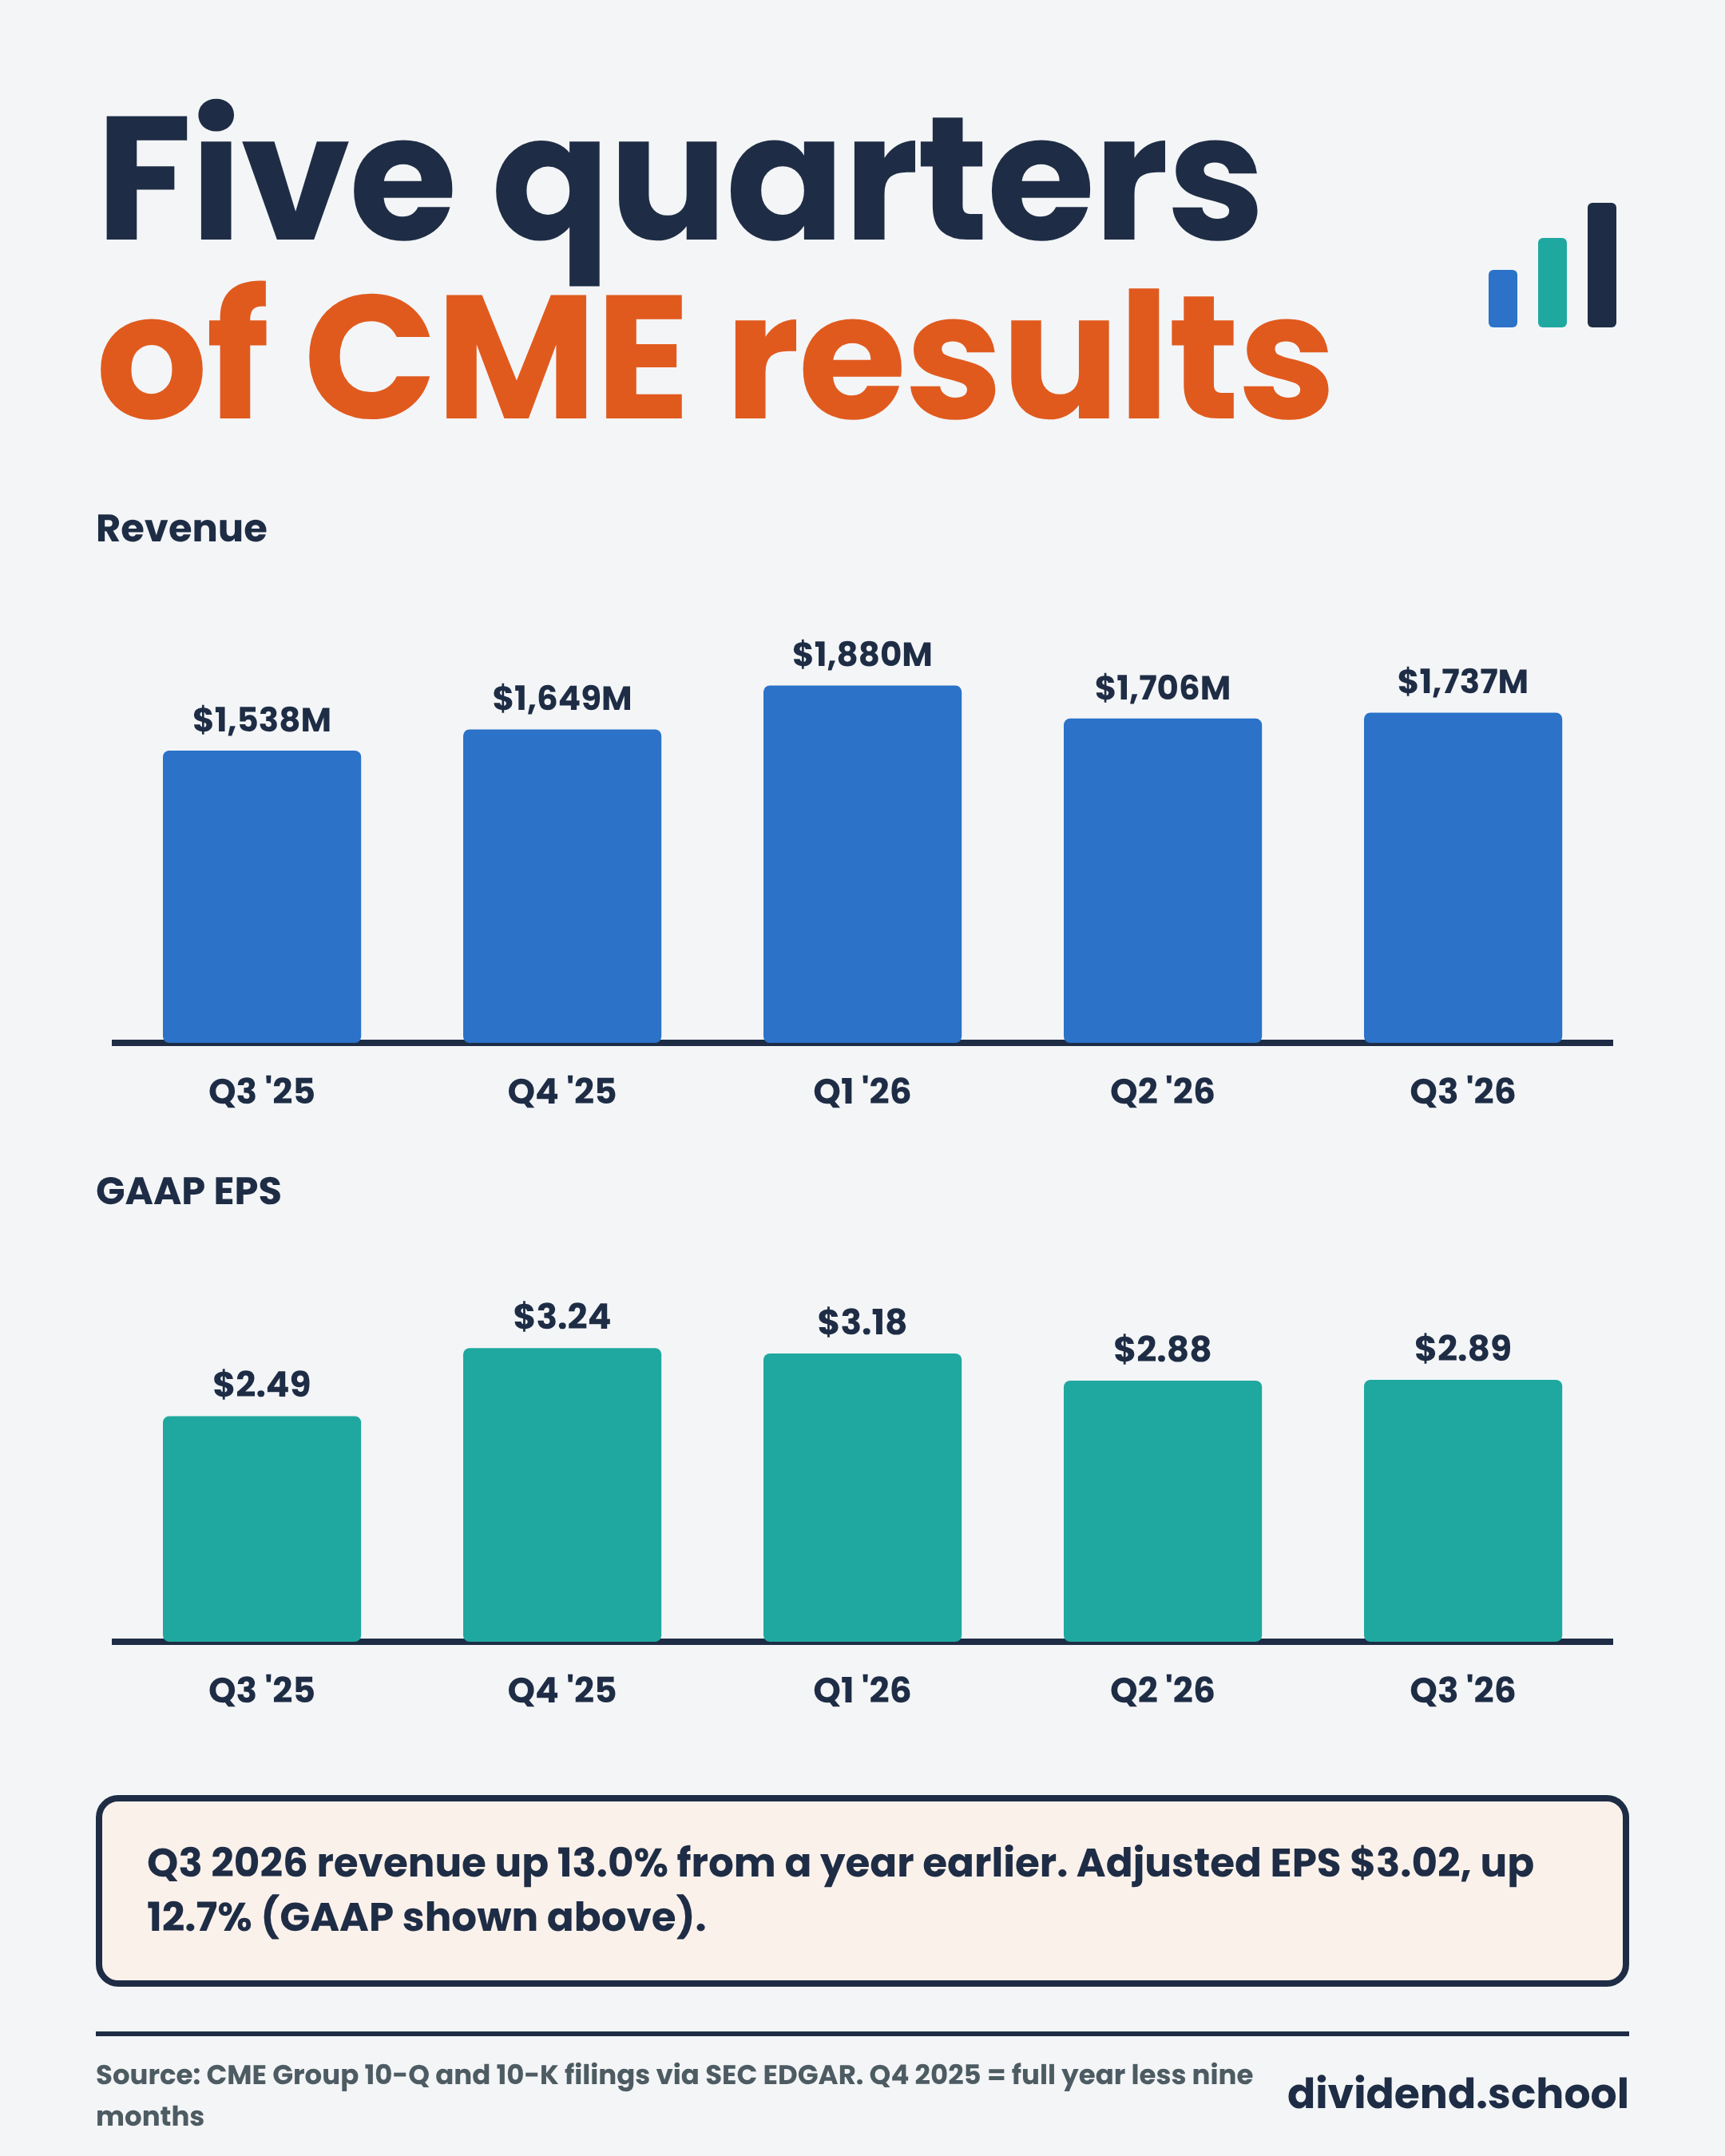
Why do GAAP and adjusted earnings differ?
Mostly the amortization of intangible assets from old acquisitions, NEX in particular, plus smaller one-time items like restructuring and legal costs. It’s an accounting charge, not cash leaving the building. The two lines sit close together this year: $8.96 GAAP and $9.38 adjusted for the first nine months.
On the third-quarter call, CFO Lynne Fitzpatrick said fourth-quarter volume was running 17% ahead of last year’s record fourth quarter. A strong finish to the year matters to us, because the variable dividend is sized on the full year.
5. The moat and the competition
What we get with CME is a network effect with switching costs layered on top. Each trader makes the market more valuable to the next one, and the collateral savings from netting make leaving expensive.
Add regulation to it. Running a clearing house takes CFTC registration, a guaranty fund, and a track record. CME’s clearing house came through the 2008 crisis and the 2011 collapse of MF Global, one of its own clearing firms. A newcomer doesn’t have that track record.
Who competes with CME?
ICE, the Intercontinental Exchange: Brent crude, European rates, and softs like sugar and coffee
Cboe: options on the S&P 500 and the VIX, under an exclusive license it just extended to 2051
Newer entrants: Coinbase Derivatives and Kalshi in crypto and event contracts, and Kalshi’s perpetual futures
Cboe’s S&P license covers options on the S&P 500 index, not futures, and CME owns 27% of S&P Dow Jones Indices, the licensor. So when Cboe’s S&P 500 options business grows, part of the royalty flows back to us.
Does the moat show up in the returns?
2025 operating margin: 64.9%
2025 return on equity: 14.8%
Capital spending: 1.3% of revenue
A 14.8% return on equity looks ordinary to us. It isn’t. CME’s equity is stuffed with $30.1 billion of goodwill and intangible assets from the CBOT, NYMEX, and NEX deals ($17.2B trading products + $2.4B other intangibles + $10.5B goodwill). Strip those out and tangible equity is negative $3.6 billion.
The business itself runs on almost no capital, and the 64.9% margin with 1.3% capex is the better read on the moat.
Mind-blowing economics, if you ask me.
6. The financials
Is this a high-quality business? We use four questions to answer that question.
Is it growing?
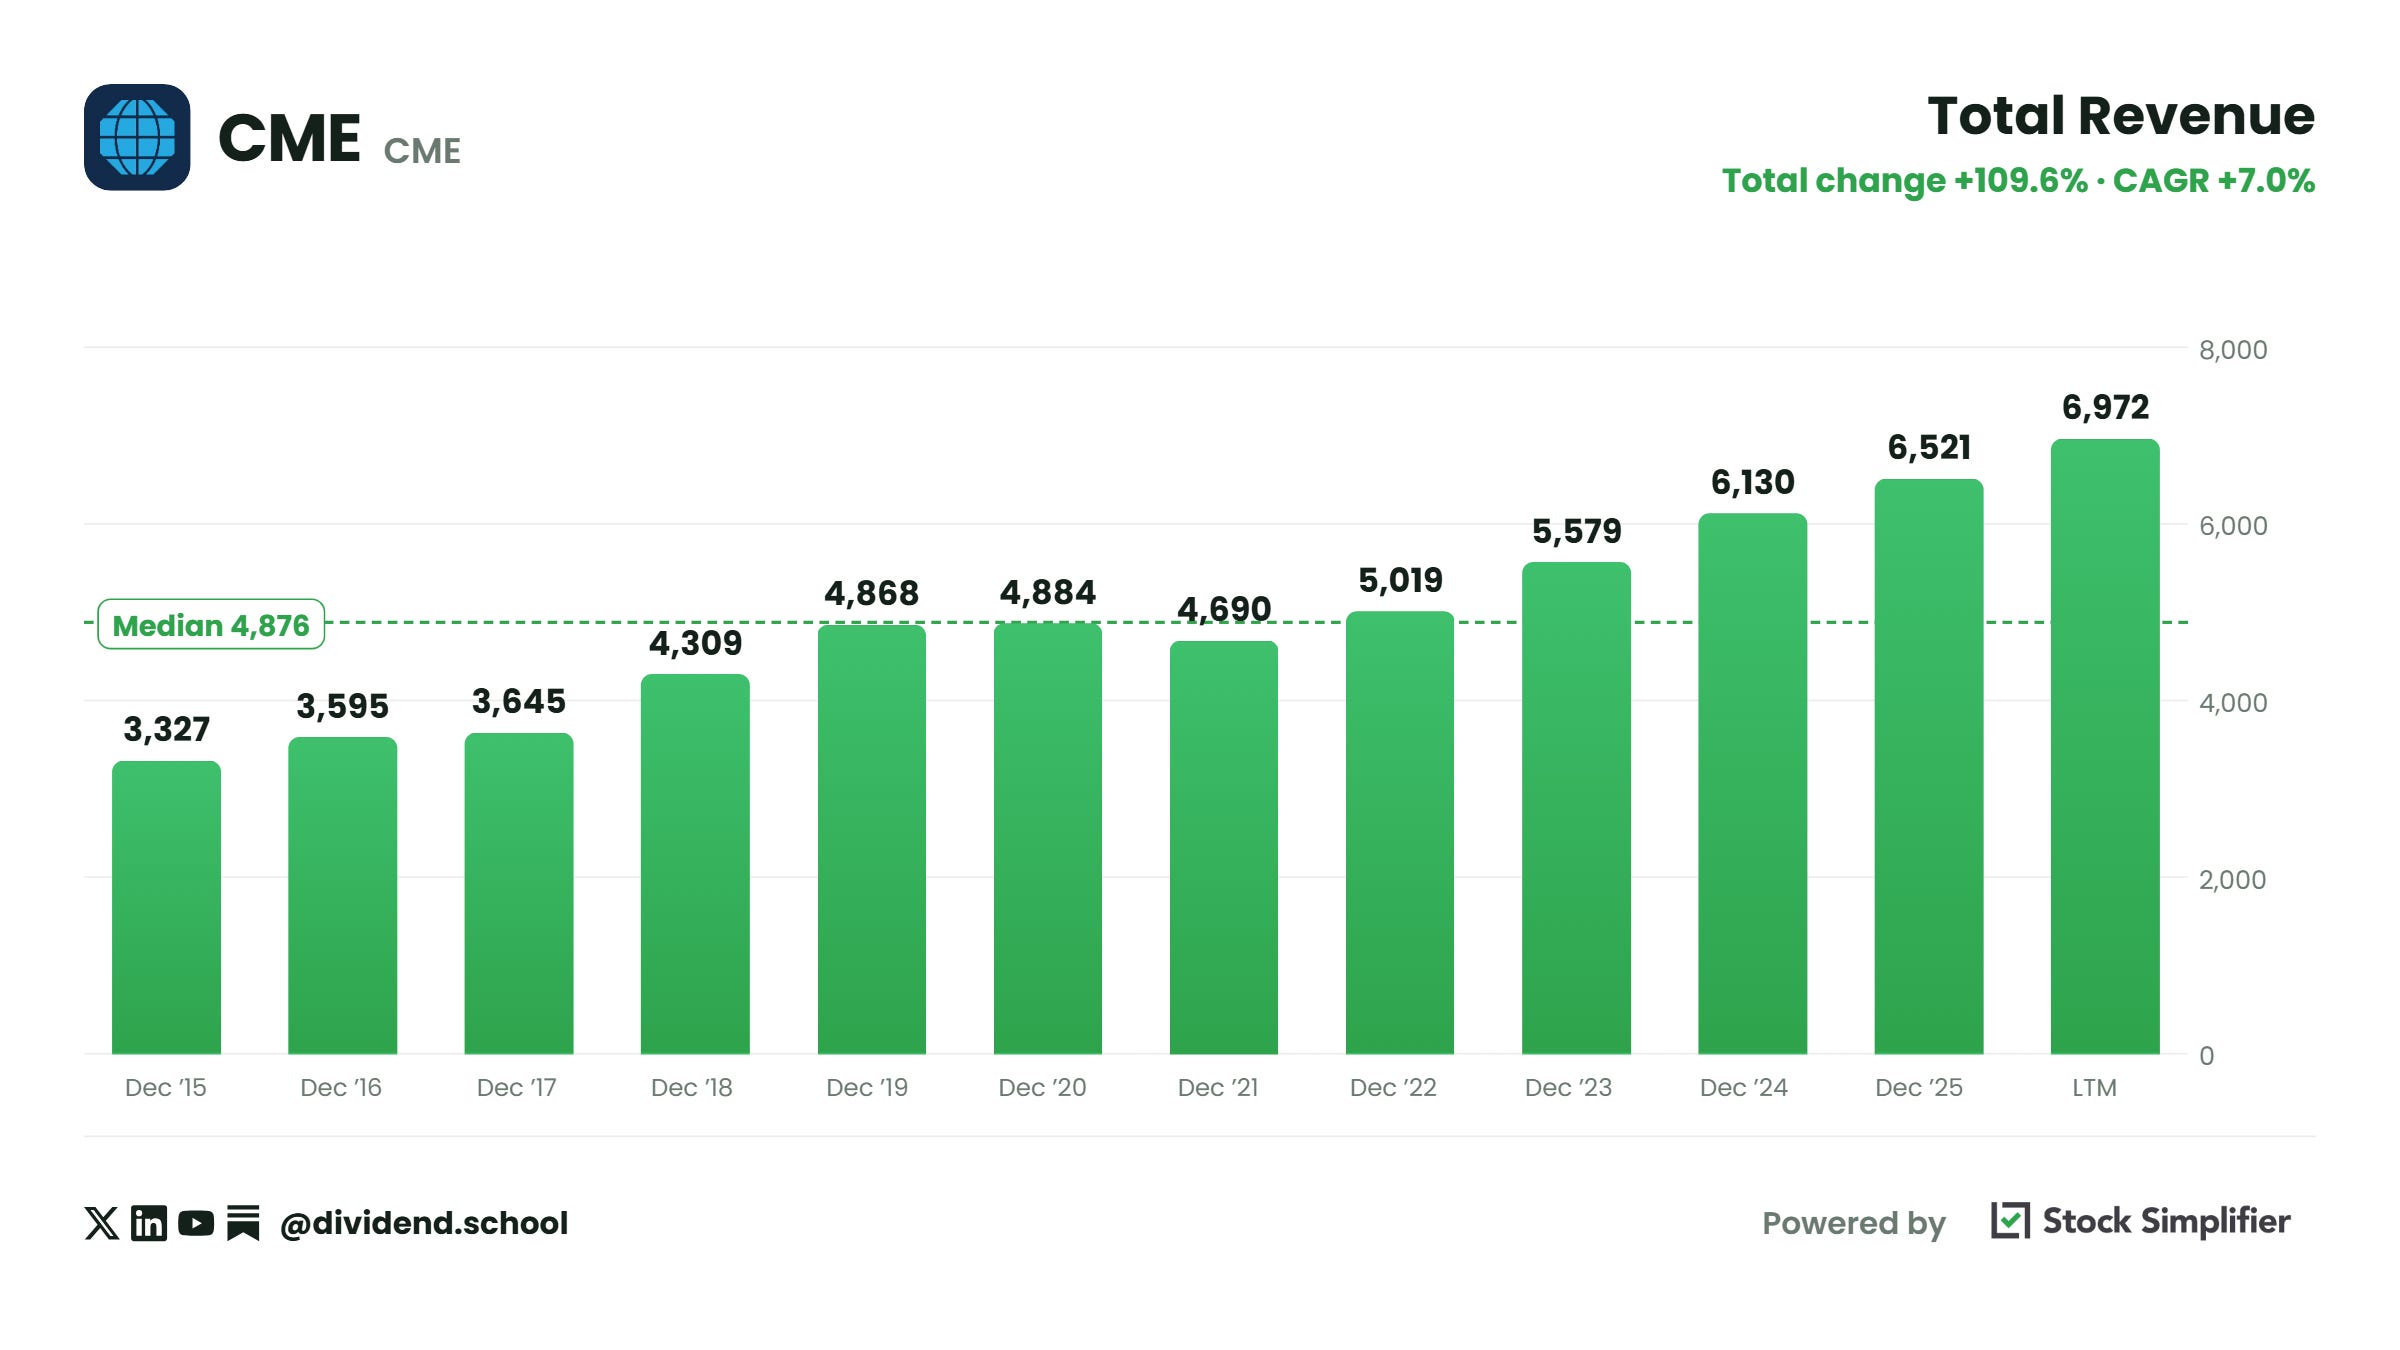
Revenue: $3,326.8 million in 2015, $6,520.6 million in 2025, 7.0% a year
GAAP EPS: $3.69 in 2015, $11.16 in 2025, 11.7% a year
2025 revenue up 6.4%, nine-month 2026 revenue up 9.3%
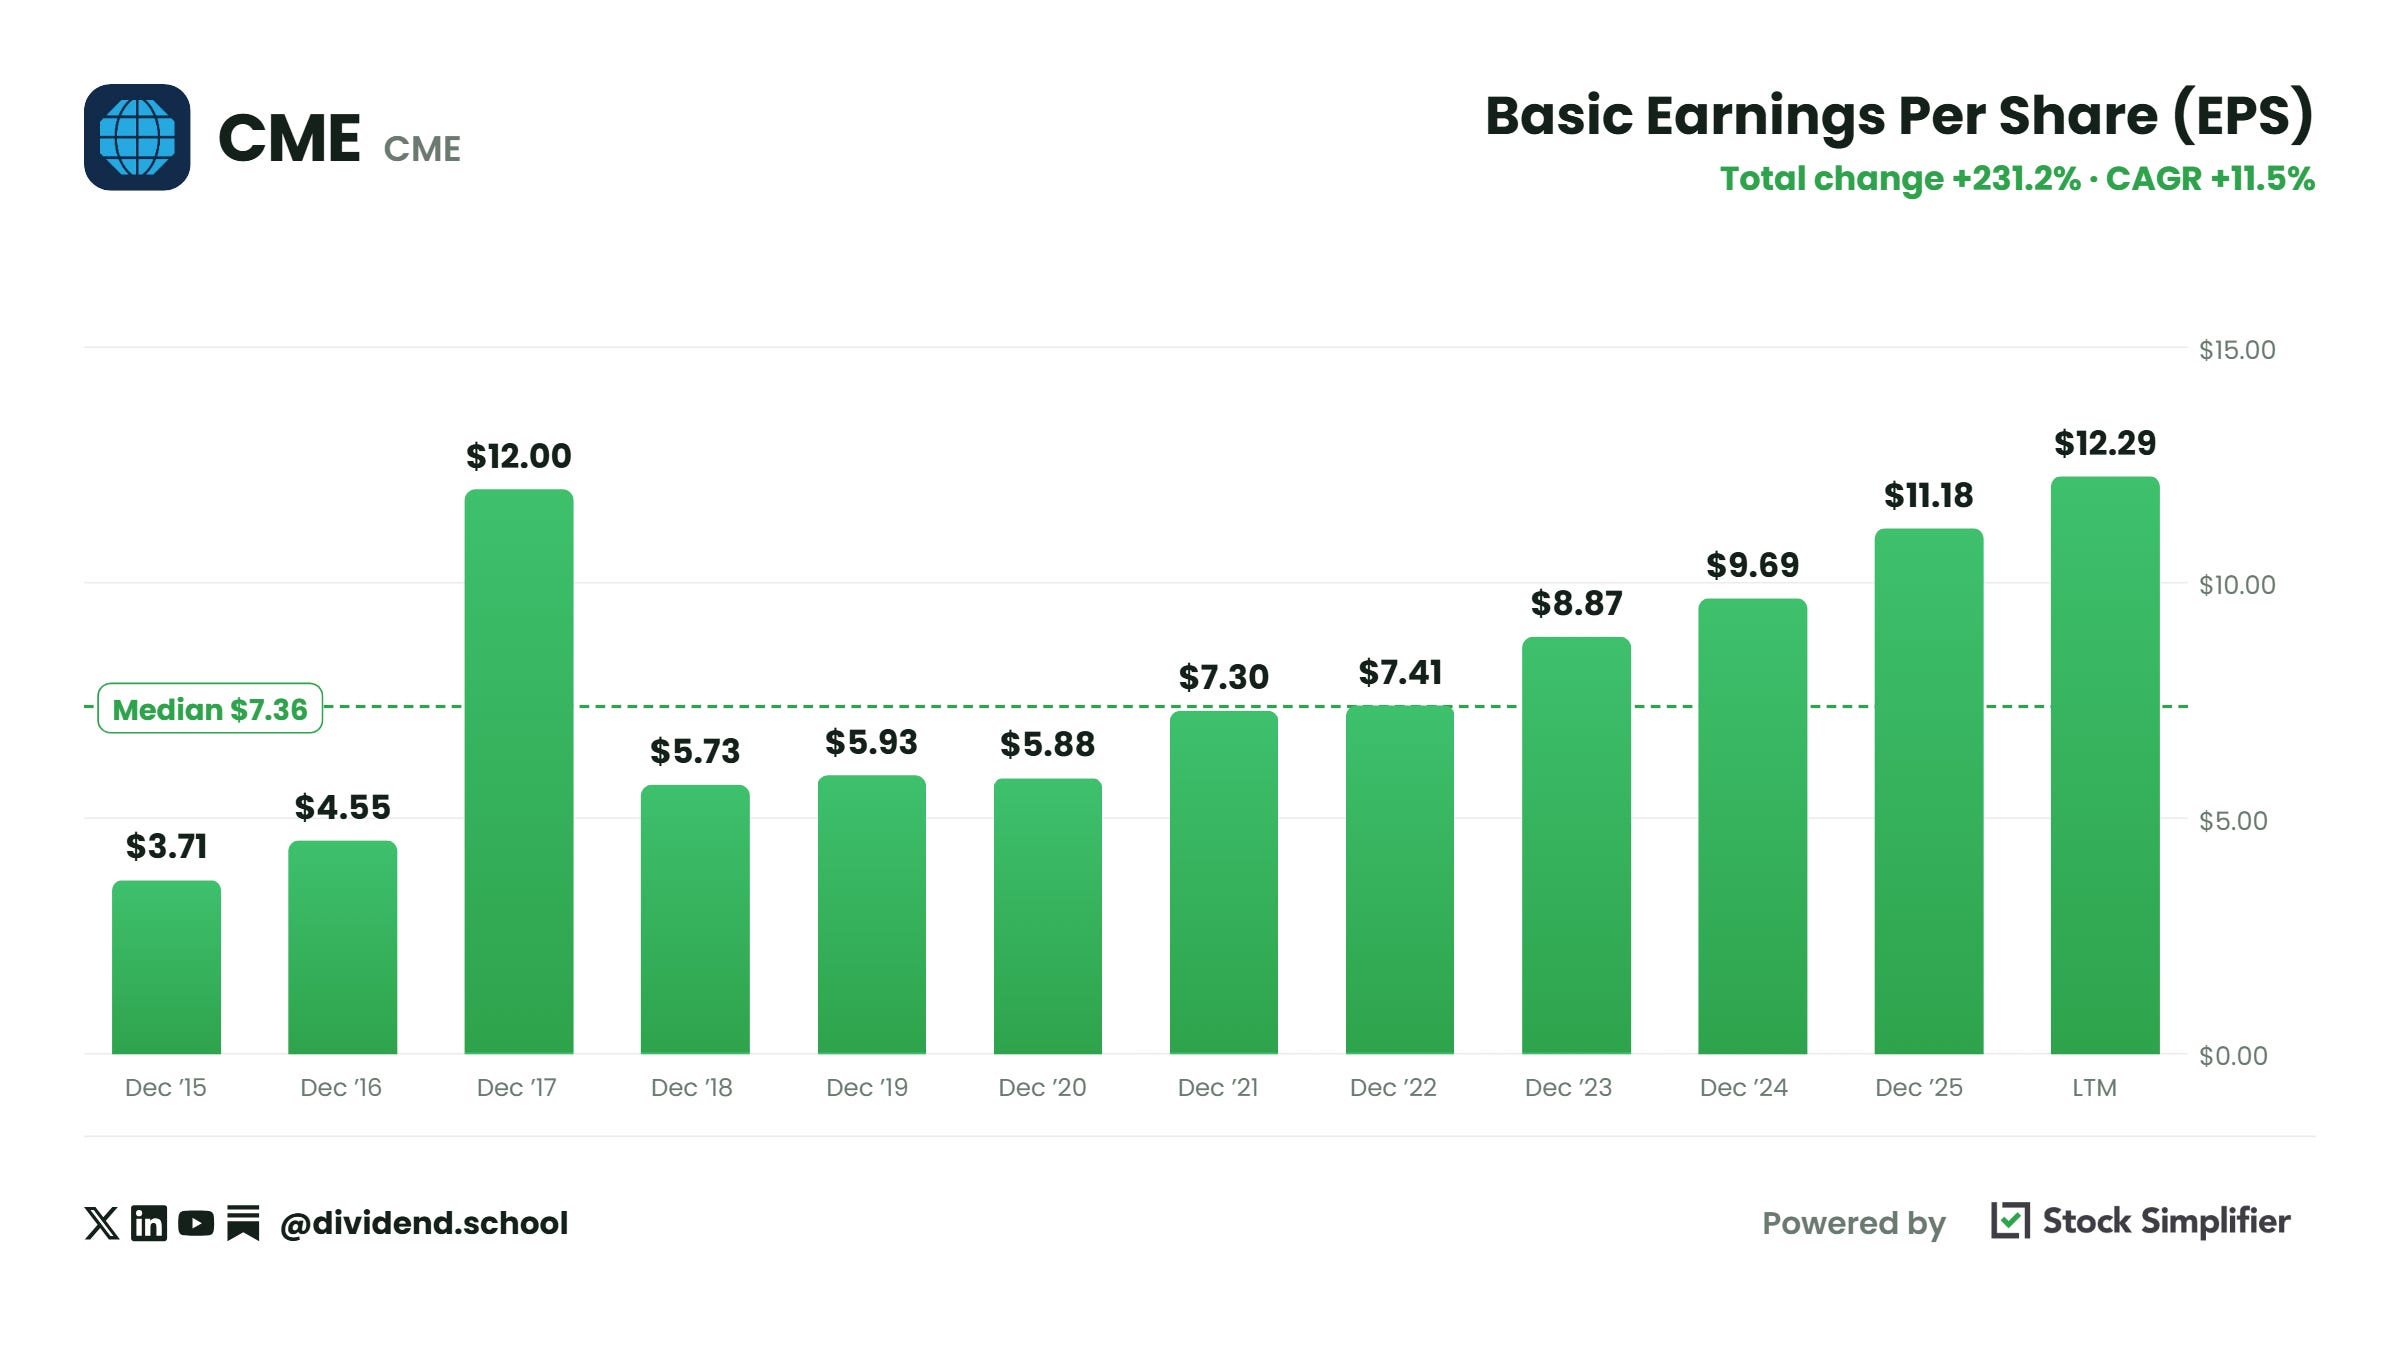
The 2017 bar shows $12.00 of EPS because the 2017 tax law cut CME’s deferred tax bill, a one-time accounting gain. Ignore that bar. The trend runs from $3.69 to $11.16.
Notice revenue grew 7.0% year over year and EPS 11.7%. Most of that gap came from below the operating line. Operating income grew 7.8% a year ($1,988.7M to $4,229.5M), close to revenue. The rest came from the 2017 tax cut and, since 2022, much higher interest on the collateral.
Does it generate cash?
Yes, and it keeps almost all of it:
2025 operating cash flow: $4,277.1 million
2025 capital spending: $83.5 million
2025 free cash flow: $4,193.6 million
Free cash flow per share: $11.64
Last 12 months to September: $4,333.1 million, or $12.08 a share
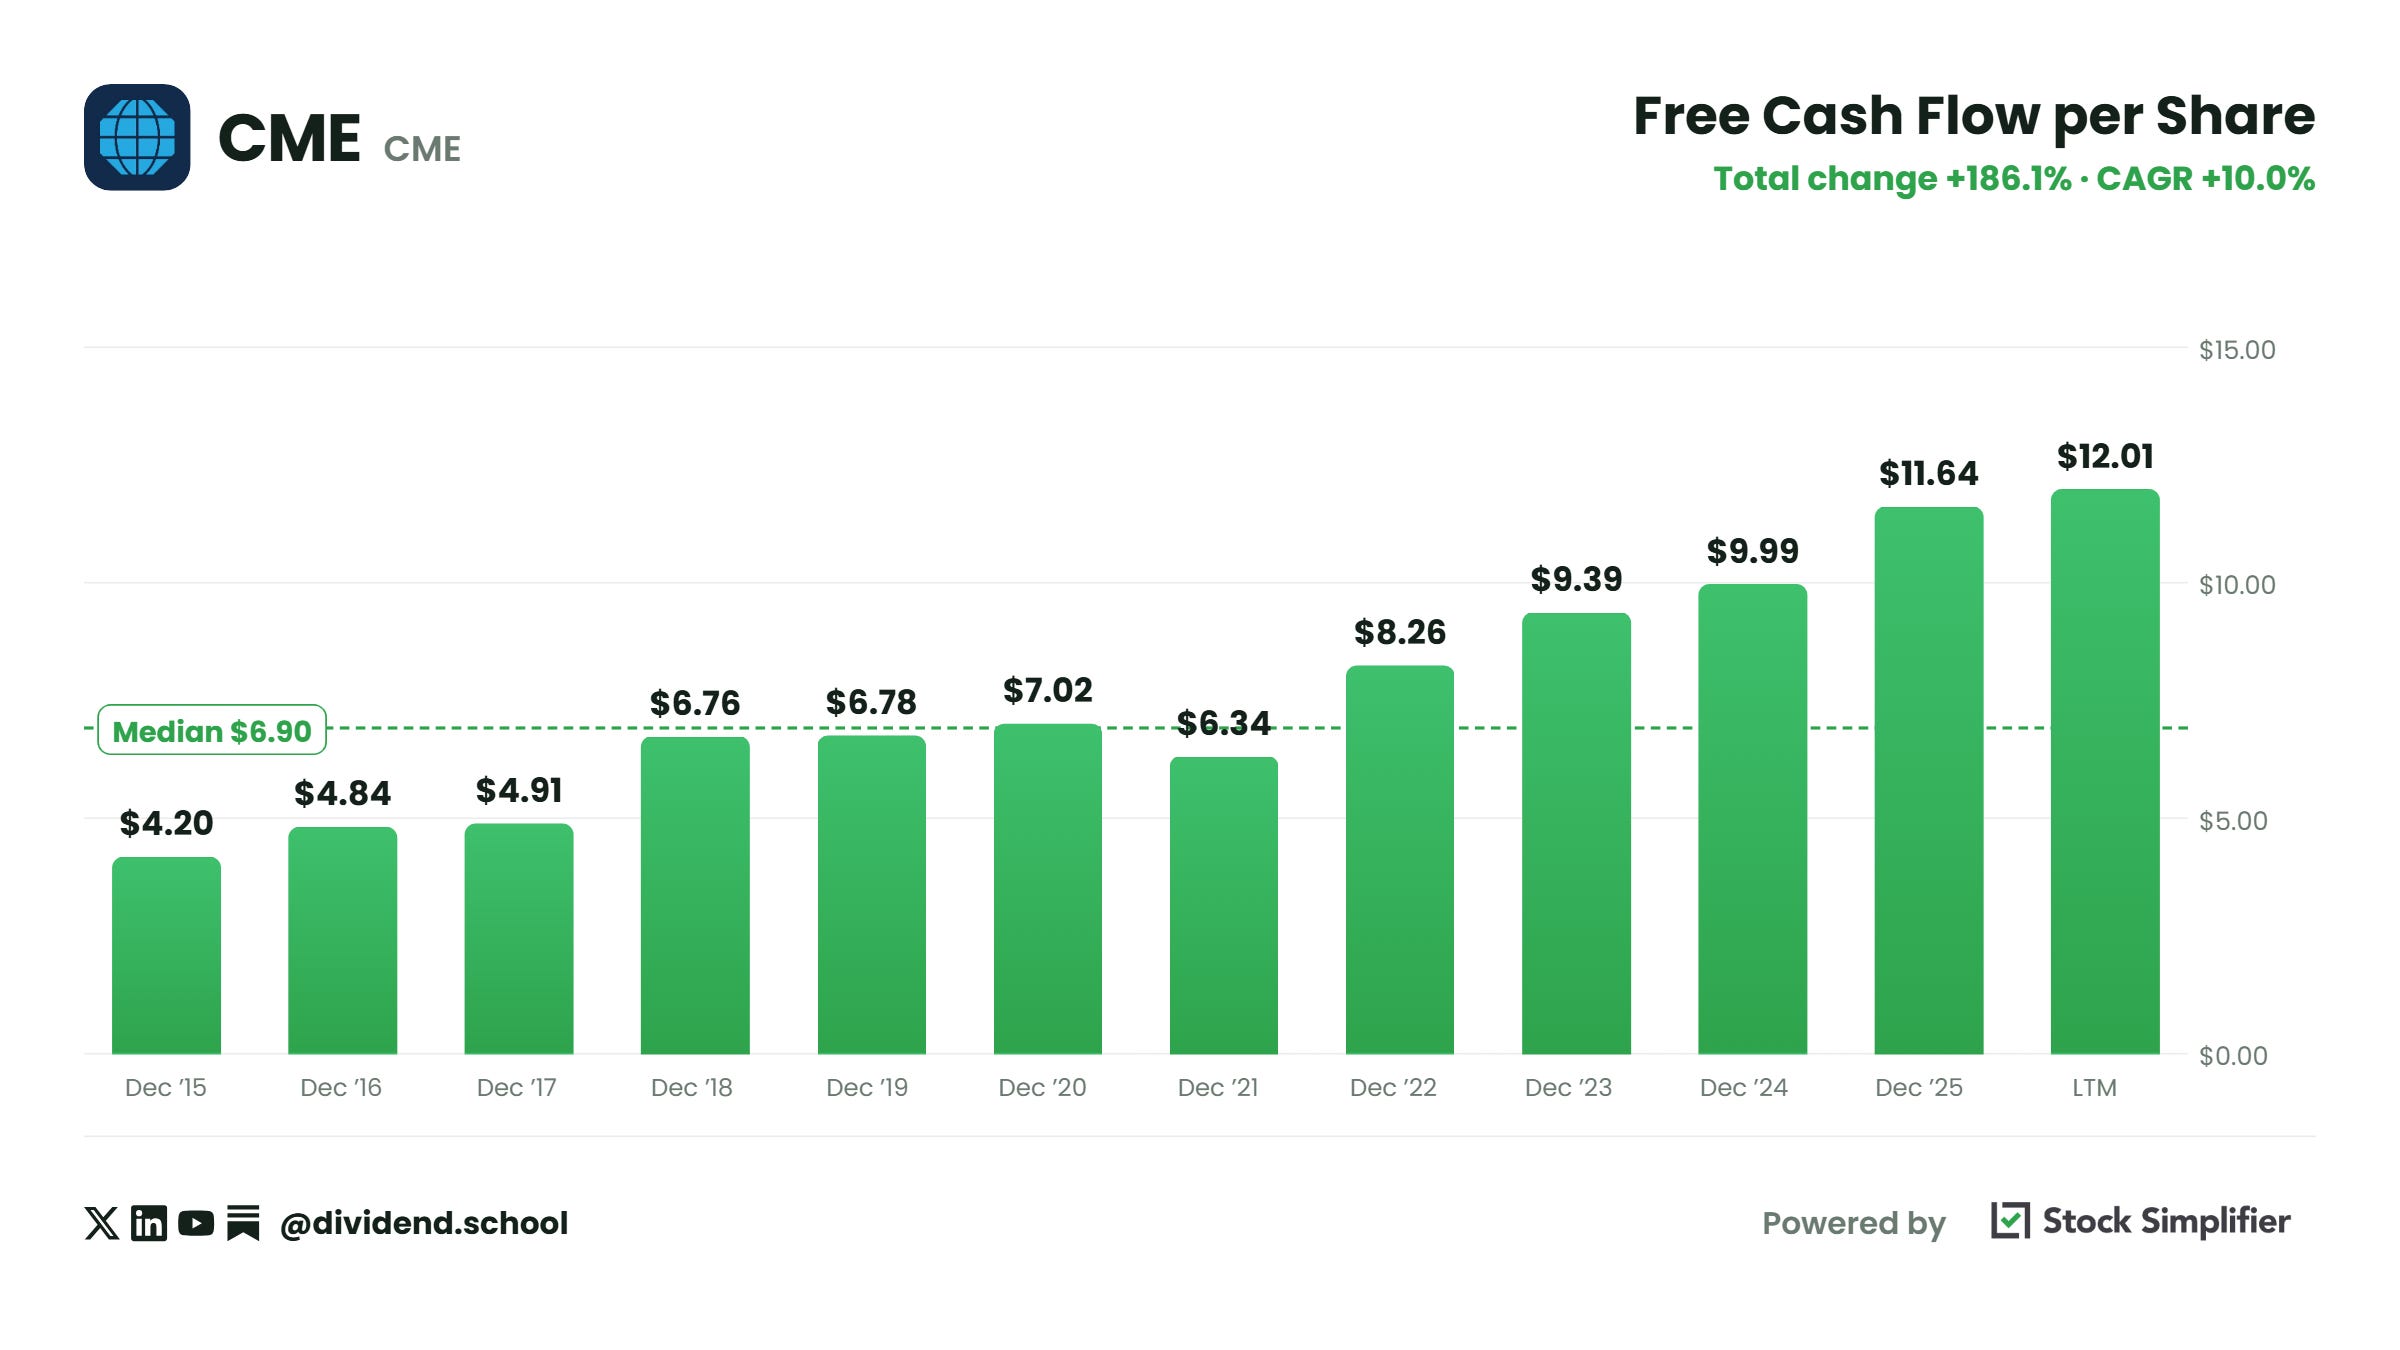
Free cash flow per share grew 10.7% a year over the last ten years and 12.1% a year over the last three. That’s the number our valuation runs on, so remember it.
How much debt?
Long-term debt: $3,425.1 million at September 30
Nothing due in the next 12 months; $500 million in 2028, $750 million in 2030, and $2.2 billion after that
Operating income covered interest 24.4 times in 2025 ($4,229.5M / $173.4M)
Debt equals 0.8 years of free cash flow
Easy question for us to answer. The debt is a rounding error next to the cash coming in.
What about the cash pile?
We see corporate cash fall from $4,416.9 million at the end of 2025 to $2,198.5 million at September 30. The dividend section explains why, and it matters for next year’s variable.
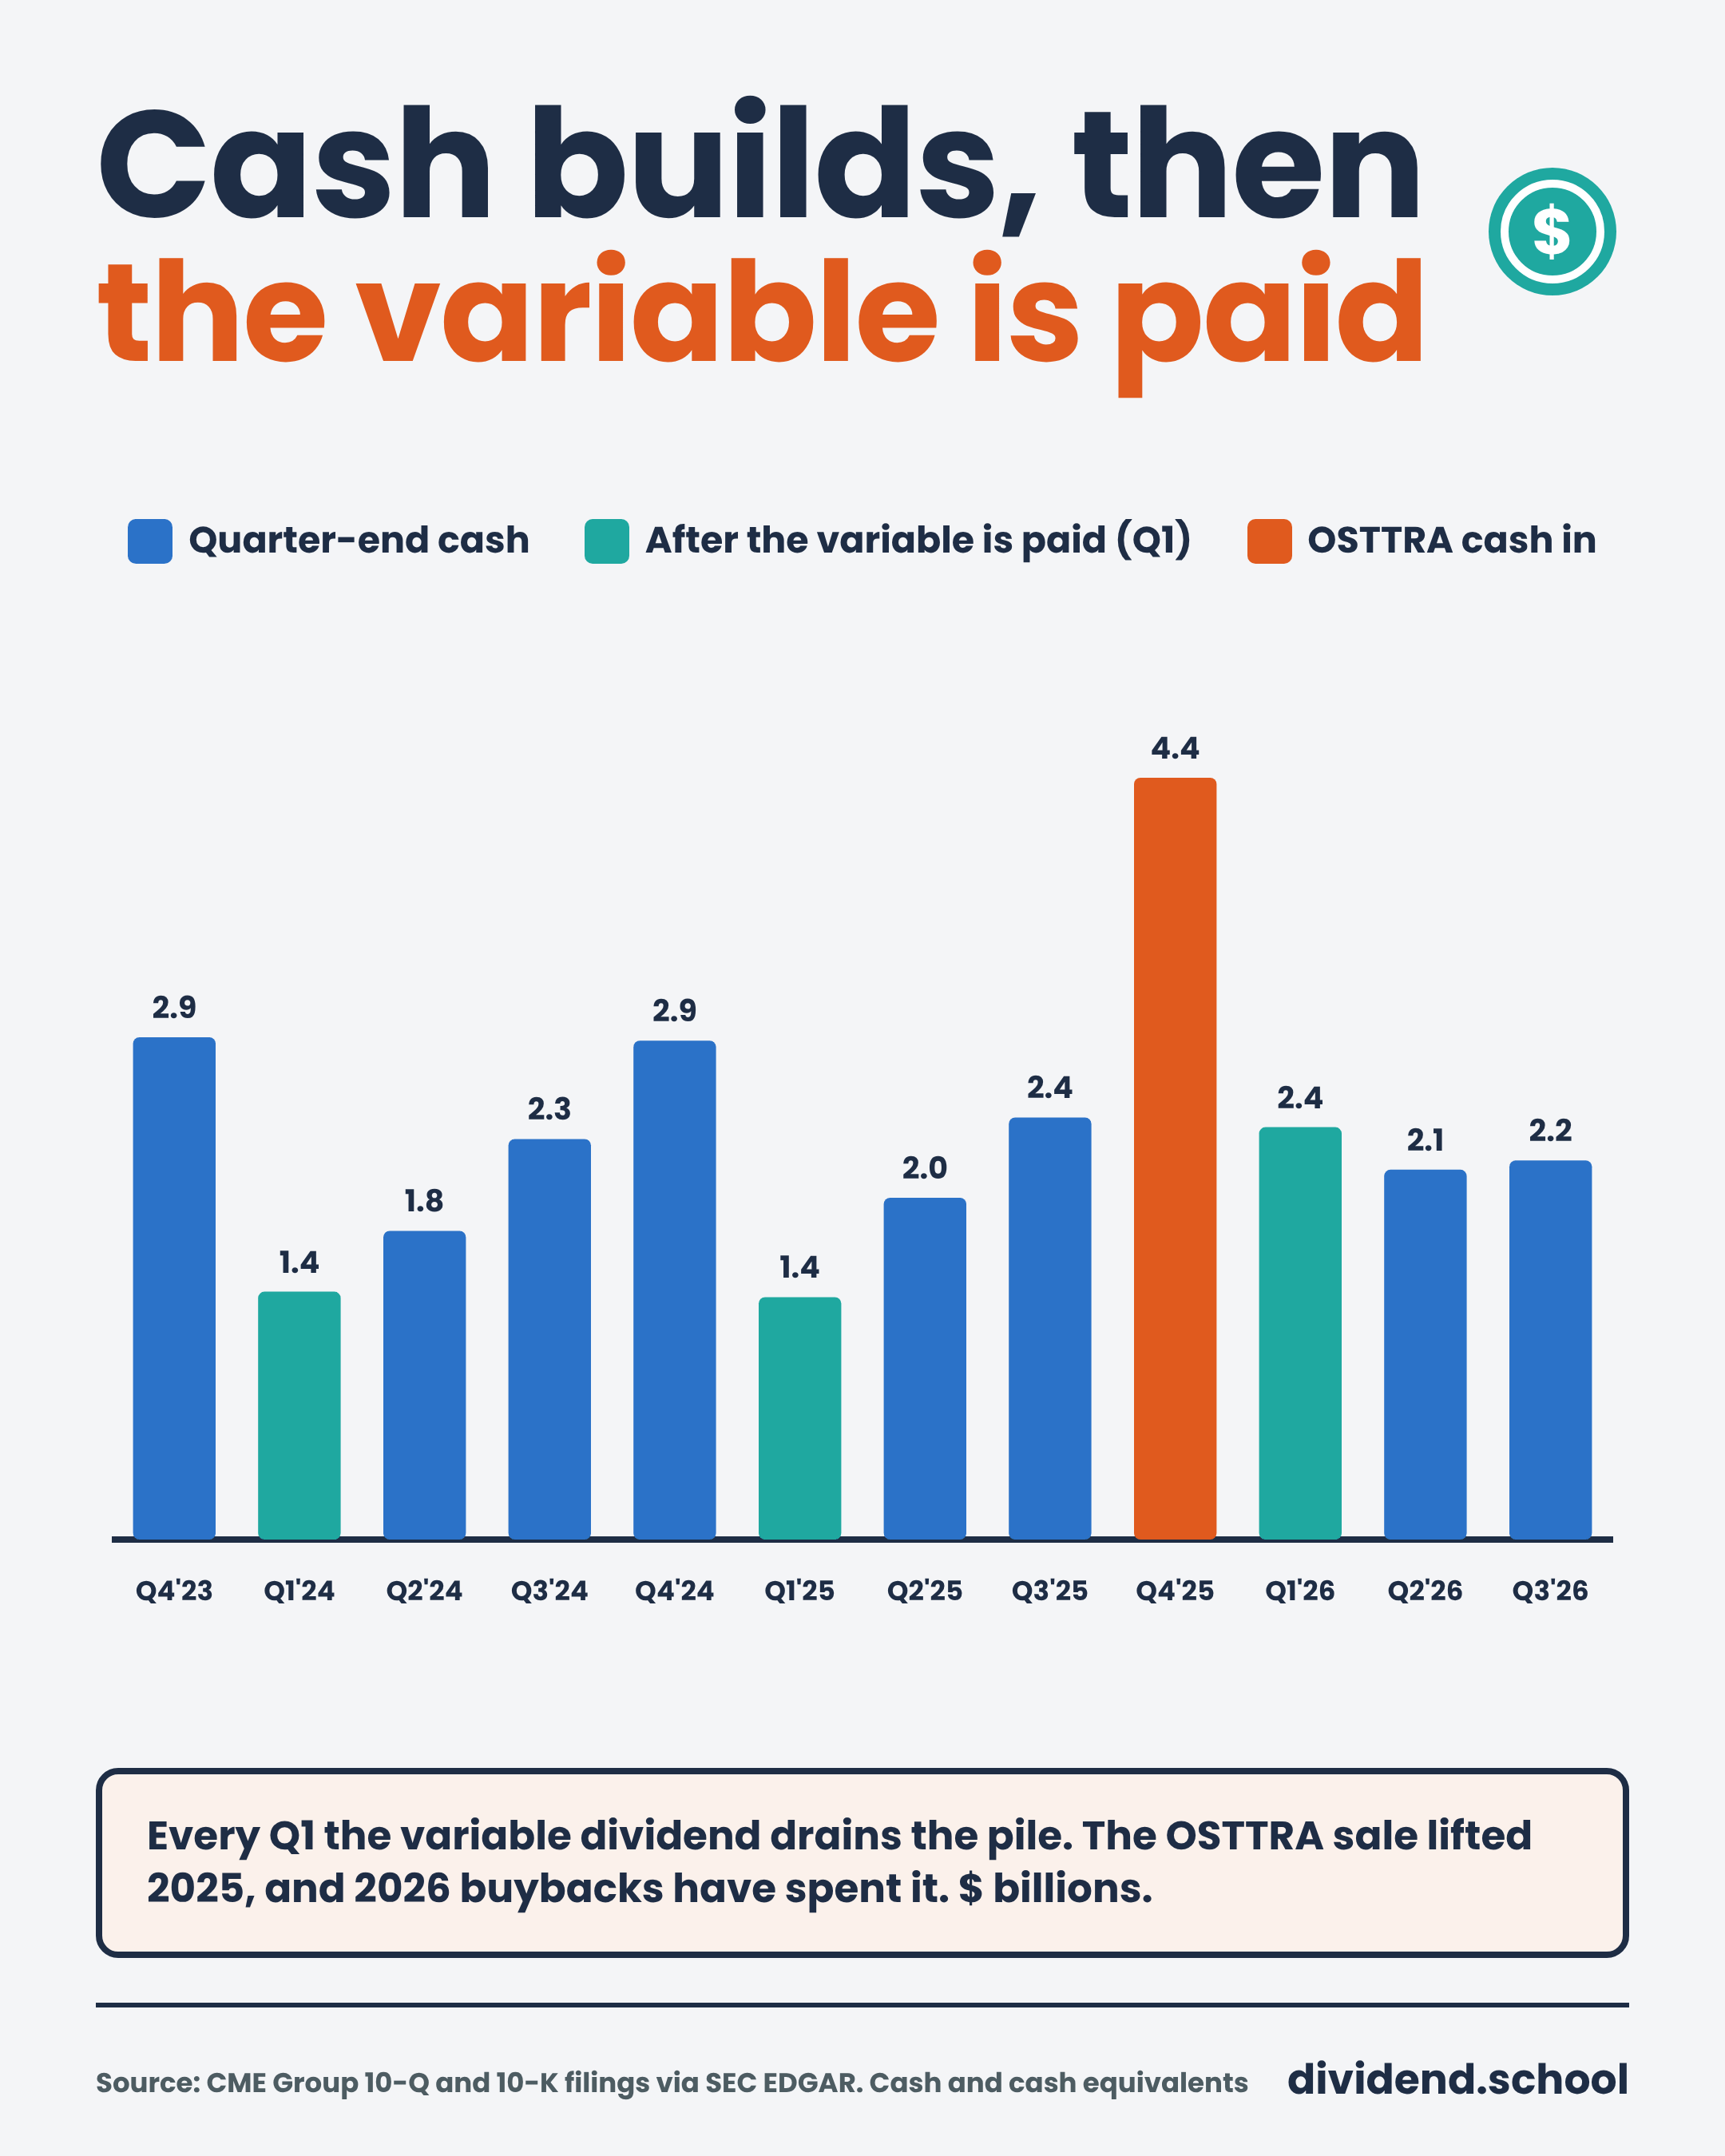
Share count. Diluted shares were 358.6 million in the third quarter against 360.4 million a year earlier. That understates the drop. In March, the 4.6 million shares of convertible preferred stock CME sold in 2021 converted into regular stock. They always collected the same dividend as a common share, but they only started counting in the diluted figure this year. Counted both years, the share count fell 1.7% (358.6M / (360.4M + 4.6M)). That’s the buybacks at work.
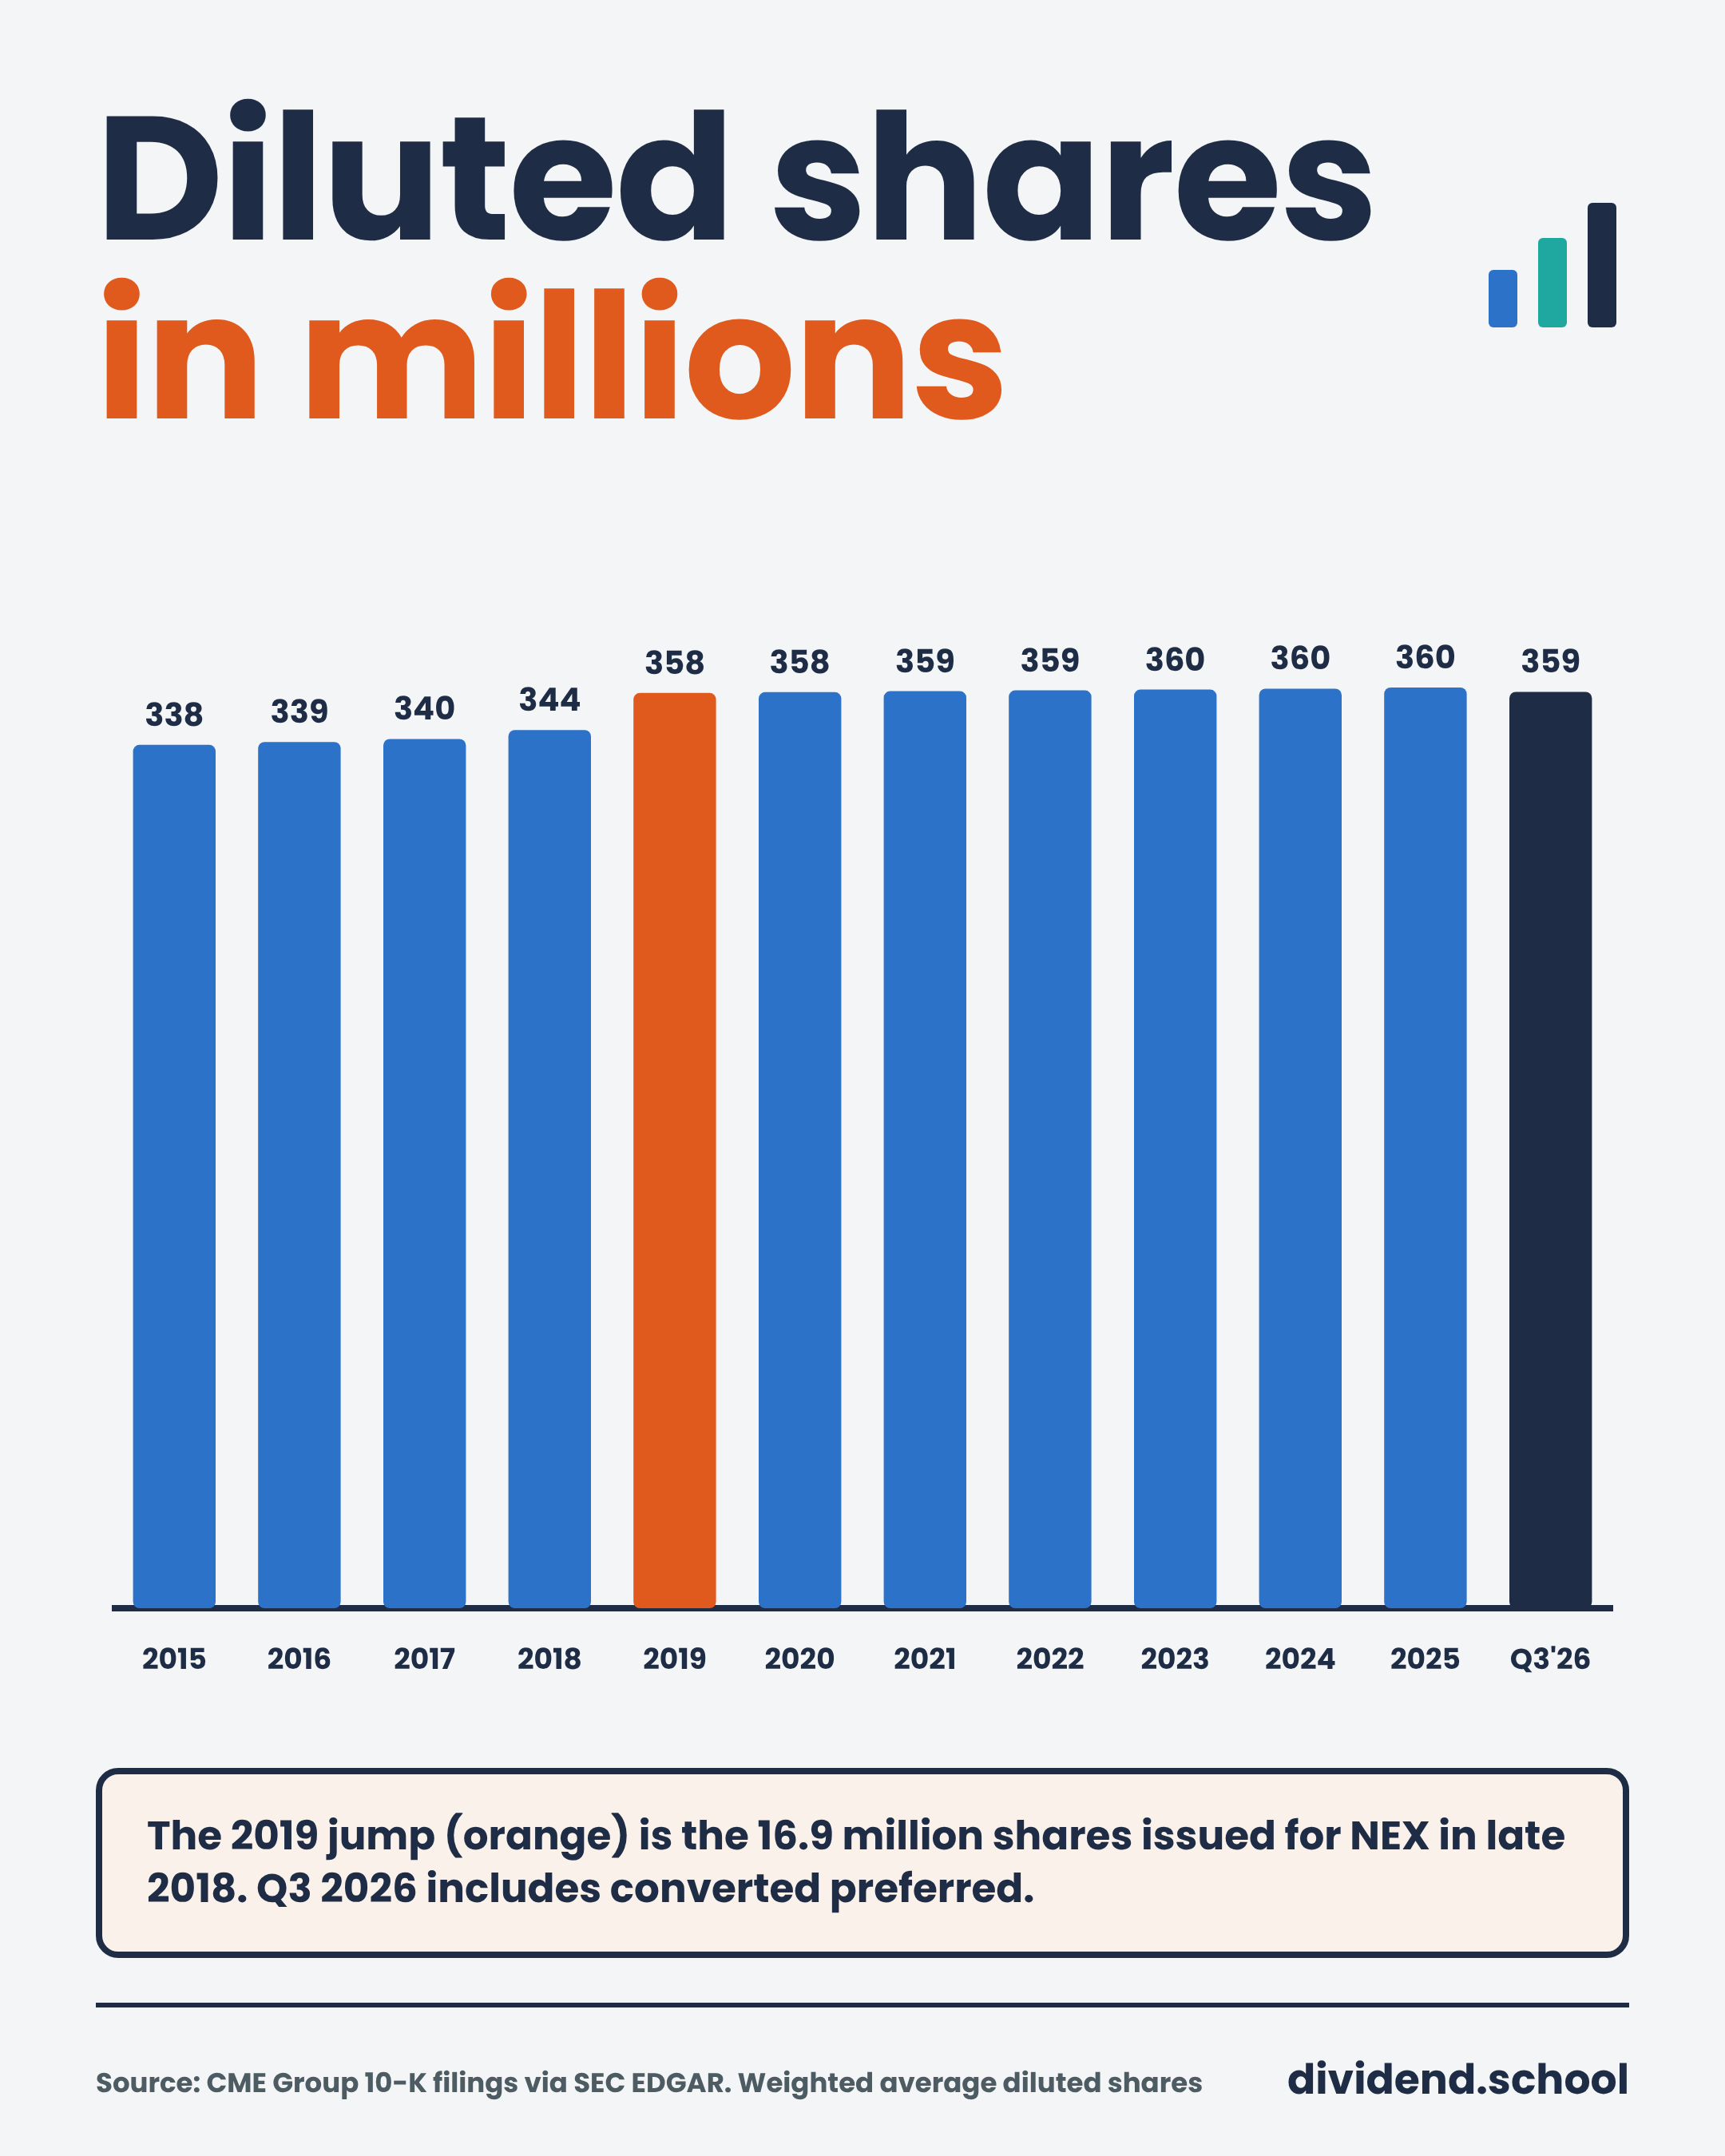
The jump we see in 2018 is the 16.9 million shares CME issued to buy NEX. That deal shows up again in the dividend story.
Already a paid Dividend School Pro subscriber? Keep scrolling. The dividend safety read, the fair value, and the Buy Below price are below.
The rest of this deep dive is for paid Dividend School Pro subscribers.
That’s the business, free. How a futures trade clears, how CME gets paid on each one, and how little it costs to run.
The part I can’t give away is what it means for our income and the price. Below the line:
Why CME paid out 99.6% of its 2025 earnings, the year it cut the variable in half, and what $2.0 billion of buybacks paid from the cash pile means for the next variable
The CEO handoff in March, the FanDuel retreat, and CME’s lawsuit against its own regulator
The fair value, the Buy Below price, and where CME sits against it today
Membership is $369 a year or $35 a month, and a 30-day money-back guarantee.