
Cash Flow is King: Earnings Quality Deep Dive

If you want to understand the true engine of a business, follow the cash—specifically, the cash a company generates after funding the stuff it needs to keep growing.
Net income can be flattered by accounting estimates and timing. Free cash flow (FCF) is harder to fake and more revealing about operational discipline, investment needs, and shareholder capacity.
In this deep dive, we’ll walk through a simple, repeatable framework for evaluating earnings quality using Alphabet (Google) as a three-year case study.
The core idea
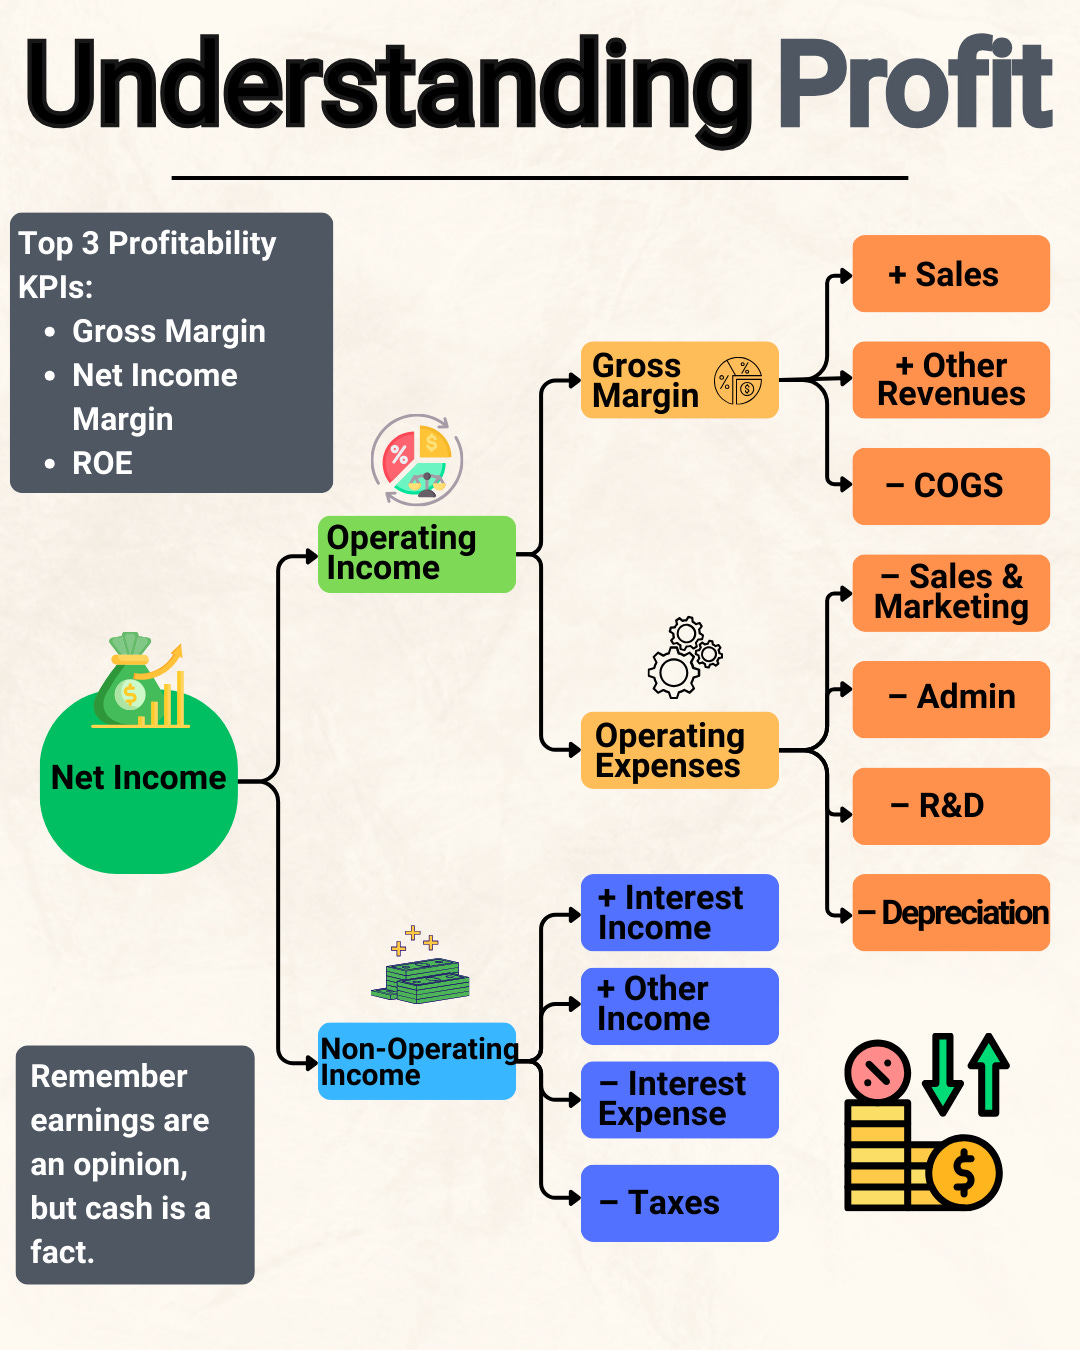
Net income tells you what the company earned on paper.
Cash from operations shows how much cash the business actually generated from its operations.
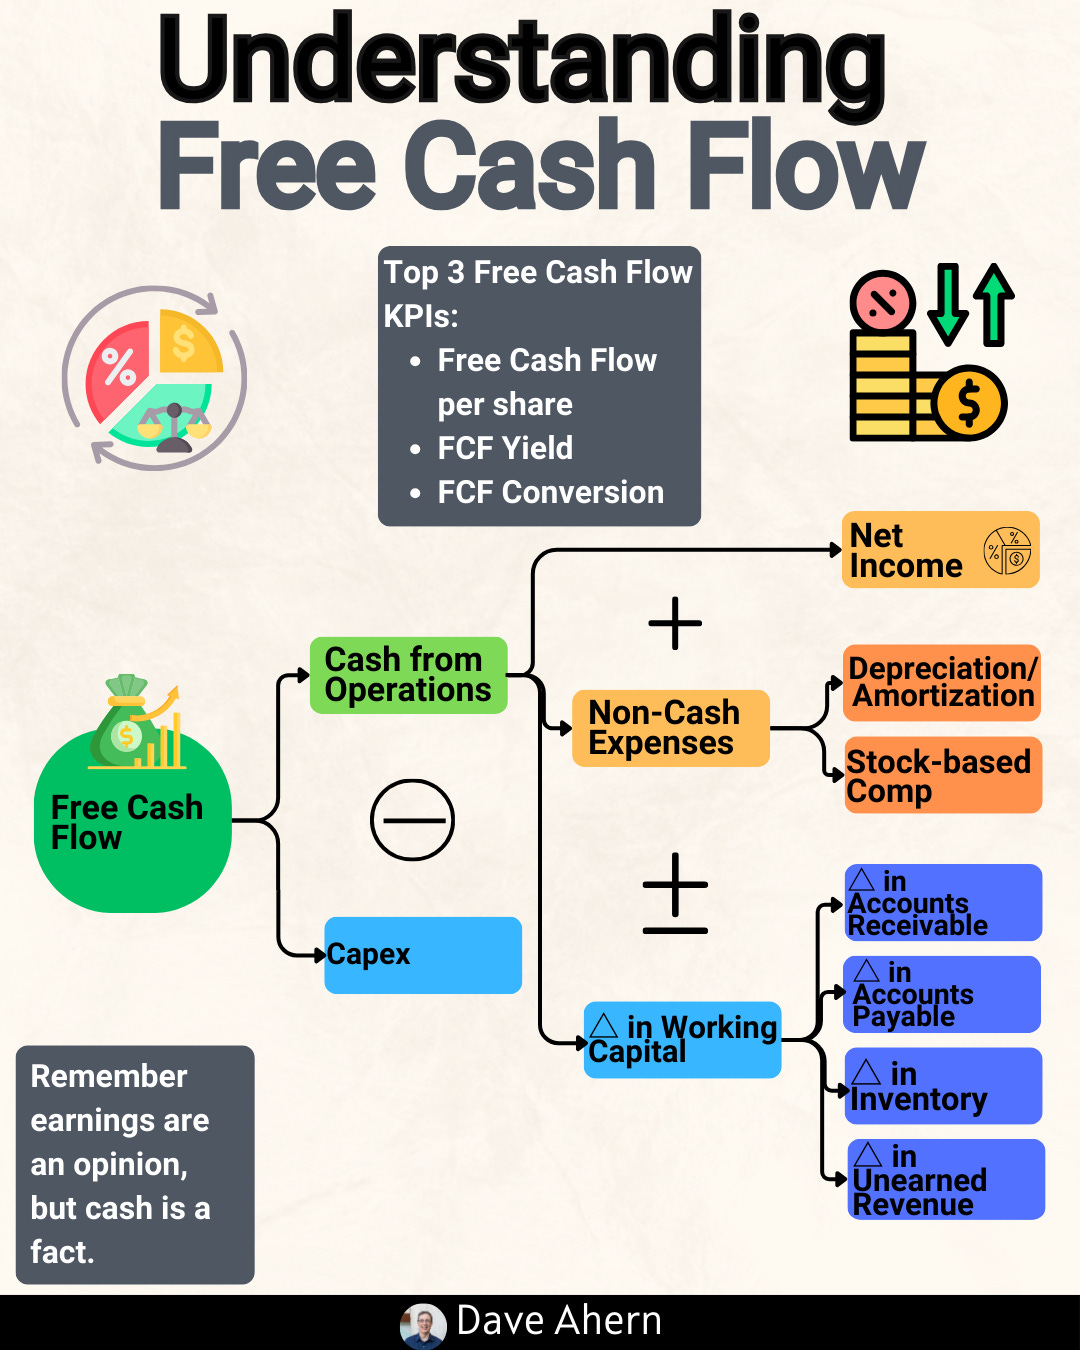
Free cash flow shows what’s left after the company invests to maintain and expand the business.
We’ll reconcile these step by step, then layer in working capital, capex, and FCF conversion to build a high-quality investor’s roadmap.
Key formulas
Free Cash Flow:
FCF = Cash From Operations (CFO) − Capital Expenditures (Capex)
FCF Conversion:
FCF Conversion = Net Income / FCF
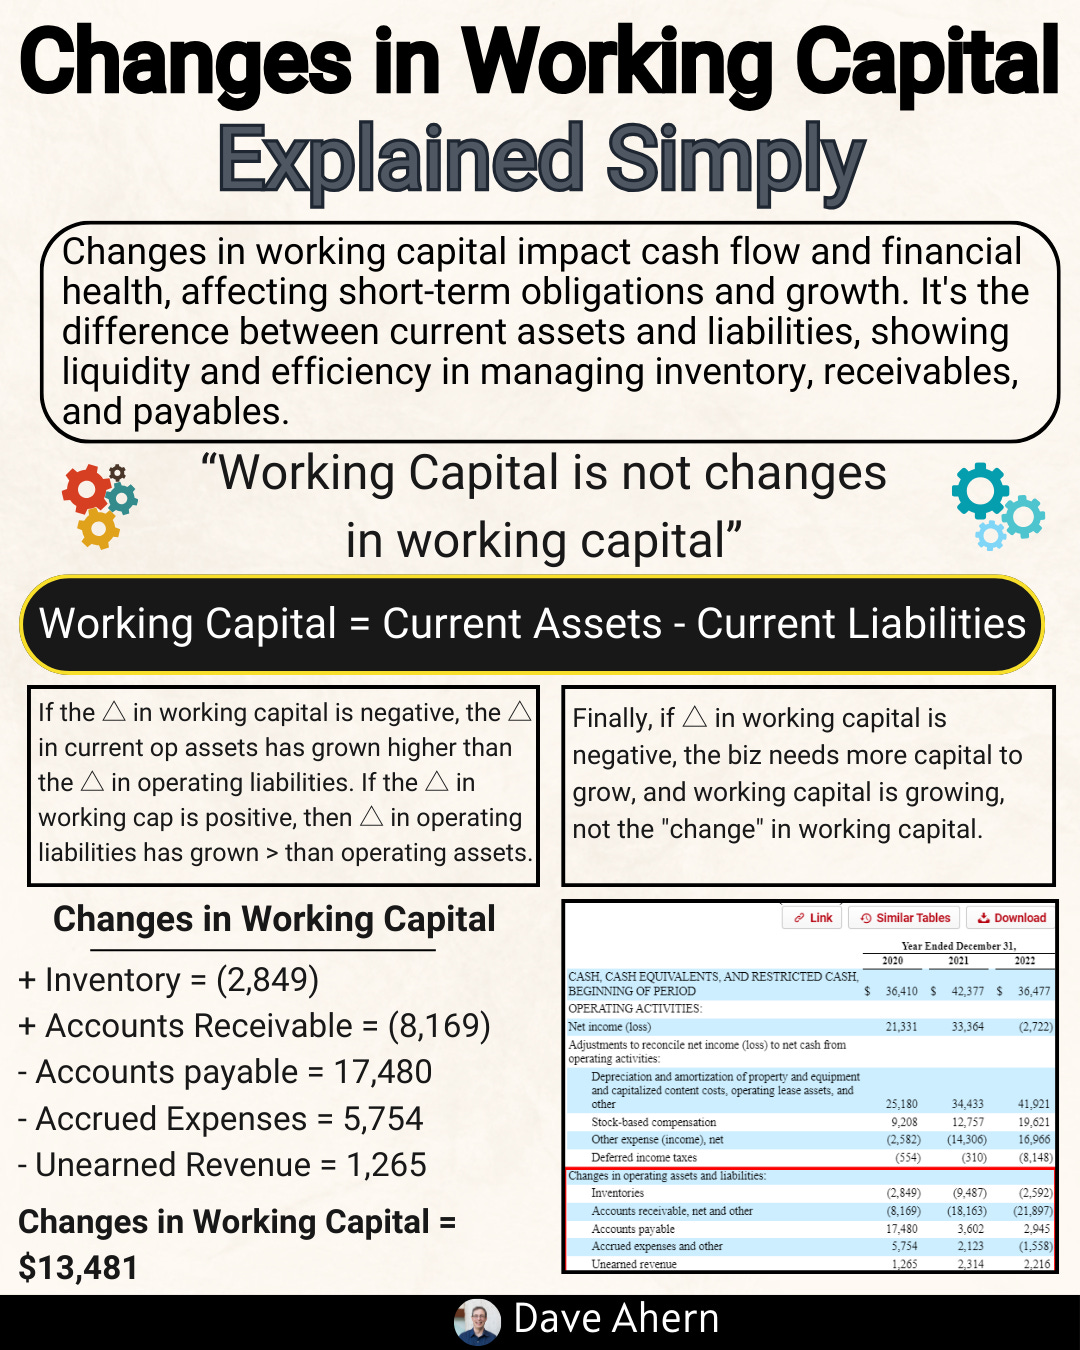
Change in Working Capital (simplified):
ΔWC ≈ Δ Receivables + Δ Inventory + Δ Other Current Assets − Δ Payables − Δ Accrued Liabilities
Alphabet’s three-year snapshot (FY2022–FY2024)
Rounded to the nearest tenth where applicable.
2022
Net income: ~$60.0B
Cash from operations (CFO): ~$91.6B
Capex: ~$31.5B
Free cash flow (FCF): ~$60.1B
FCF conversion: ~100%
2023
Net income: ~$73.8B
CFO: ~$101.7B
Capex: ~$32.3B
FCF: ~$69.5B
FCF conversion: ~94%
2024
Net income: ~$100.1B
CFO: ~$125.3B
Capex: ~$52.5B
FCF: ~$72.8B
FCF conversion: ~73%
What stands out:
Alphabet’s CFO grew from 2022 to 2024, reflecting durable operating strength.
Capex jumped significantly in 2024 as Alphabet invested in AI and data center infrastructure—this compresses FCF even if operating cash generation is steady.
FCF conversion stepped down in 2024, not because the core business weakened, but because the company chose to invest heavily. For investors, that distinction is critical.
Step 1: Reconcile net income to cash from operations
Ask: How much of earnings turned into cash?
Key drivers:
Non-cash add-backs: Depreciation, amortization, and stock-based compensation boost CFO relative to net income.
Working capital: Timing of receivables, payables, and accruals can add or subtract cash in a given year.
Alphabet shows a consistent pattern: strong non-cash add-backs and manageable working capital noise. Across 2022–2024, CFO comfortably exceeds net income—good evidence of high “earnings cashiness.”
What good looks like:
CFO consistently at or above net income over multi-year periods.
Volatility in working capital that’s explainable by growth, seasonality, or one-offs (not chronic cash leakage).
Step 2: From CFO to Free Cash Flow
Ask: After funding the business, what’s left?
FCF is simply CFO minus capex.
Sustained high FCF supports buybacks, dividends, M&A, and balance sheet strength.
For Alphabet:
2022–2023: Capex intensity was healthy but moderate; FCF rose with operating scale.
2024: Capex accelerated, reducing FCF even as CFO stayed strong. This reflects a strategic reinvestment cycle rather than a deterioration in quality.
What good looks like:
FCF that trends with CFO over time.
Capex cycles that align with clear strategic priorities and expected returns (e.g., AI infrastructure).
Step 3: Working capital—signal vs. noise
Working capital can distort CFO year to year. For fast-growing platforms, receivables may rise (cash headwind) while payables and accruals offset (cash tailwind). The point is to identify patterns:
Is the business chronically consuming cash in working capital without commensurate growth? Red flag.
Or are fluctuations consistent with growth and seasonality? Usually fine.
Alphabet’s fluctuations have been manageable; the bigger story for 2024 is capex, not working capital.
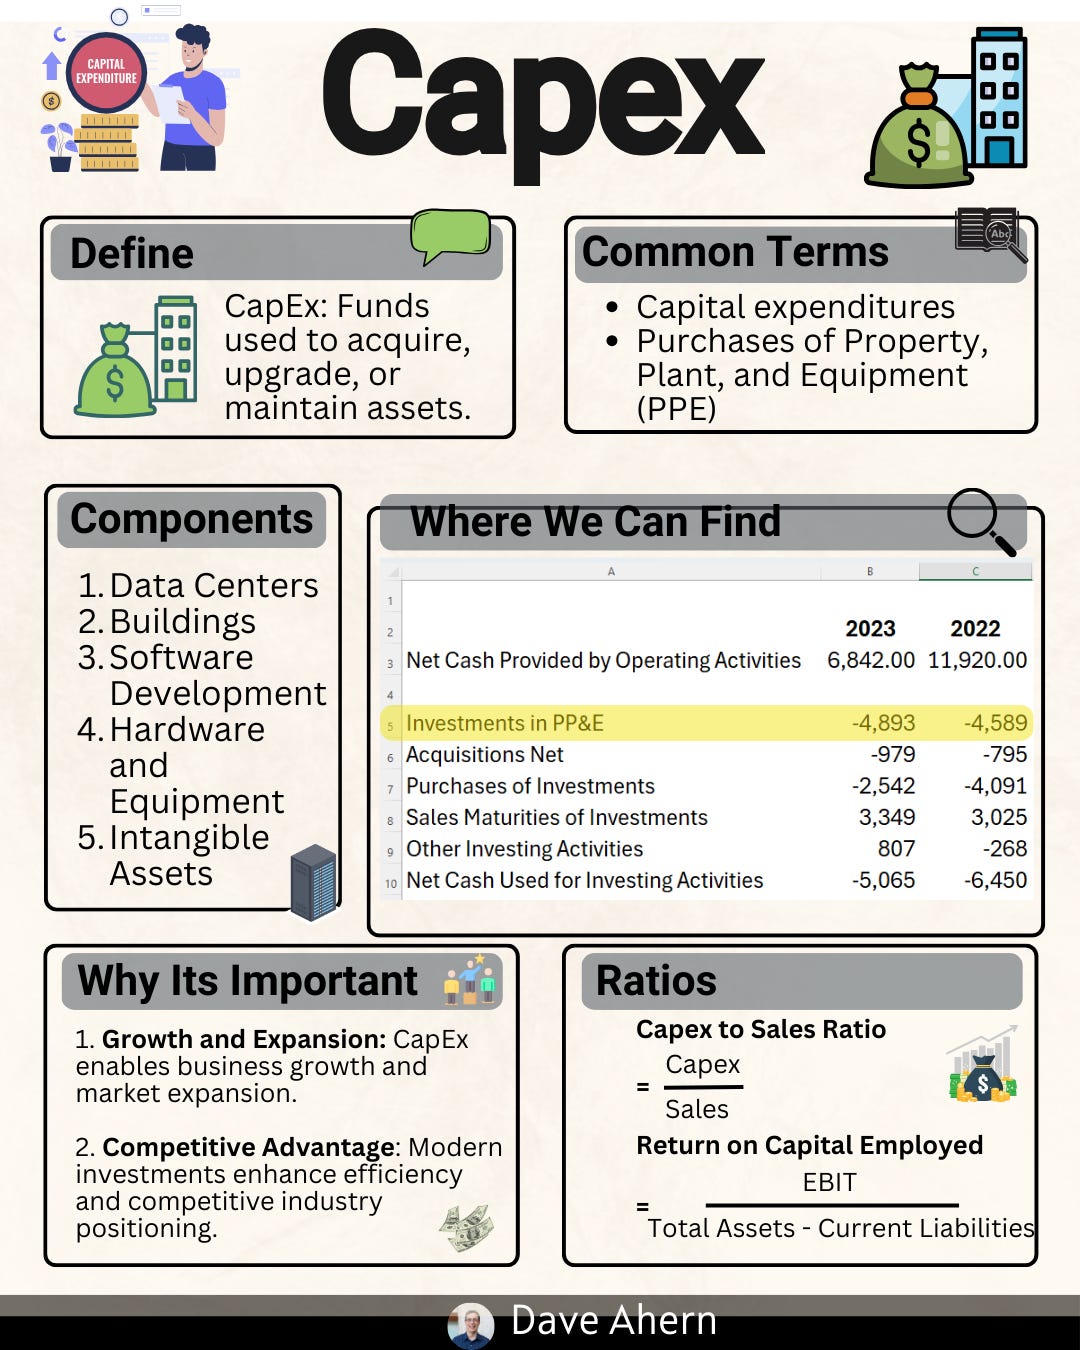
Step 4: Capex—maintenance vs. growth
Try to separate:
Maintenance capex: Keeps the lights on. Largely nondiscretionary.
Growth capex: Funds future products, capacity, and moats.
Alphabet’s 2024 surge is driven by growth capex in AI and data centers. Whether this is “good” depends on return on invested capital (ROIC) over time. The immediate effect is lower FCF; the long-term payoff should be stronger revenue, efficiency, and pricing power.
Step 5: FCF conversion ratio—quality and resilience
FCF conversion contextualizes earnings quality:
2022: ~100%
2023: ~94%
2024: ~73%
Interpretation:
High and stable conversion suggests clean earnings and efficient reinvestment.
A temporary dip (as in 2024) can be fine if it reflects high-return growth spending. If conversion stays depressed without clear payoff, reassess.
Investor’s roadmap: A repeatable checklist
Use this anytime you analyze a business.
Start with net income trend (3–5 years)
Is growth steady, volatile, or flat?
Are there known one-offs (restructures, impairments)?
Move to CFO
Is CFO ≥ net income over time?
What non-cash items drive the gap? Are they stable?
Inspect working capital
Are changes consistent with growth and seasonality?
Any chronic cash drain in receivables or inventory (for non-asset-light firms)?
Analyze capex
How cyclical is capex? Any clear shift in intensity?
Maintenance vs. growth: what narrative and KPIs justify the spend?
Compute FCF and FCF conversion
Multi-year FCF trend and conversion ratio.
Compare to peers with similar models to contextualize capital intensity.
Tie to capital allocation
Is FCF being returned (buybacks/dividends) or reinvested (capex/M&A)?
Does allocation line up with the company’s moat and strategic priorities?
Sanity checks
Share-based compensation: Is dilution offset by repurchases?
Leverage: Is the balance sheet supporting or masking FCF?
Unit economics and segment margins: Are investments improving structural profitability?
Bottom line
Cash flow is king because it forces you to connect income statement stories with cash realities. Alphabet’s 2022–2024 arc illustrates a high-quality operator entering a heavy investment cycle—CFO strength intact, FCF temporarily compressed by capex.
For long-term investors, the central question is the return on that incremental AI and infrastructure spend. Track the conversion ratio, watch for CFO growth to outpace capex over time, and look for evidence (utilization, product momentum, margin leverage) that today’s cash outlays are compounding tomorrow’s earnings power.
Sources:
Alphabet 2024 Form 10‑K (FY ended Dec 31, 2024) Alphabet 2024 10-K PDF
Master Class
In
Fundamental
Investing
Anybody interested in investing should understand the relationship between net income and free cash flow, and this is a very good start if you’re trying to see the big picture.
My two cents:
– Unlike the standard cash flow statement presentation, I prefer to subtract share-based compensation from free cash flow, because paying employees with stock has a real economic cost and companies often need to repurchase shares to offset dilution.
– I think there’s a typo in the formula: FCF Conversion = Net Income / FCF should be FCF Conversion = FCF / Net Income, which is how free cash flow conversion is usually defined.