

“You only find out who is swimming naked when the tide goes out.”
Warren Buffett’s line about the tide fits dividend stocks as well as anything I know.
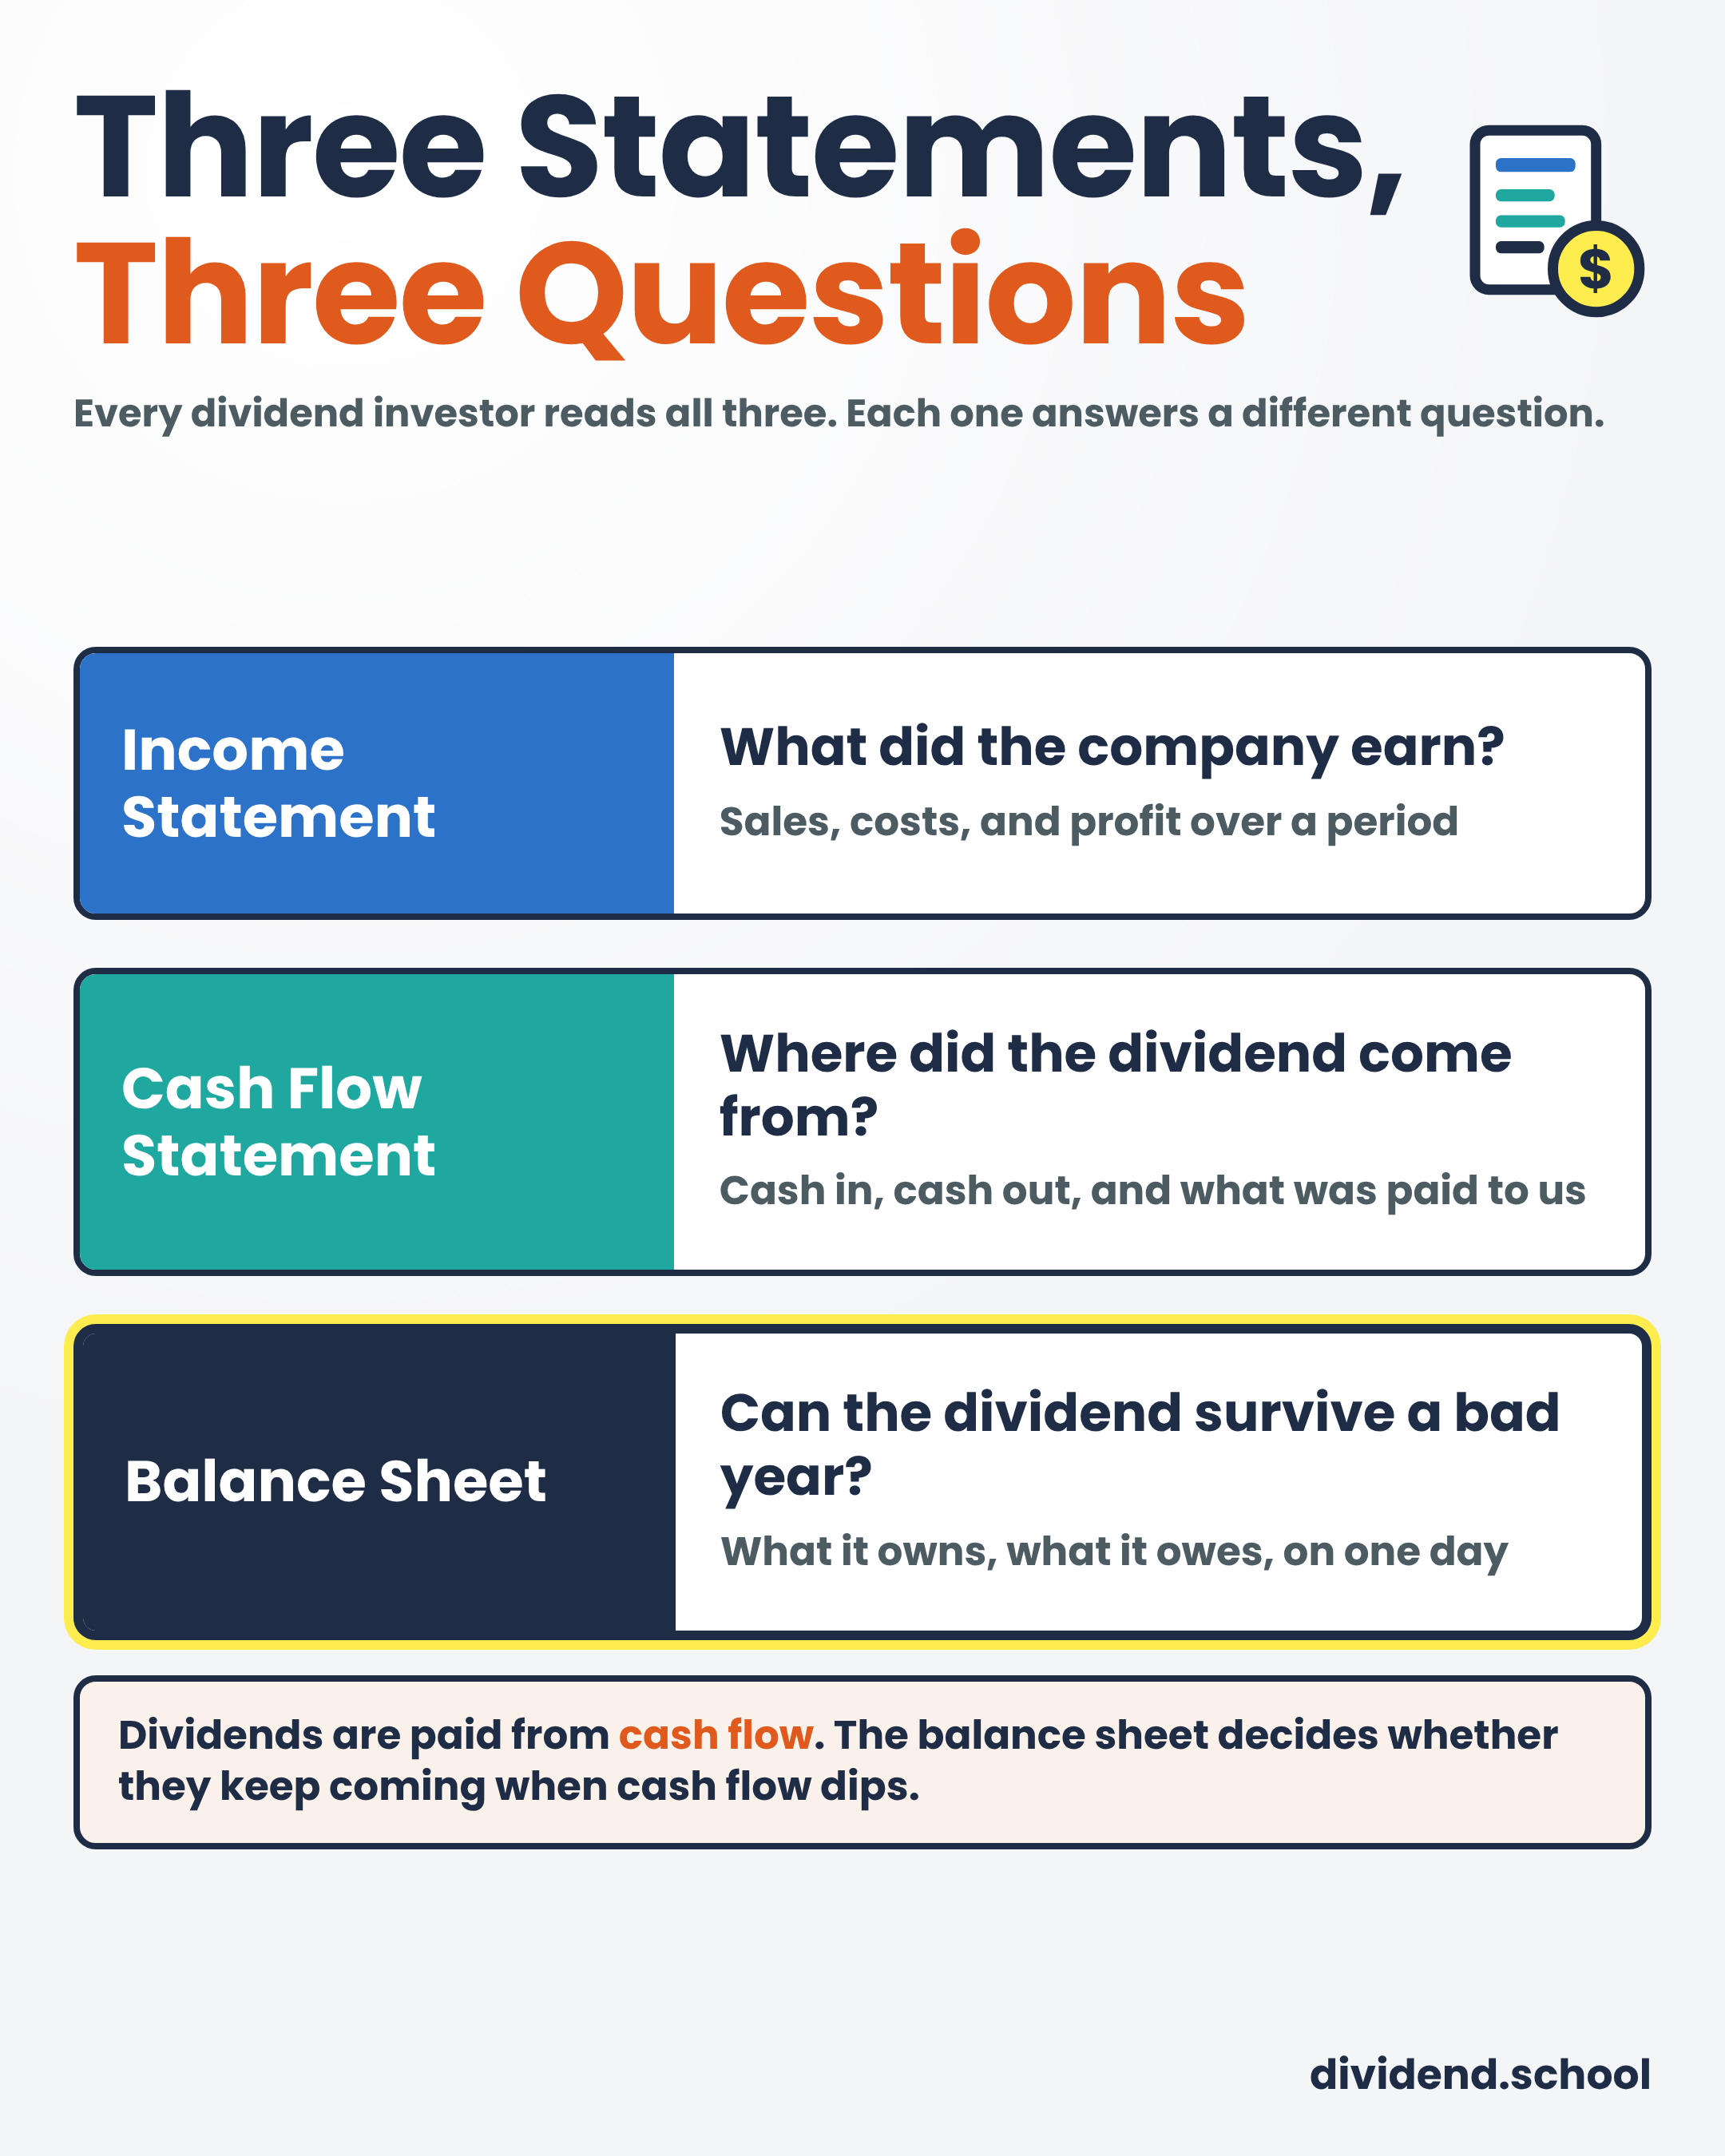
The income statement tells us what a company earned. The cash flow statement tells us where the dividend came from. The balance sheet tells us what happens when a bad year shows up, and for a dividend investor, that is the question that keeps the checks coming.
In today’s post, we will discuss:
What the Balance Sheet Tells a Dividend Investor
Check #1: Can They Pay the Bills This Year?
Check #2: How Much Debt Is Too Much?
Check #3: What Are the Assets Worth?
Check #4: What the Equity Section Says About Buybacks
Check #5: What’s Hiding in the Notes
The Balance Sheet Checklist
Common Mistakes to Avoid
We will use three well-known dividend payers as our guinea pigs: Johnson & Johnson (JNJ), Procter & Gamble (PG), and Home Depot (HD). JNJ and PG are both Dividend Kings. HD is a retailer with a very different balance sheet, which is exactly why it is here.
Okay, let’s dive in and learn how to read a balance sheet like a dividend investor.
What the Balance Sheet Tells a Dividend Investor
A balance sheet is a snapshot of one day. Everything the company owns on one side, everything it owes on the other, and the difference belongs to shareholders.
Assets = Liabilities + Shareholders’ Equity
That equation always balances. Hence the name.
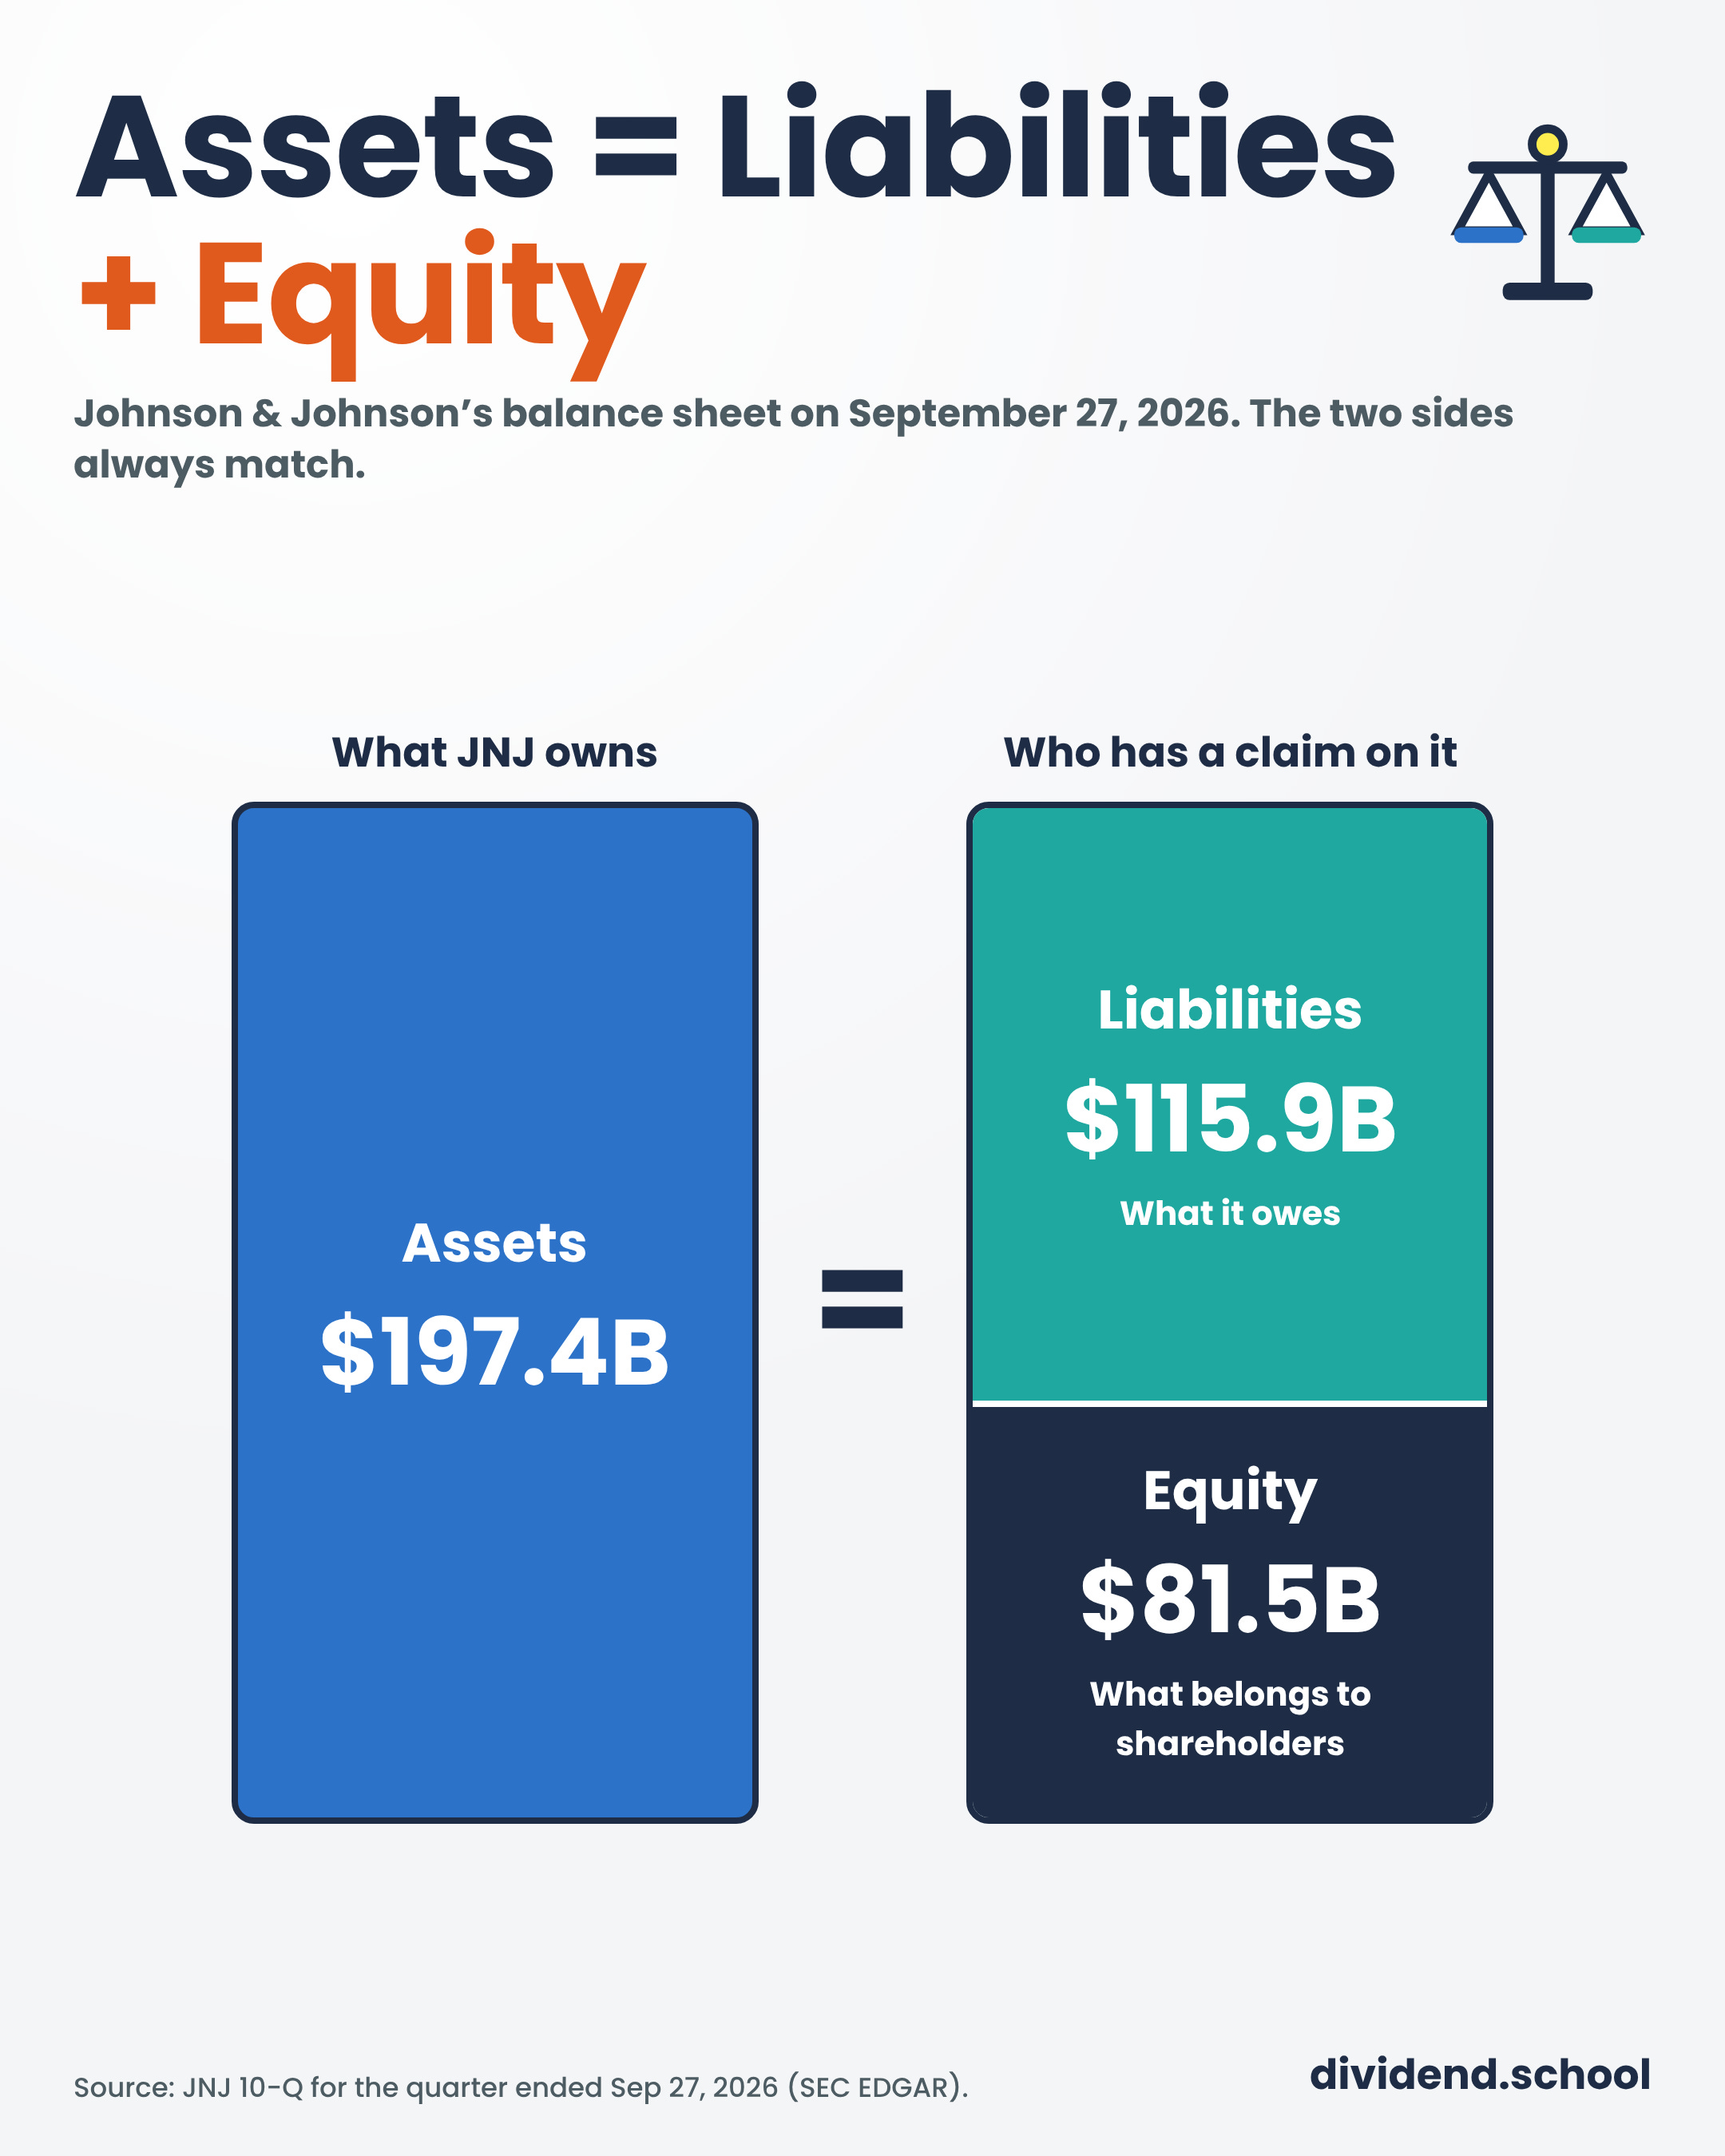
Big caveat before we start. Every number below comes from each company’s latest 10-Q, and those dates differ:
JNJ: September 27, 2026
PG: September 30, 2026
HD: August 2, 2026
Home Depot’s fiscal year ends in late January, so its “second quarter” lands in the summer. Always check the date at the top of the balance sheet before comparing two companies.
Why does a dividend investor care about a snapshot?
Because dividends come out of cash flow, but the balance sheet determines whether the company can keep paying them when cash flow dips. Debt gets paid first. Shareholders get what is left.
We run five checks, ad each one answers a simple question.
Check #1: Can They Pay the Bills This Year?
The first question is about the next twelve months. Current assets are things that turn into cash within a year. Current liabilities are bills due within a year.
The current ratio divides the first by the second.
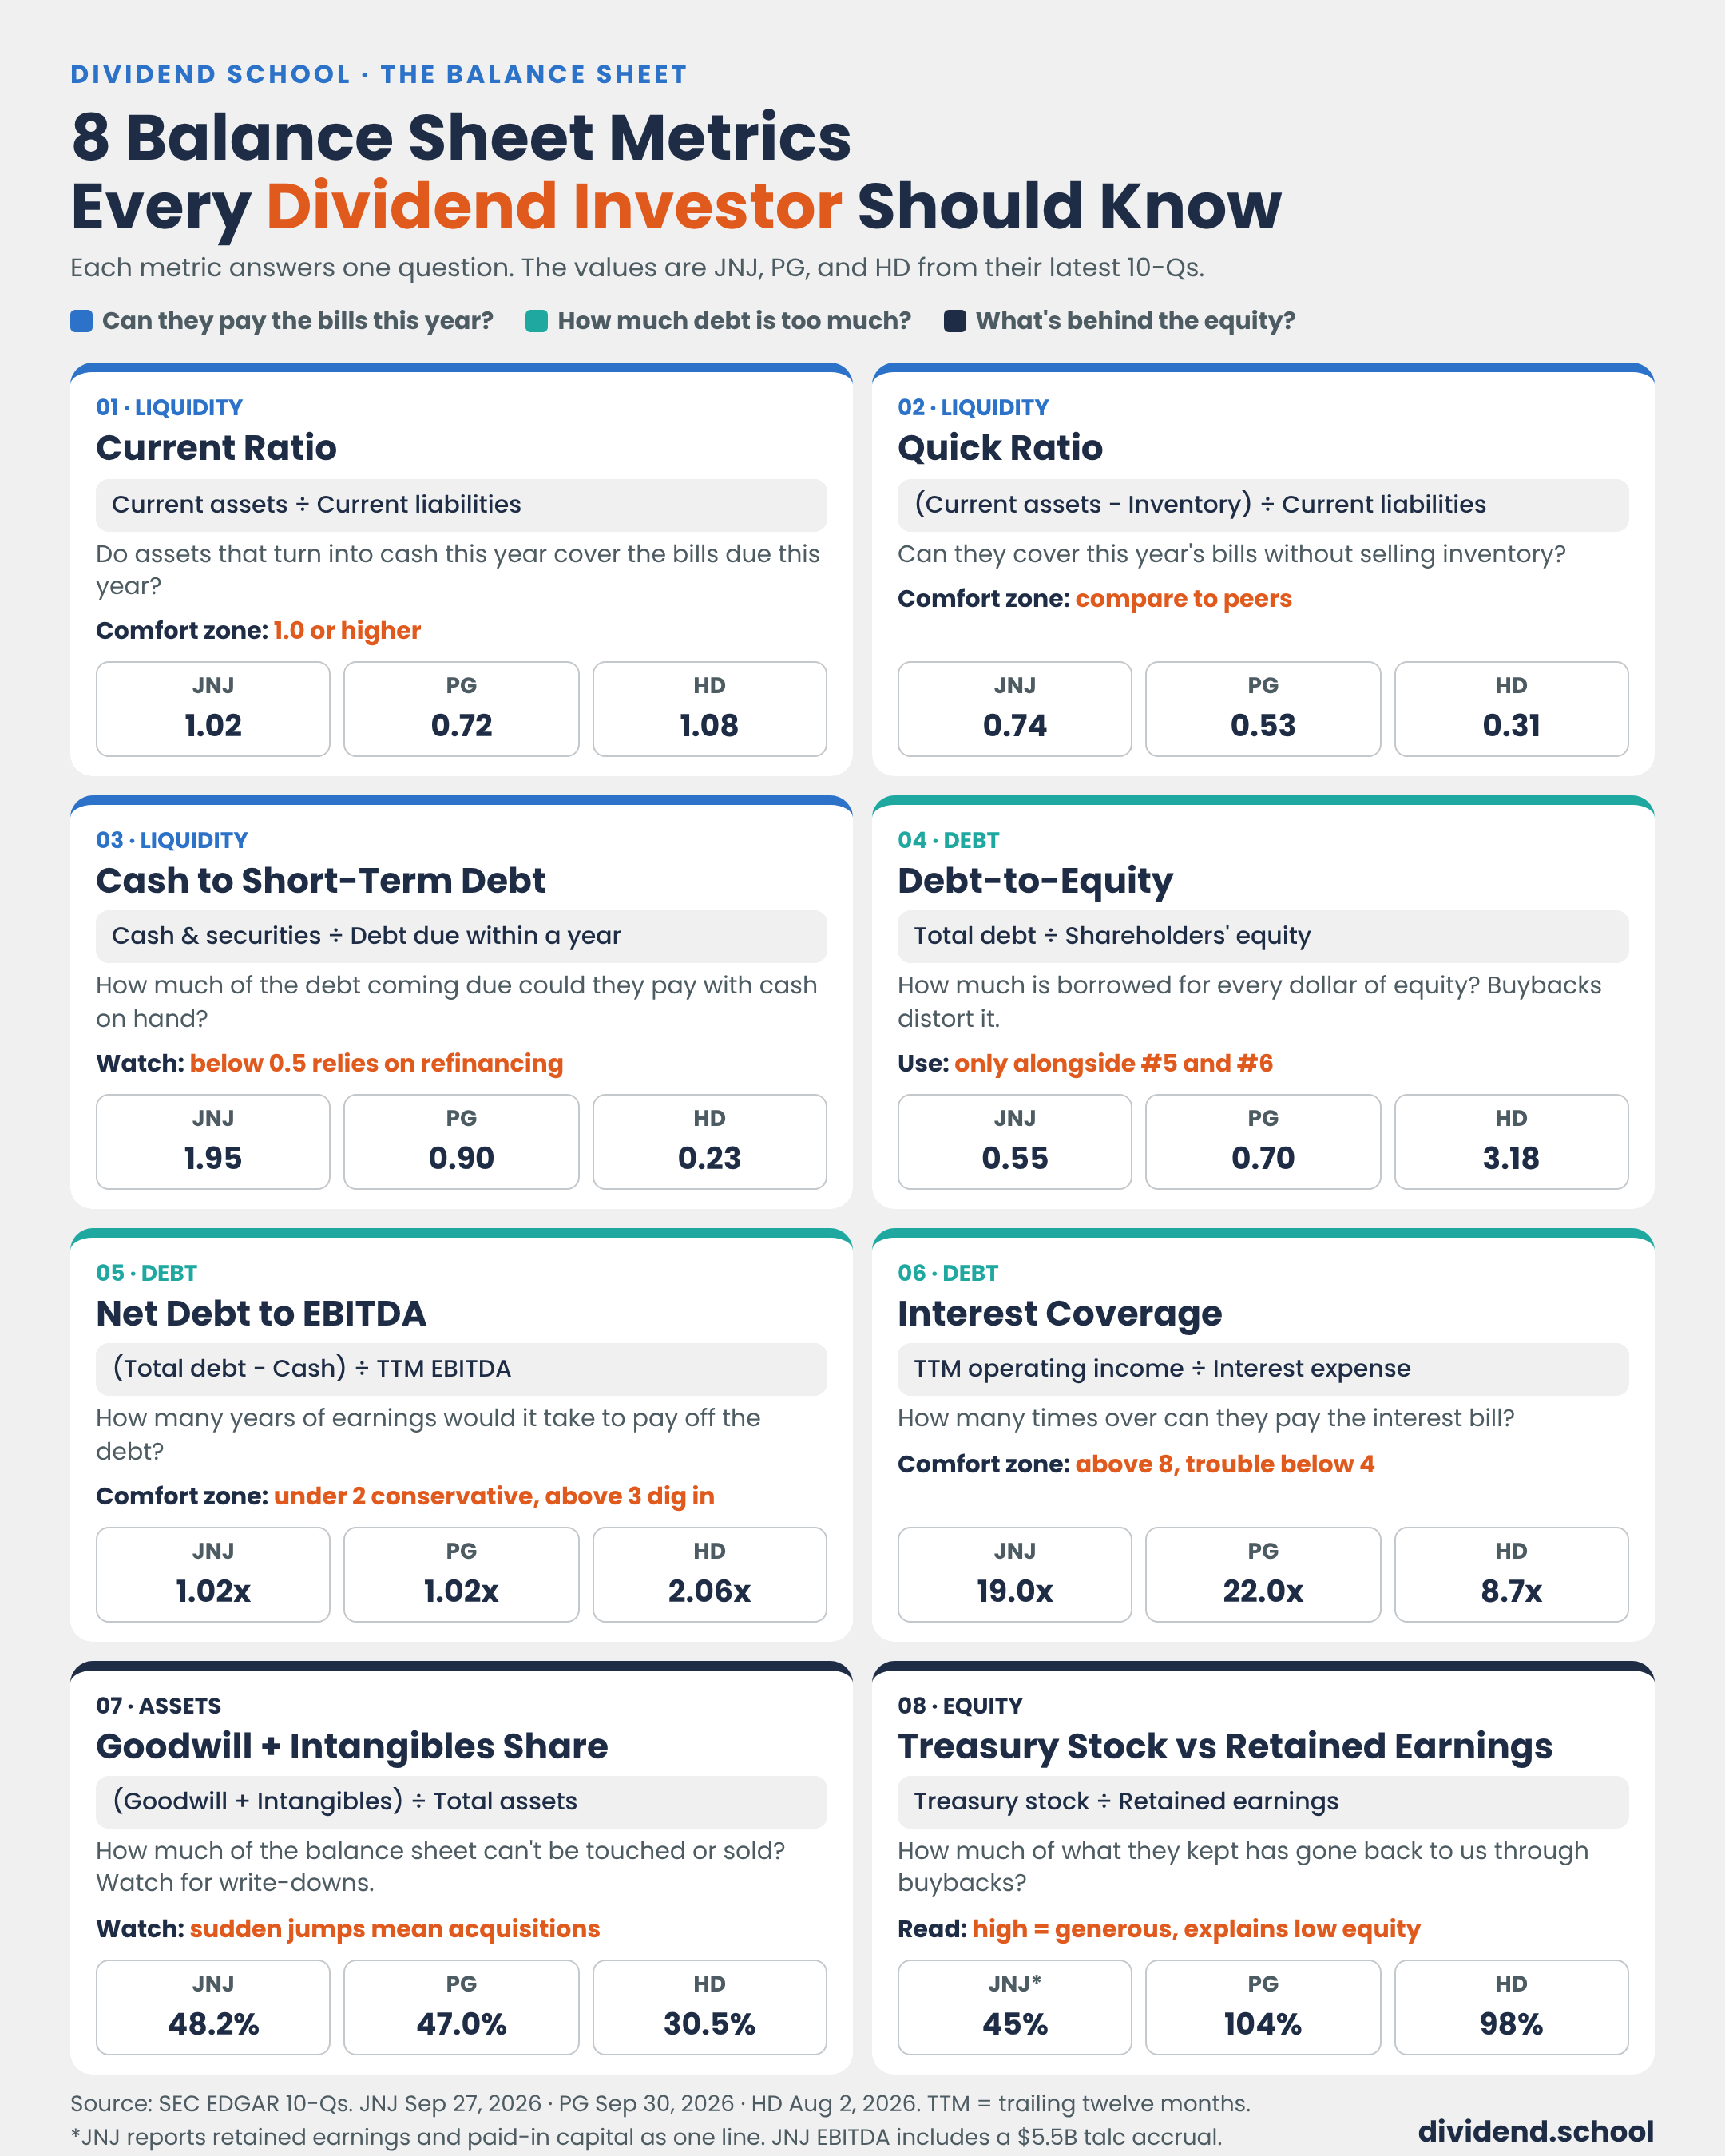
JNJ’s current ratio is 1.02 ($56,351 million of current assets / $55,457 million of current liabilities).
Here are all three:
JNJ: 1.02
PG: 0.72
HD: 1.08
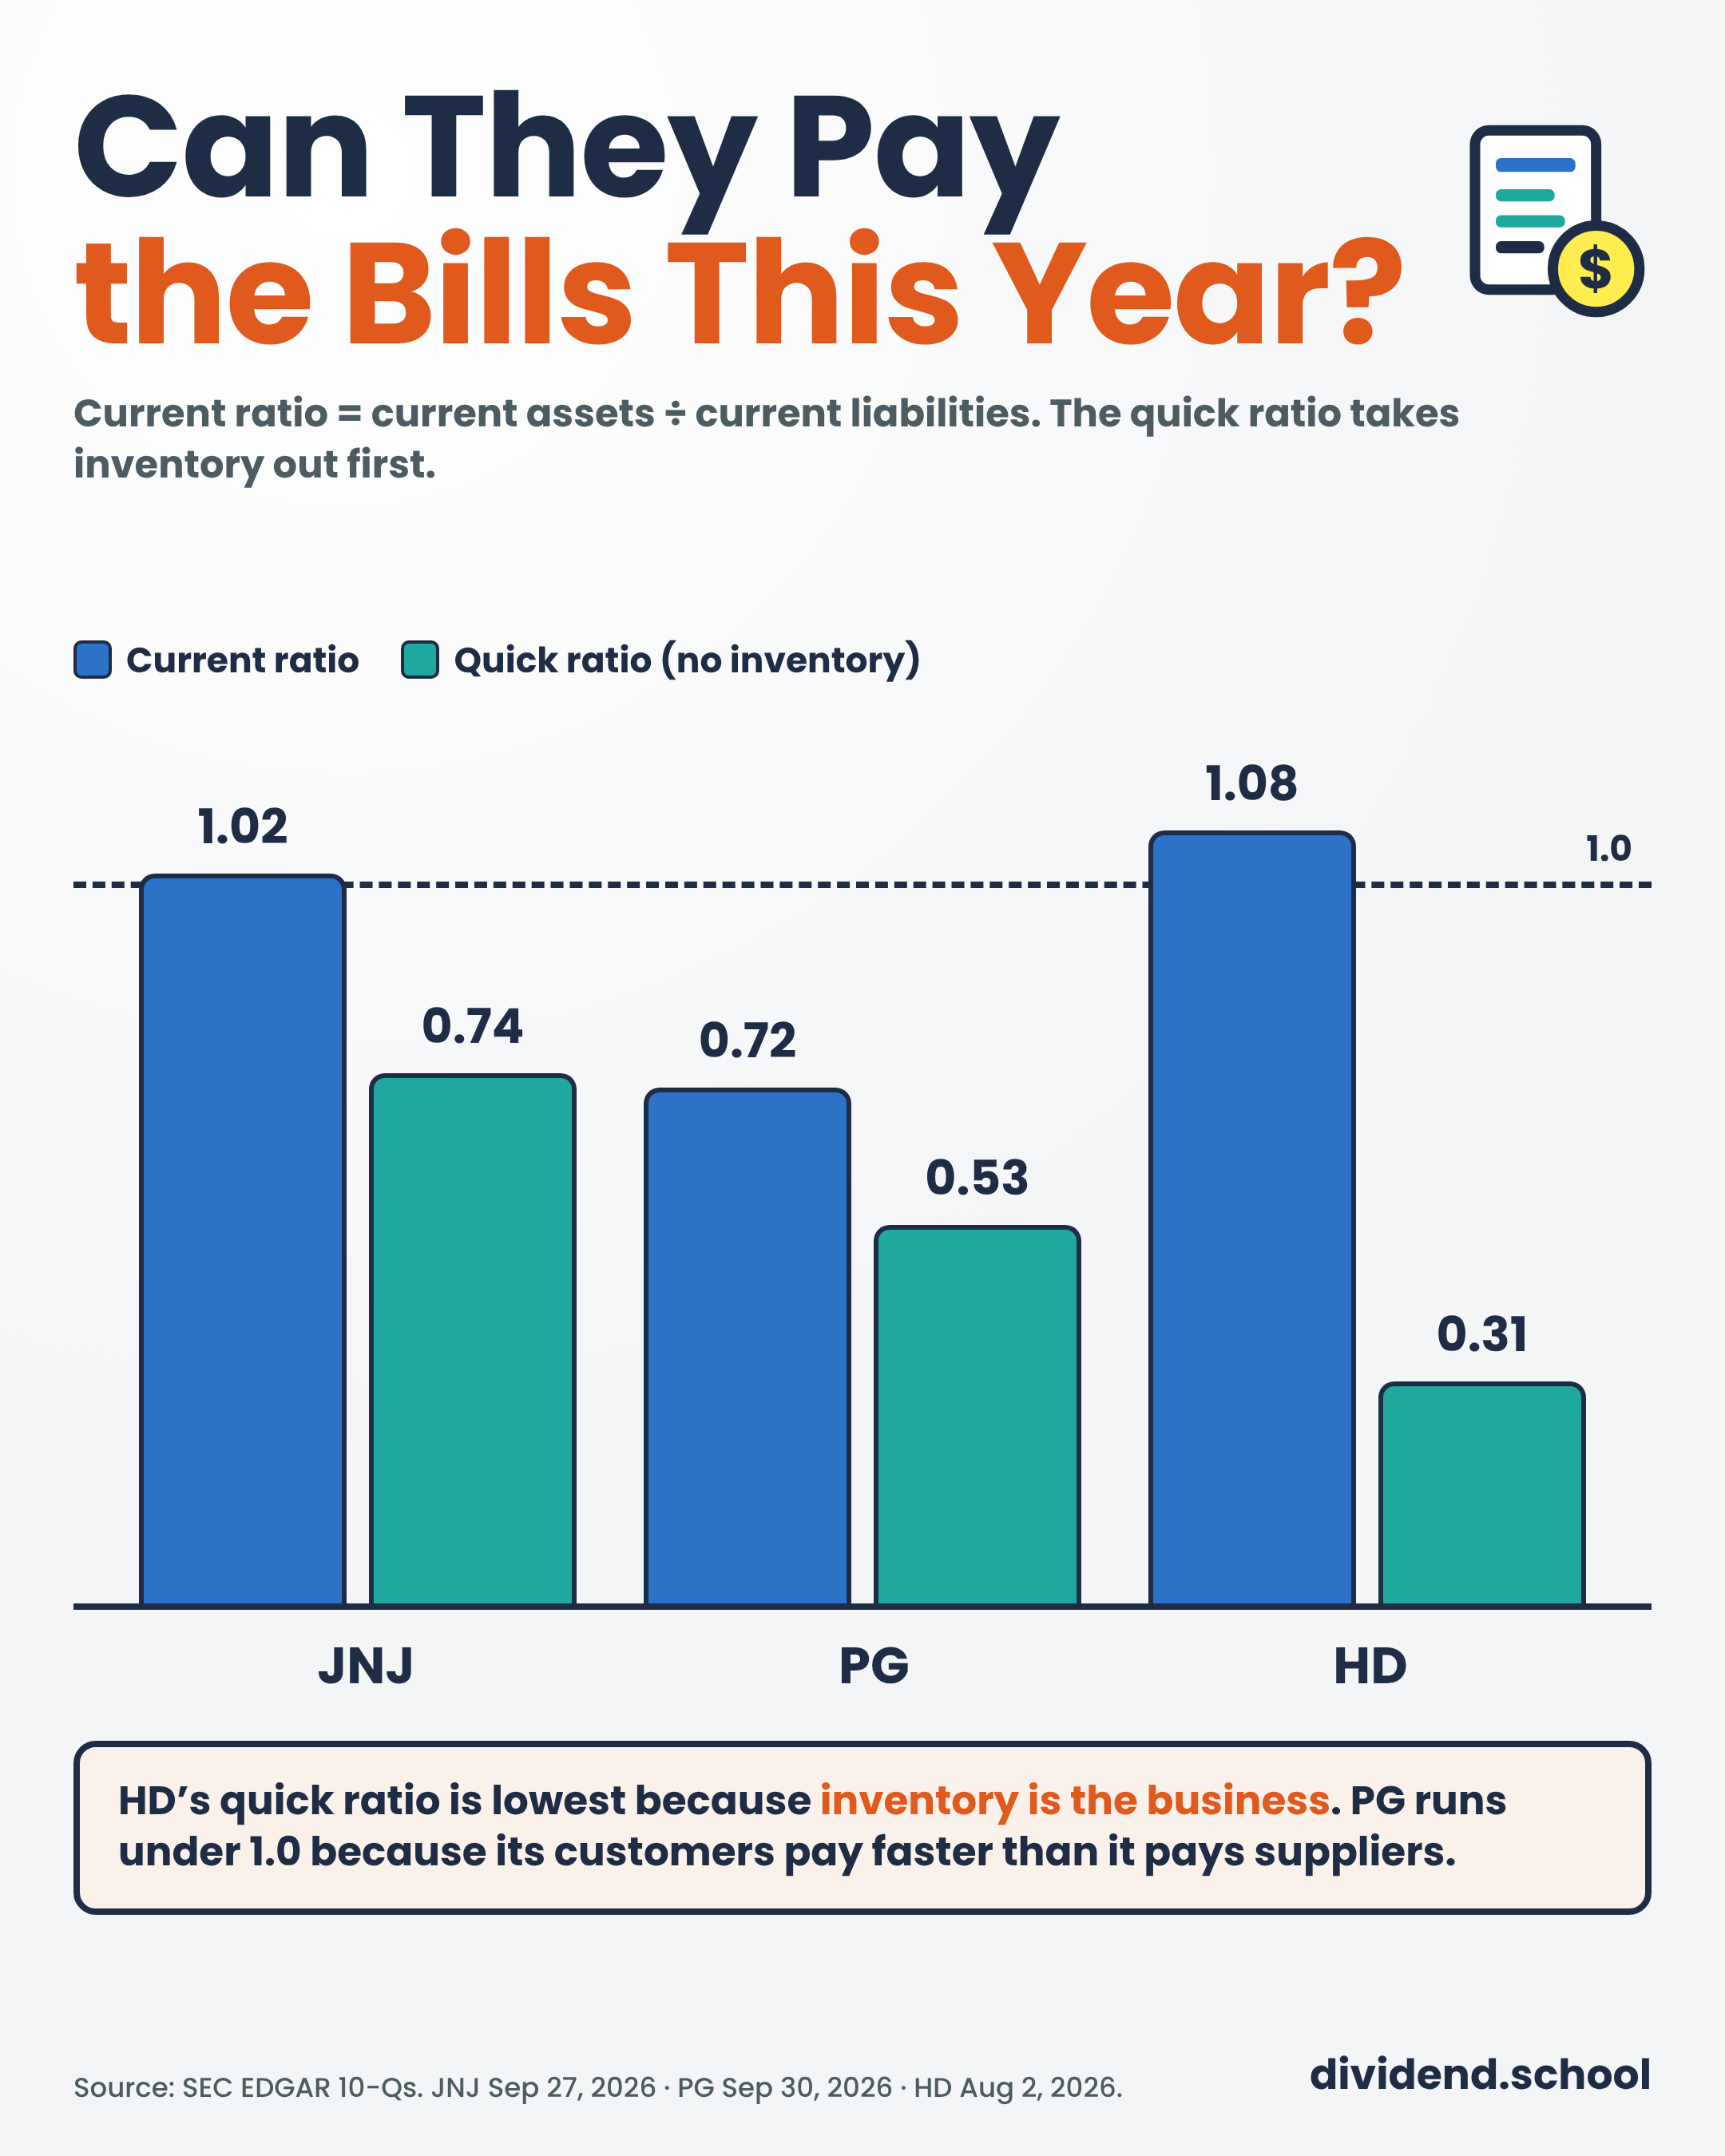
A ratio under 1.0 means the bills due this year are bigger than the assets that turn into cash this year. So is PG in trouble?
No. PG has $17.1 billion of accounts payable against $6.6 billion of receivables. In plain English, PG’s customers pay PG faster than PG pays its suppliers. When you sell Tide and Pampers to Walmart and Costco, you have the muscle to set the payment terms. That is a sign of strength.
The quick ratio removes inventory, because inventory has to be sold before it becomes cash.
JNJ: 0.74
PG: 0.53
HD: 0.31
HD’s quick ratio is the lowest by a mile ($37,720 million of current assets - $26,847 million of inventory, divided by $34,988 million of current liabilities). For a retailer, that’s normal. Inventory is the business. Lumber on the shelf is how Home Depot makes money.
Cash to short-term debt is the third test. It compares cash on hand to the debt due within a year.
JNJ: 1.95 ($17,228 million of cash and marketable securities / $8,852 million of short-term debt)
PG: 0.90
HD: 0.23
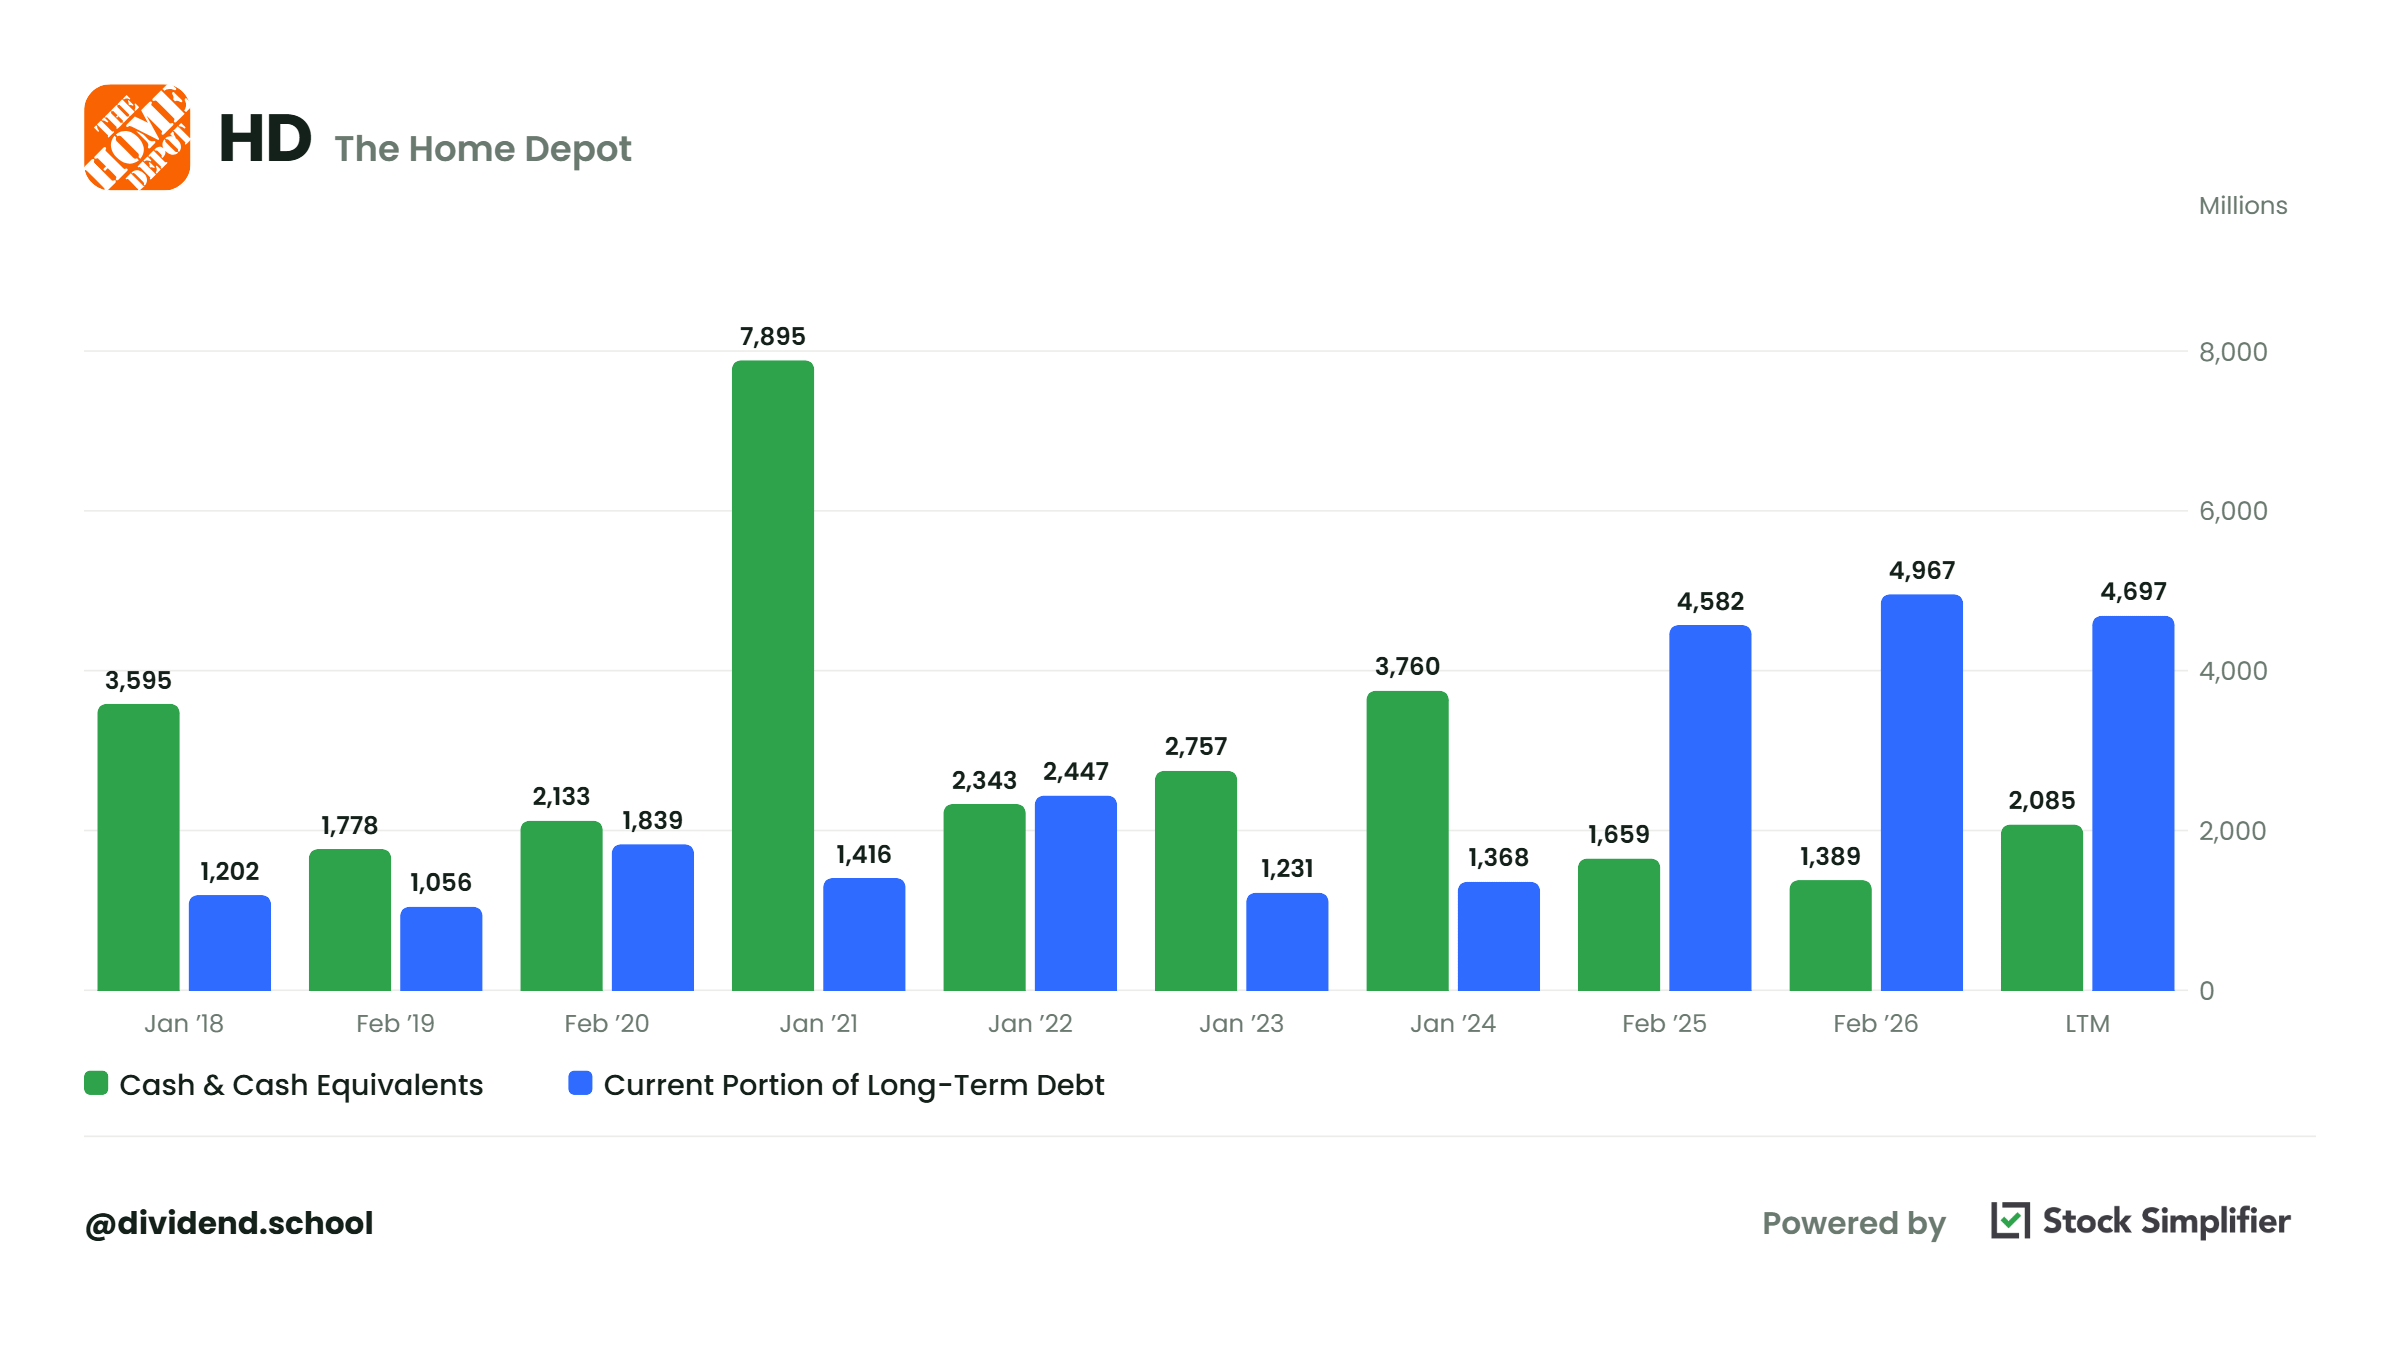
JNJ could pay off every dollar of short-term debt and still have $8.4 billion of cash left. PG’s debt due within one year jumped from $11.3 billion in June to $17.0 billion in September, while cash rose from $9.9 billion to $15.4 billion in the same quarter. HD has $2.1 billion of cash against $8.9 billion of short-term debt and current installments of long-term debt, so it leans on rolling that debt over.
Is HD’s 0.23 a red flag?
Not by itself. Companies with steady cash flow refinance short-term debt all the time. It does mean HD needs the credit markets open.
JNJ is in our Dividend Universe, and Pro members see its Buy Below and every update to it.
Check #2: How Much Debt Is Too Much?
This is where most dividend cuts start. A company with too much debt has to choose between bondholders and shareholders, and bondholders win every time.
We use three tools:
Debt-to-equity
Net debt to EBITDA
Interest coverage
Debt-to-Equity
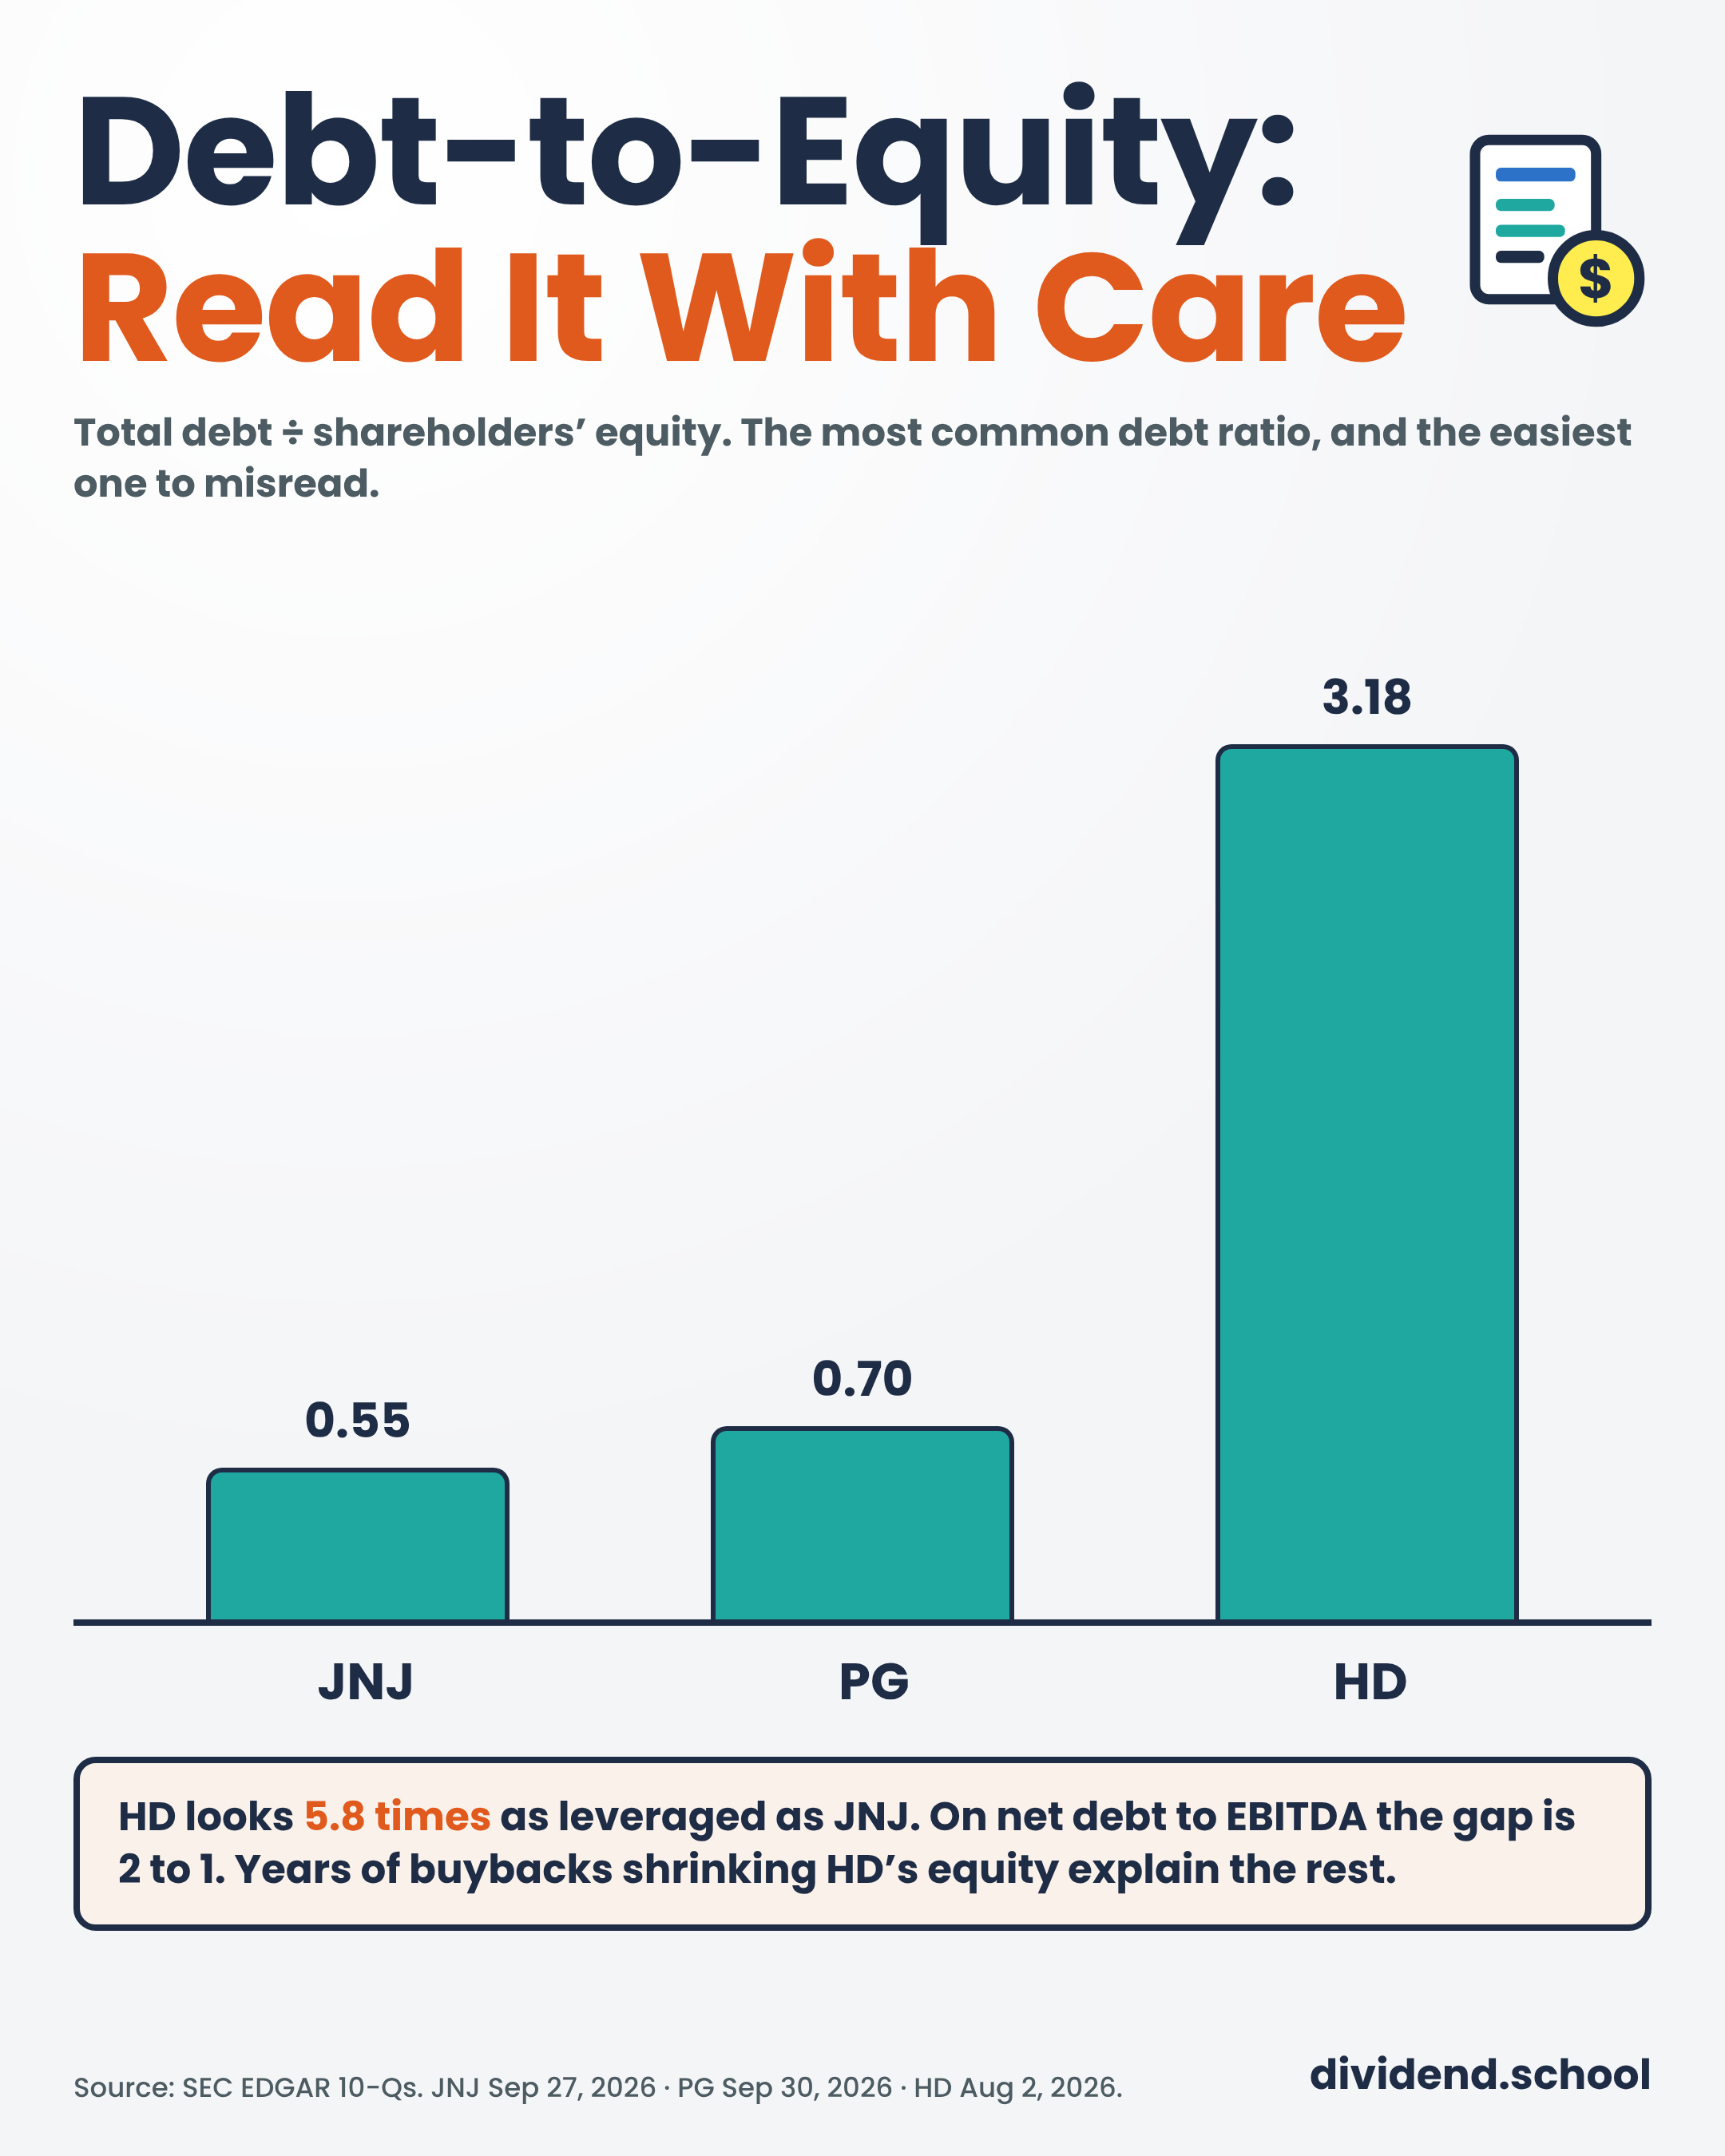
Debt-to-equity is total debt divided by shareholders’ equity. It’s the most common debt ratio, and the one I trust least.
JNJ: 0.55 ($44,651 million of total debt / $81,529 million of equity)
PG: 0.70
HD: 3.18
Taken at face value, HD carries 5.8 times the debt load of JNJ. That isn’t the full story, and Check #4 explains why.
Net Debt to EBITDA
This is what rating agencies and the bond market watch. Net debt is total debt minus cash. EBITDA is earnings before interest, taxes, depreciation, and amortization, the closest thing to a quick read on operating cash earnings.
The ratio asks: how many years of earnings would it take to pay off the debt?
HD’s net debt is $50,811 million ($52,896 million of debt - $2,085 million of cash). Divide by $24,655 million of trailing twelve-month EBITDA, and we get 2.06.
JNJ: 1.02
PG: 1.02
HD: 2.06
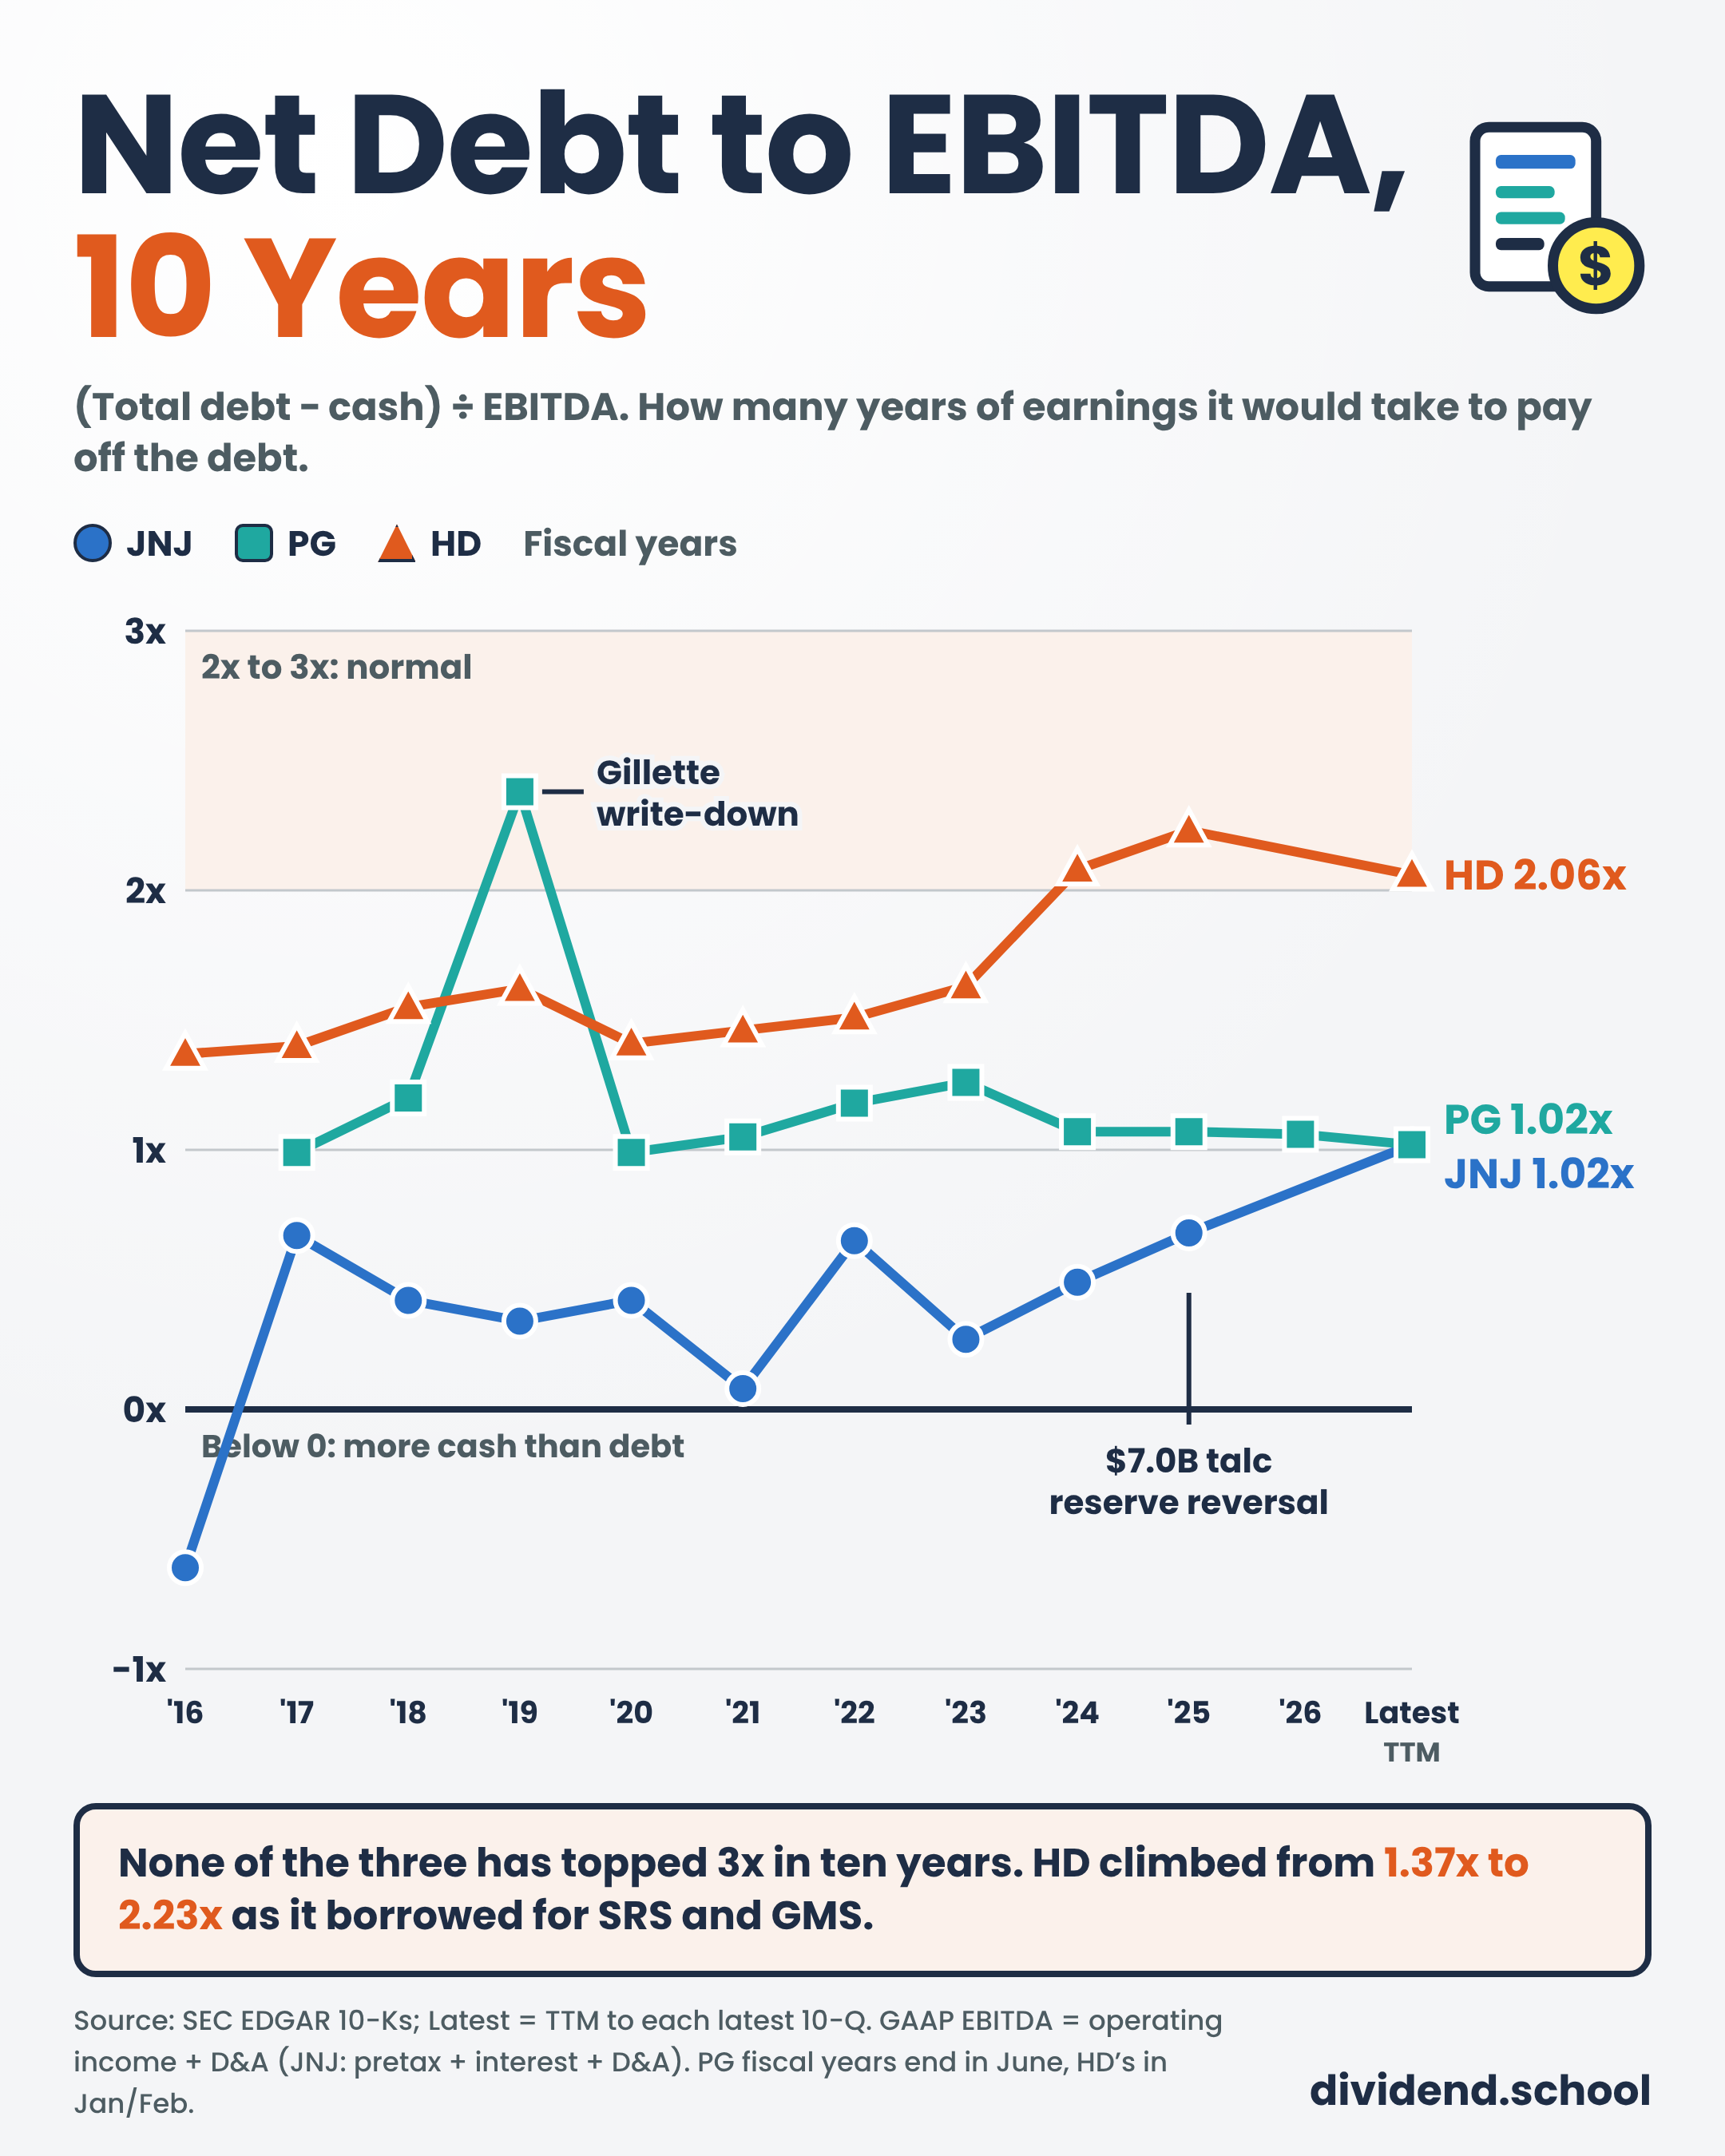
A quick note on JNJ. Its trailing EBITDA includes a $5.5 billion charge for the proposed talc ovarian litigation settlement, booked in the third quarter. Take that charge out, and the ratio drops to 0.85. Either way, JNJ’s debt load is light.
Under 2 is conservative for a steady business. 2 to 3 is normal. Above 3, I start asking harder questions, especially of a company that has been buying other businesses.
Interest Coverage
Interest coverage divides operating income by interest expense. It tells us how many times over the company can pay its interest bill.
PG covers its interest 22.0 times ($19,829 million of trailing operating income / $903 million of interest expense).
JNJ: 19.0
PG: 22.0
HD: 8.7
JNJ doesn’t report an operating income line, so we use pretax earnings plus interest expense to get there.
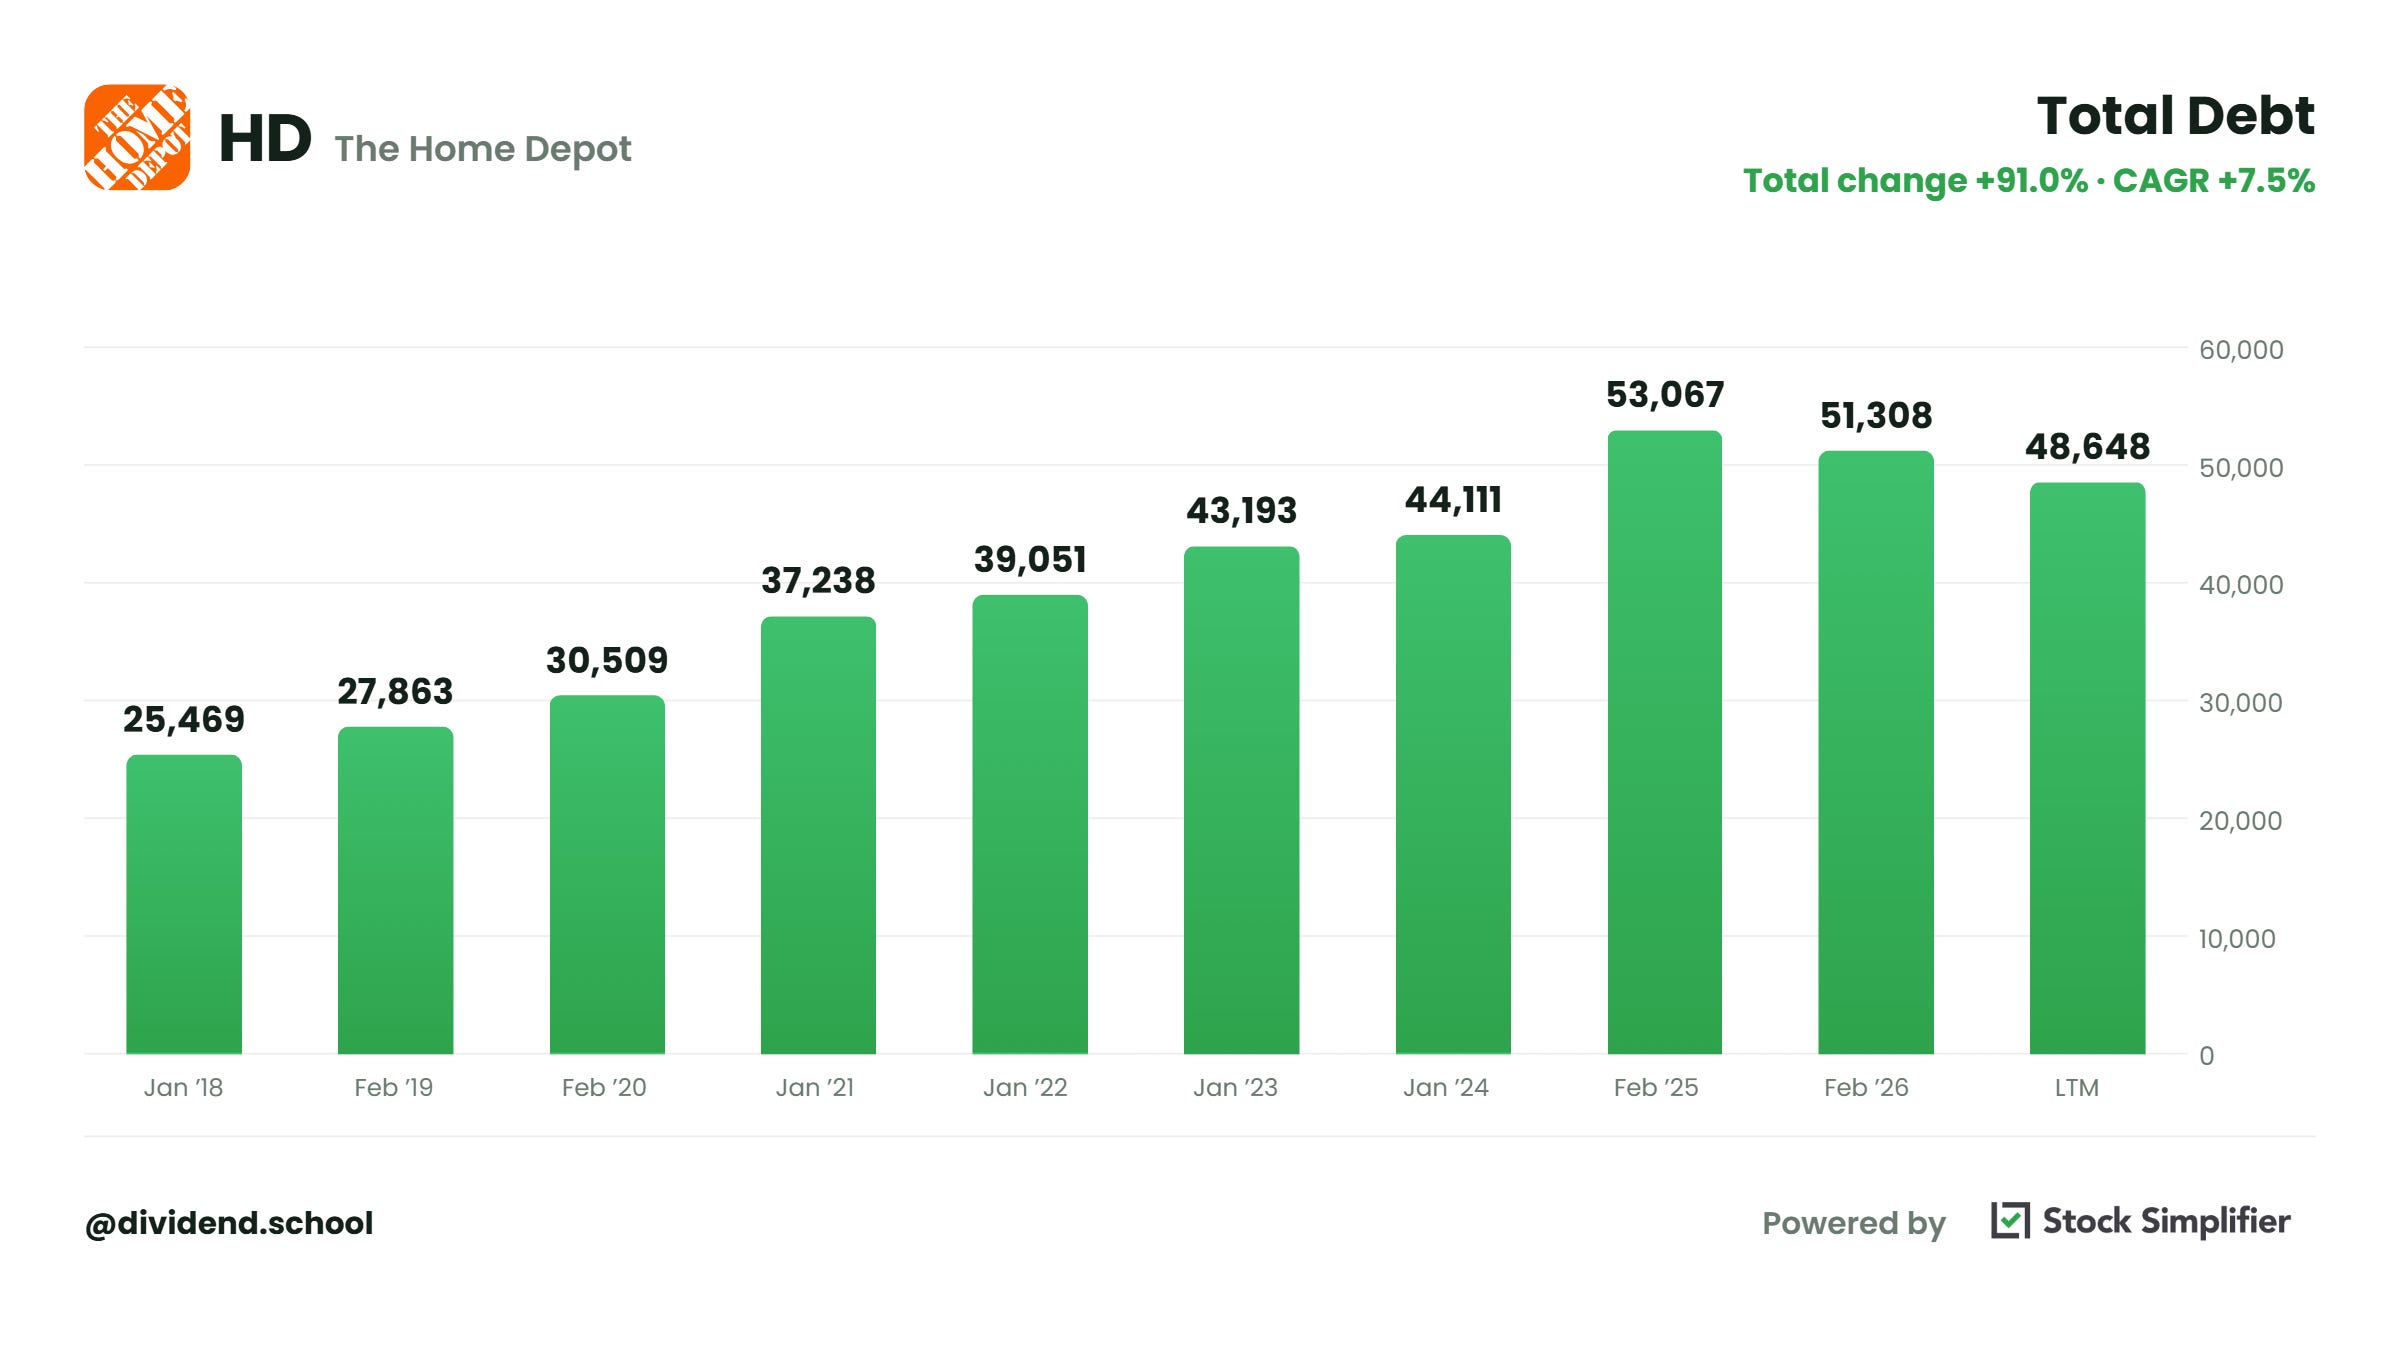
HD at 8.7 times is the lowest of the three, and still comfortable. Its interest bill rose from $1.9 billion in fiscal 2023 to $2.4 billion in fiscal 2025, as long-term debt climbed with the SRS purchase in 2024. Since then HD has added GMS for $5.1 billion in September 2025 and Mingledorff’s for $1.1 billion in May 2026.
What does this tell us?
All three can carry their debt. HD carries the most, and it carries it on purpose to fund acquisitions.
Check #3: What Are the Assets Worth?
Not every asset on the balance sheet can be sold for cash. Two of the biggest lines for these three companies are goodwill and intangible assets.
Goodwill is what a company paid for an acquisition above the value of the assets it bought. Intangibles include brand names, patents, and customer lists.
Here is the share of total assets in goodwill and intangibles:
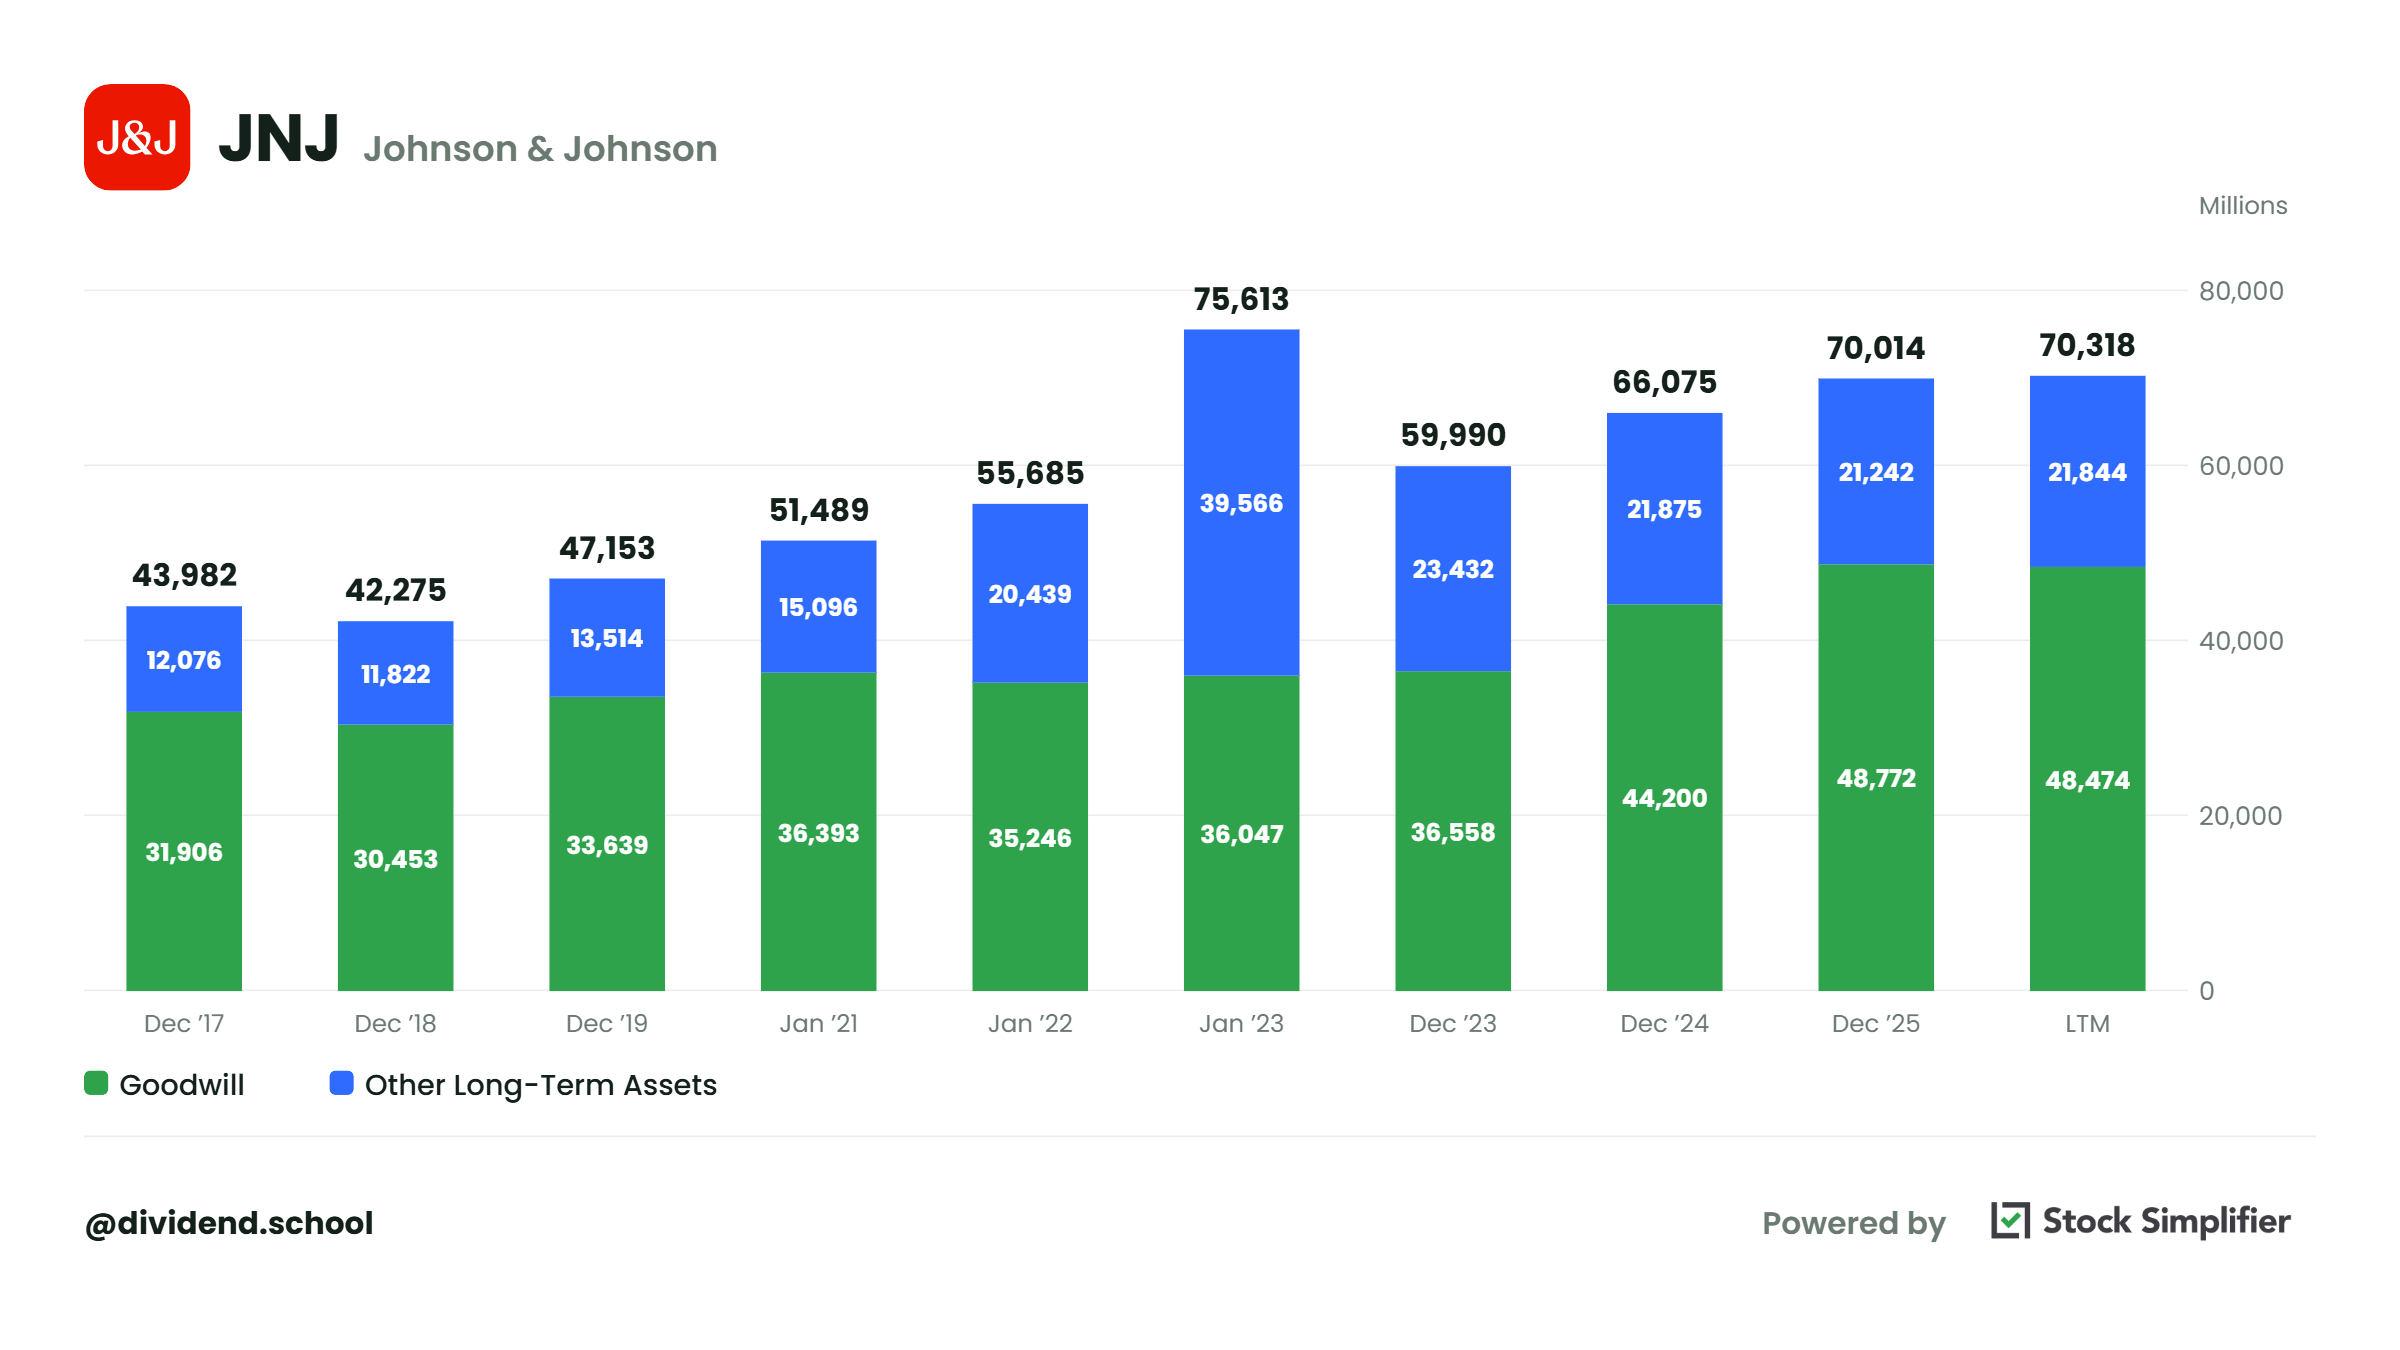
JNJ: 48.2% ($95,126 million / $197,425 million of total assets)
PG: 47.0%
HD: 30.5%
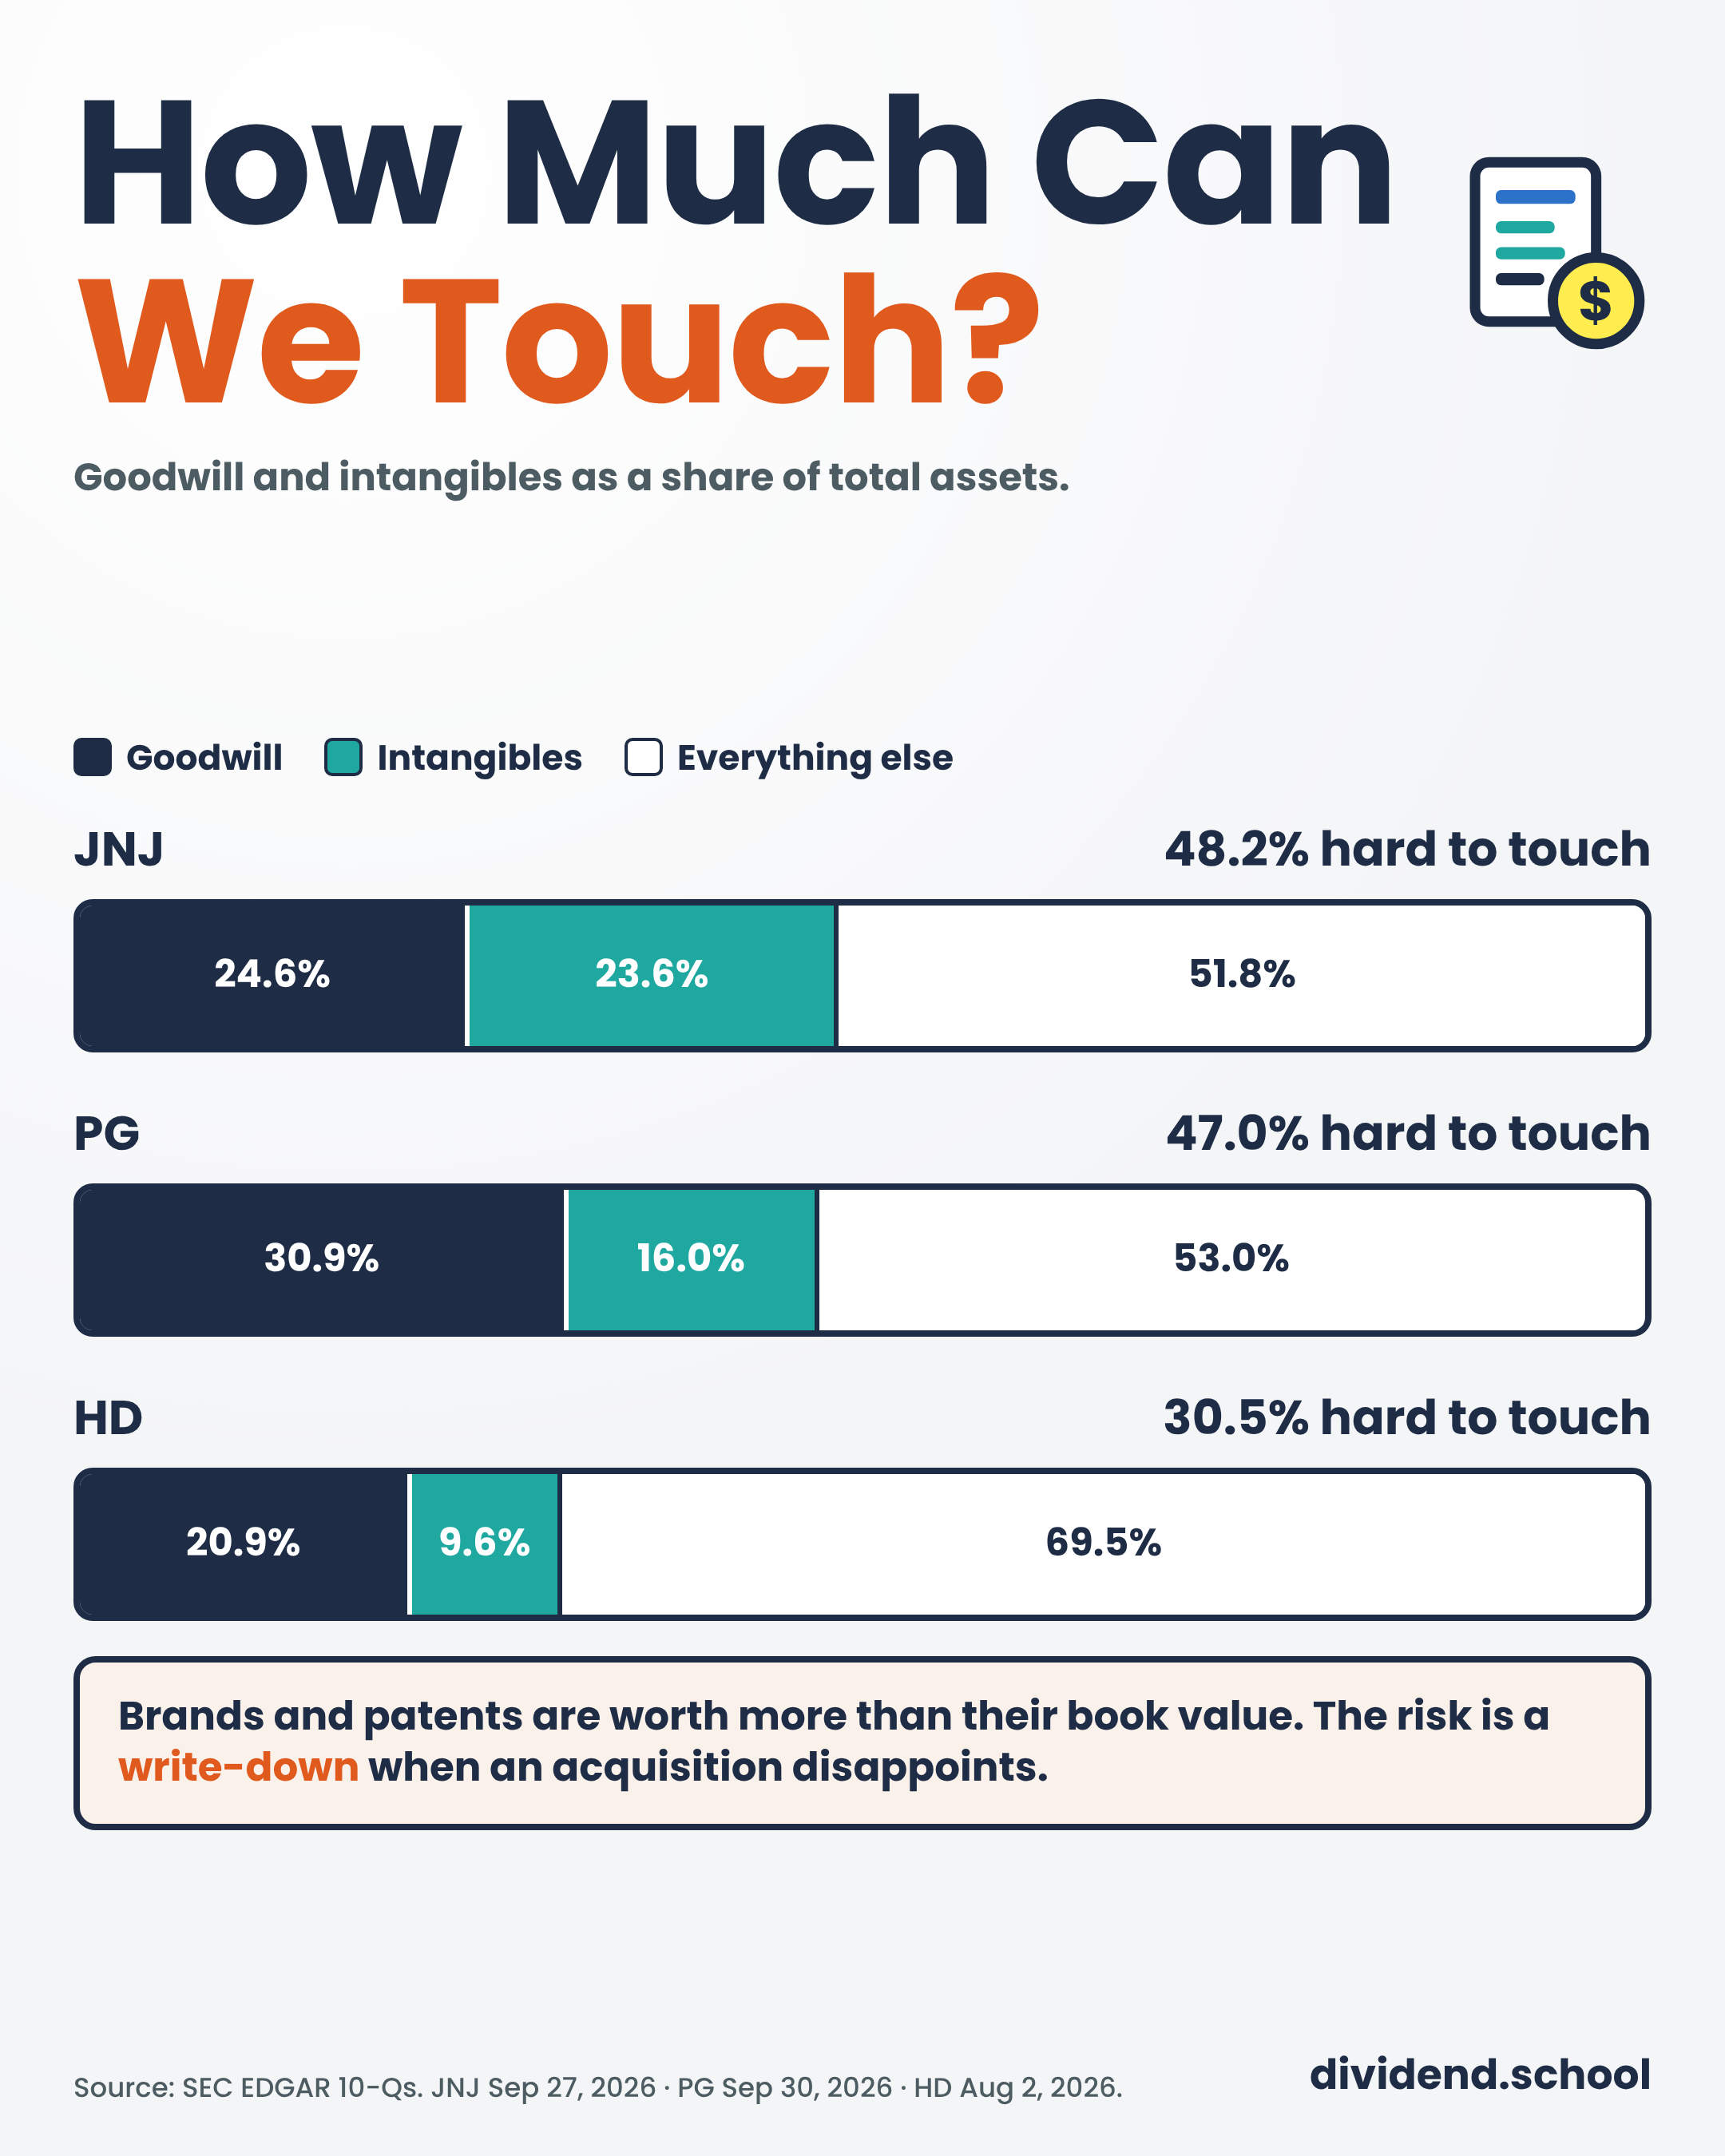
Nearly half of JNJ’s and PG’s assets are things we can’t touch. Subtract goodwill and intangibles from equity and we get tangible equity, and all three come out negative:
JNJ: negative $13.6 billion
PG: negative $7.2 billion
HD: negative $16.8 billion
Should that scare us?
Not on its own. Tide, Gillette, and JNJ’s drug patents are worth far more than their accounting value. Brand-heavy companies often carry negative tangible equity.
The risk is the write-down. When an acquisition disappoints, the company impairs the goodwill or intangible and equity shrinks overnight. JNJ booked a $339 million impairment on in-process research and development in the third quarter. Small for JNJ, but the line moves.
When goodwill grows quickly, the company has been buying growth. JNJ spent $17.5 billion in 2025 on Intra-Cellular Therapies and Halda Therapeutics.
Check #4: What the Equity Section Says About Buybacks
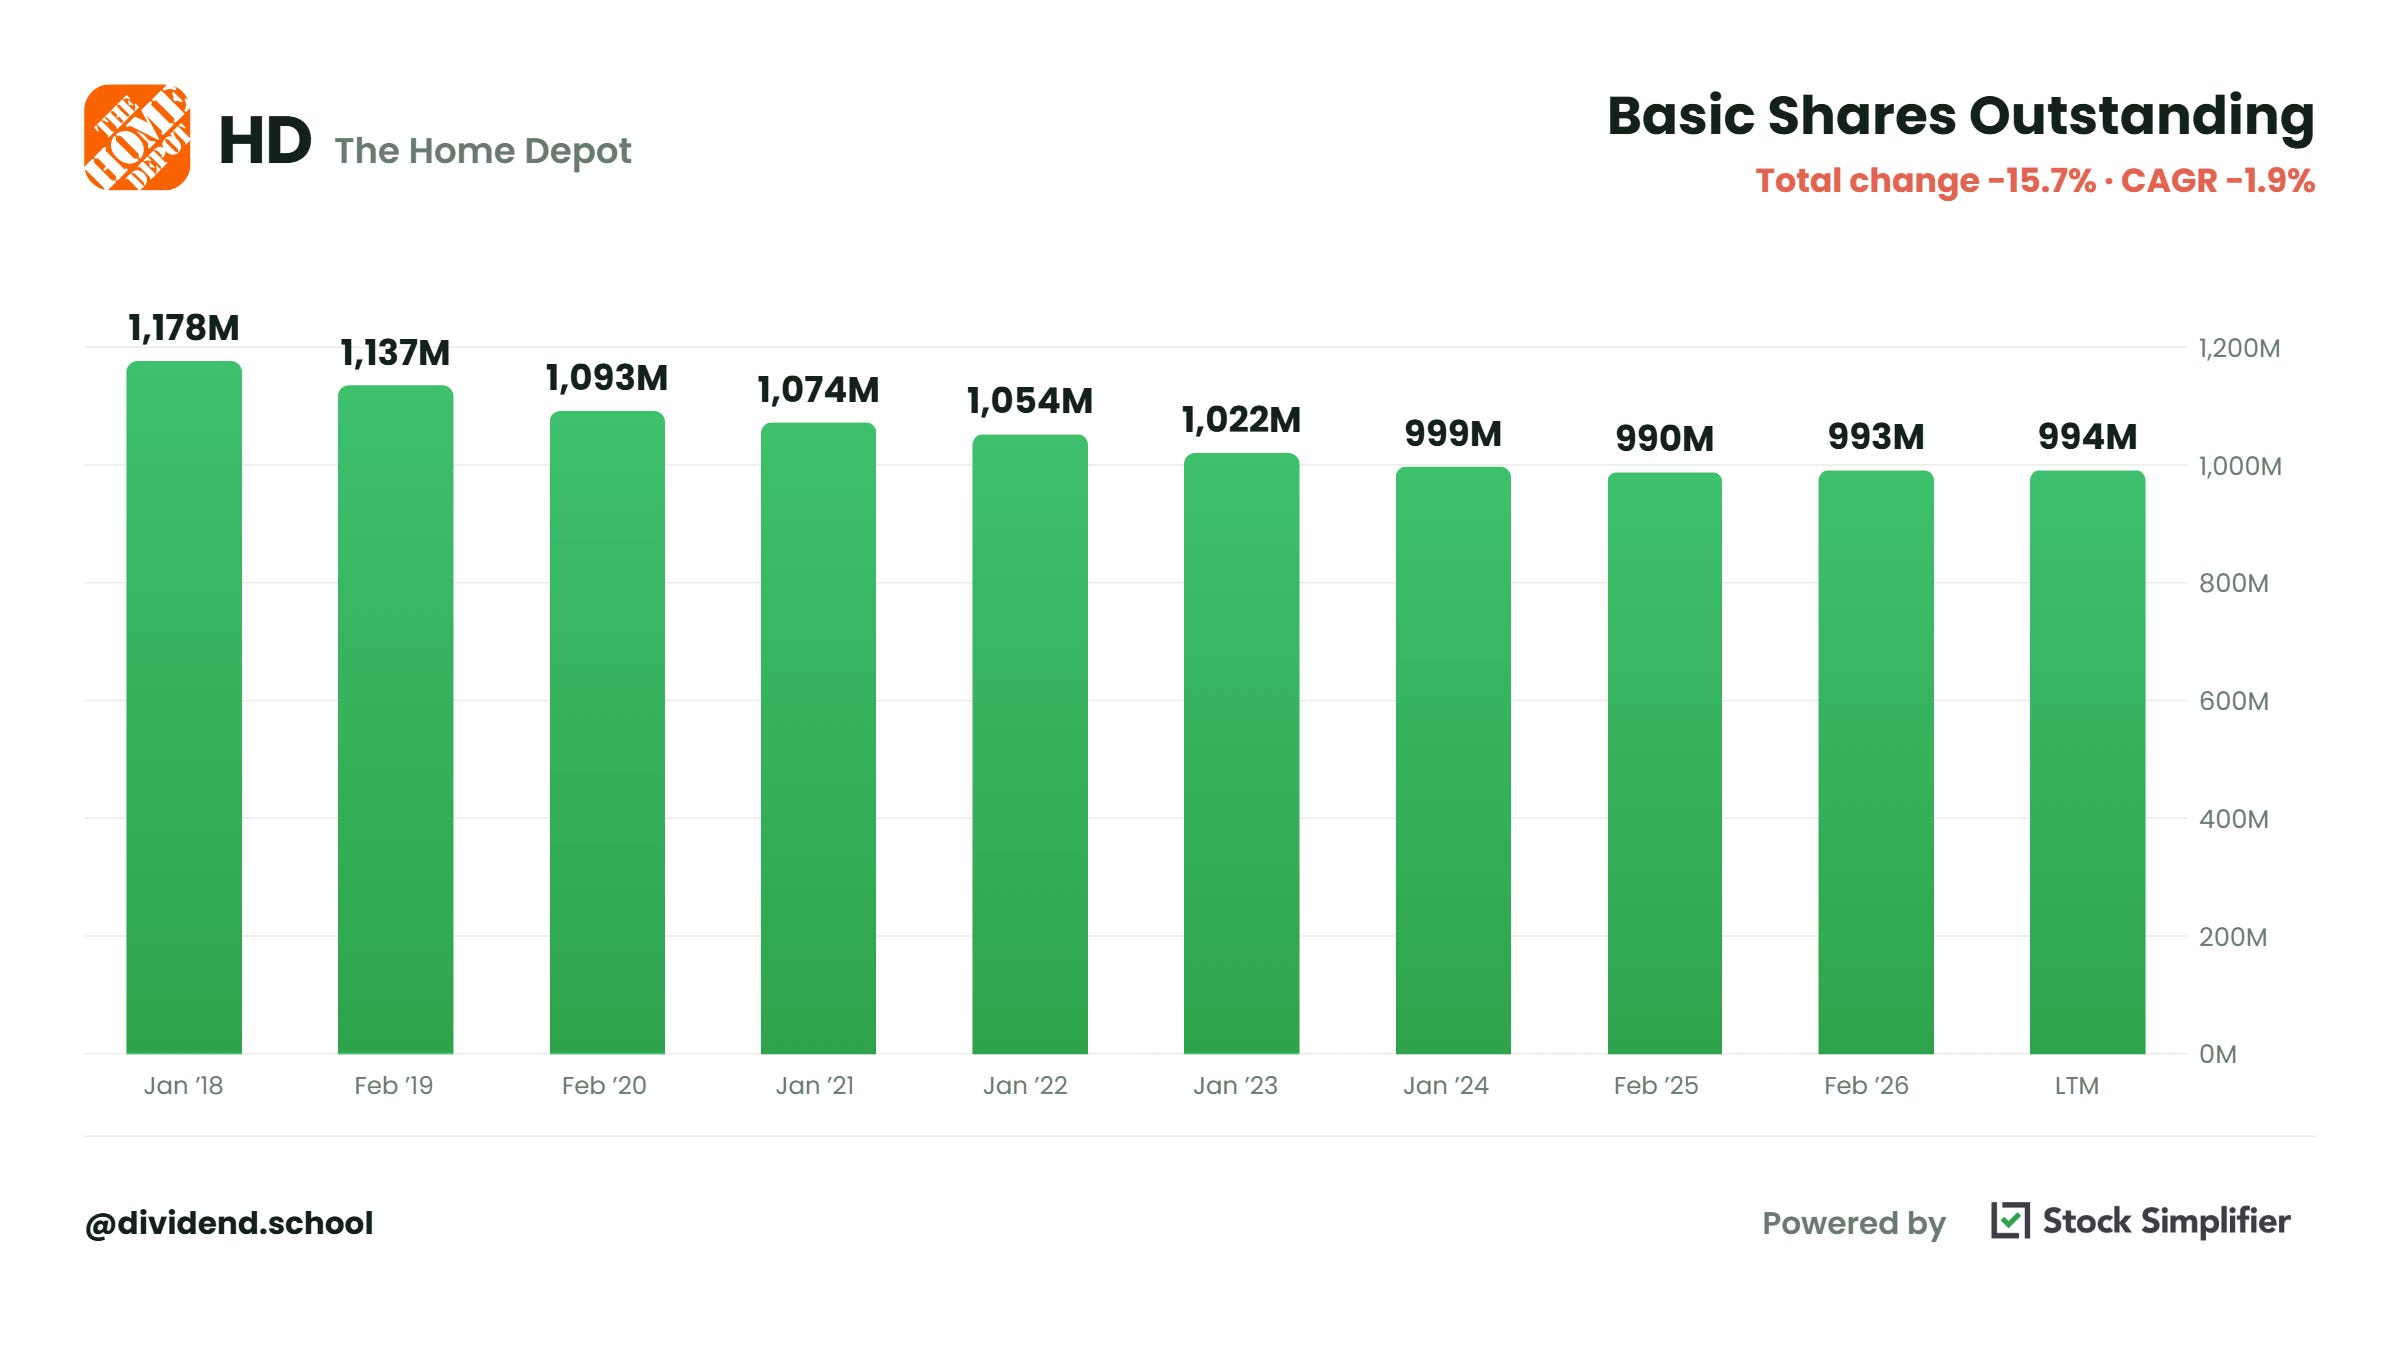
Remember HD’s 3.18 debt-to-equity? Buybacks are behind most of it.
When a company buys back its own stock, the cost shows up in the equity section as treasury stock and is subtracted from equity. Decades of buybacks can shrink equity to almost nothing, which makes debt-to-equity look terrible even when the debt is fine.
Compare the treasury stock line to retained earnings:
JNJ: $76.2 billion of treasury stock vs $168.4 billion of retained earnings and paid-in capital
PG: $144.2 billion vs $138.0 billion
HD: $96.0 billion vs $97.9 billion
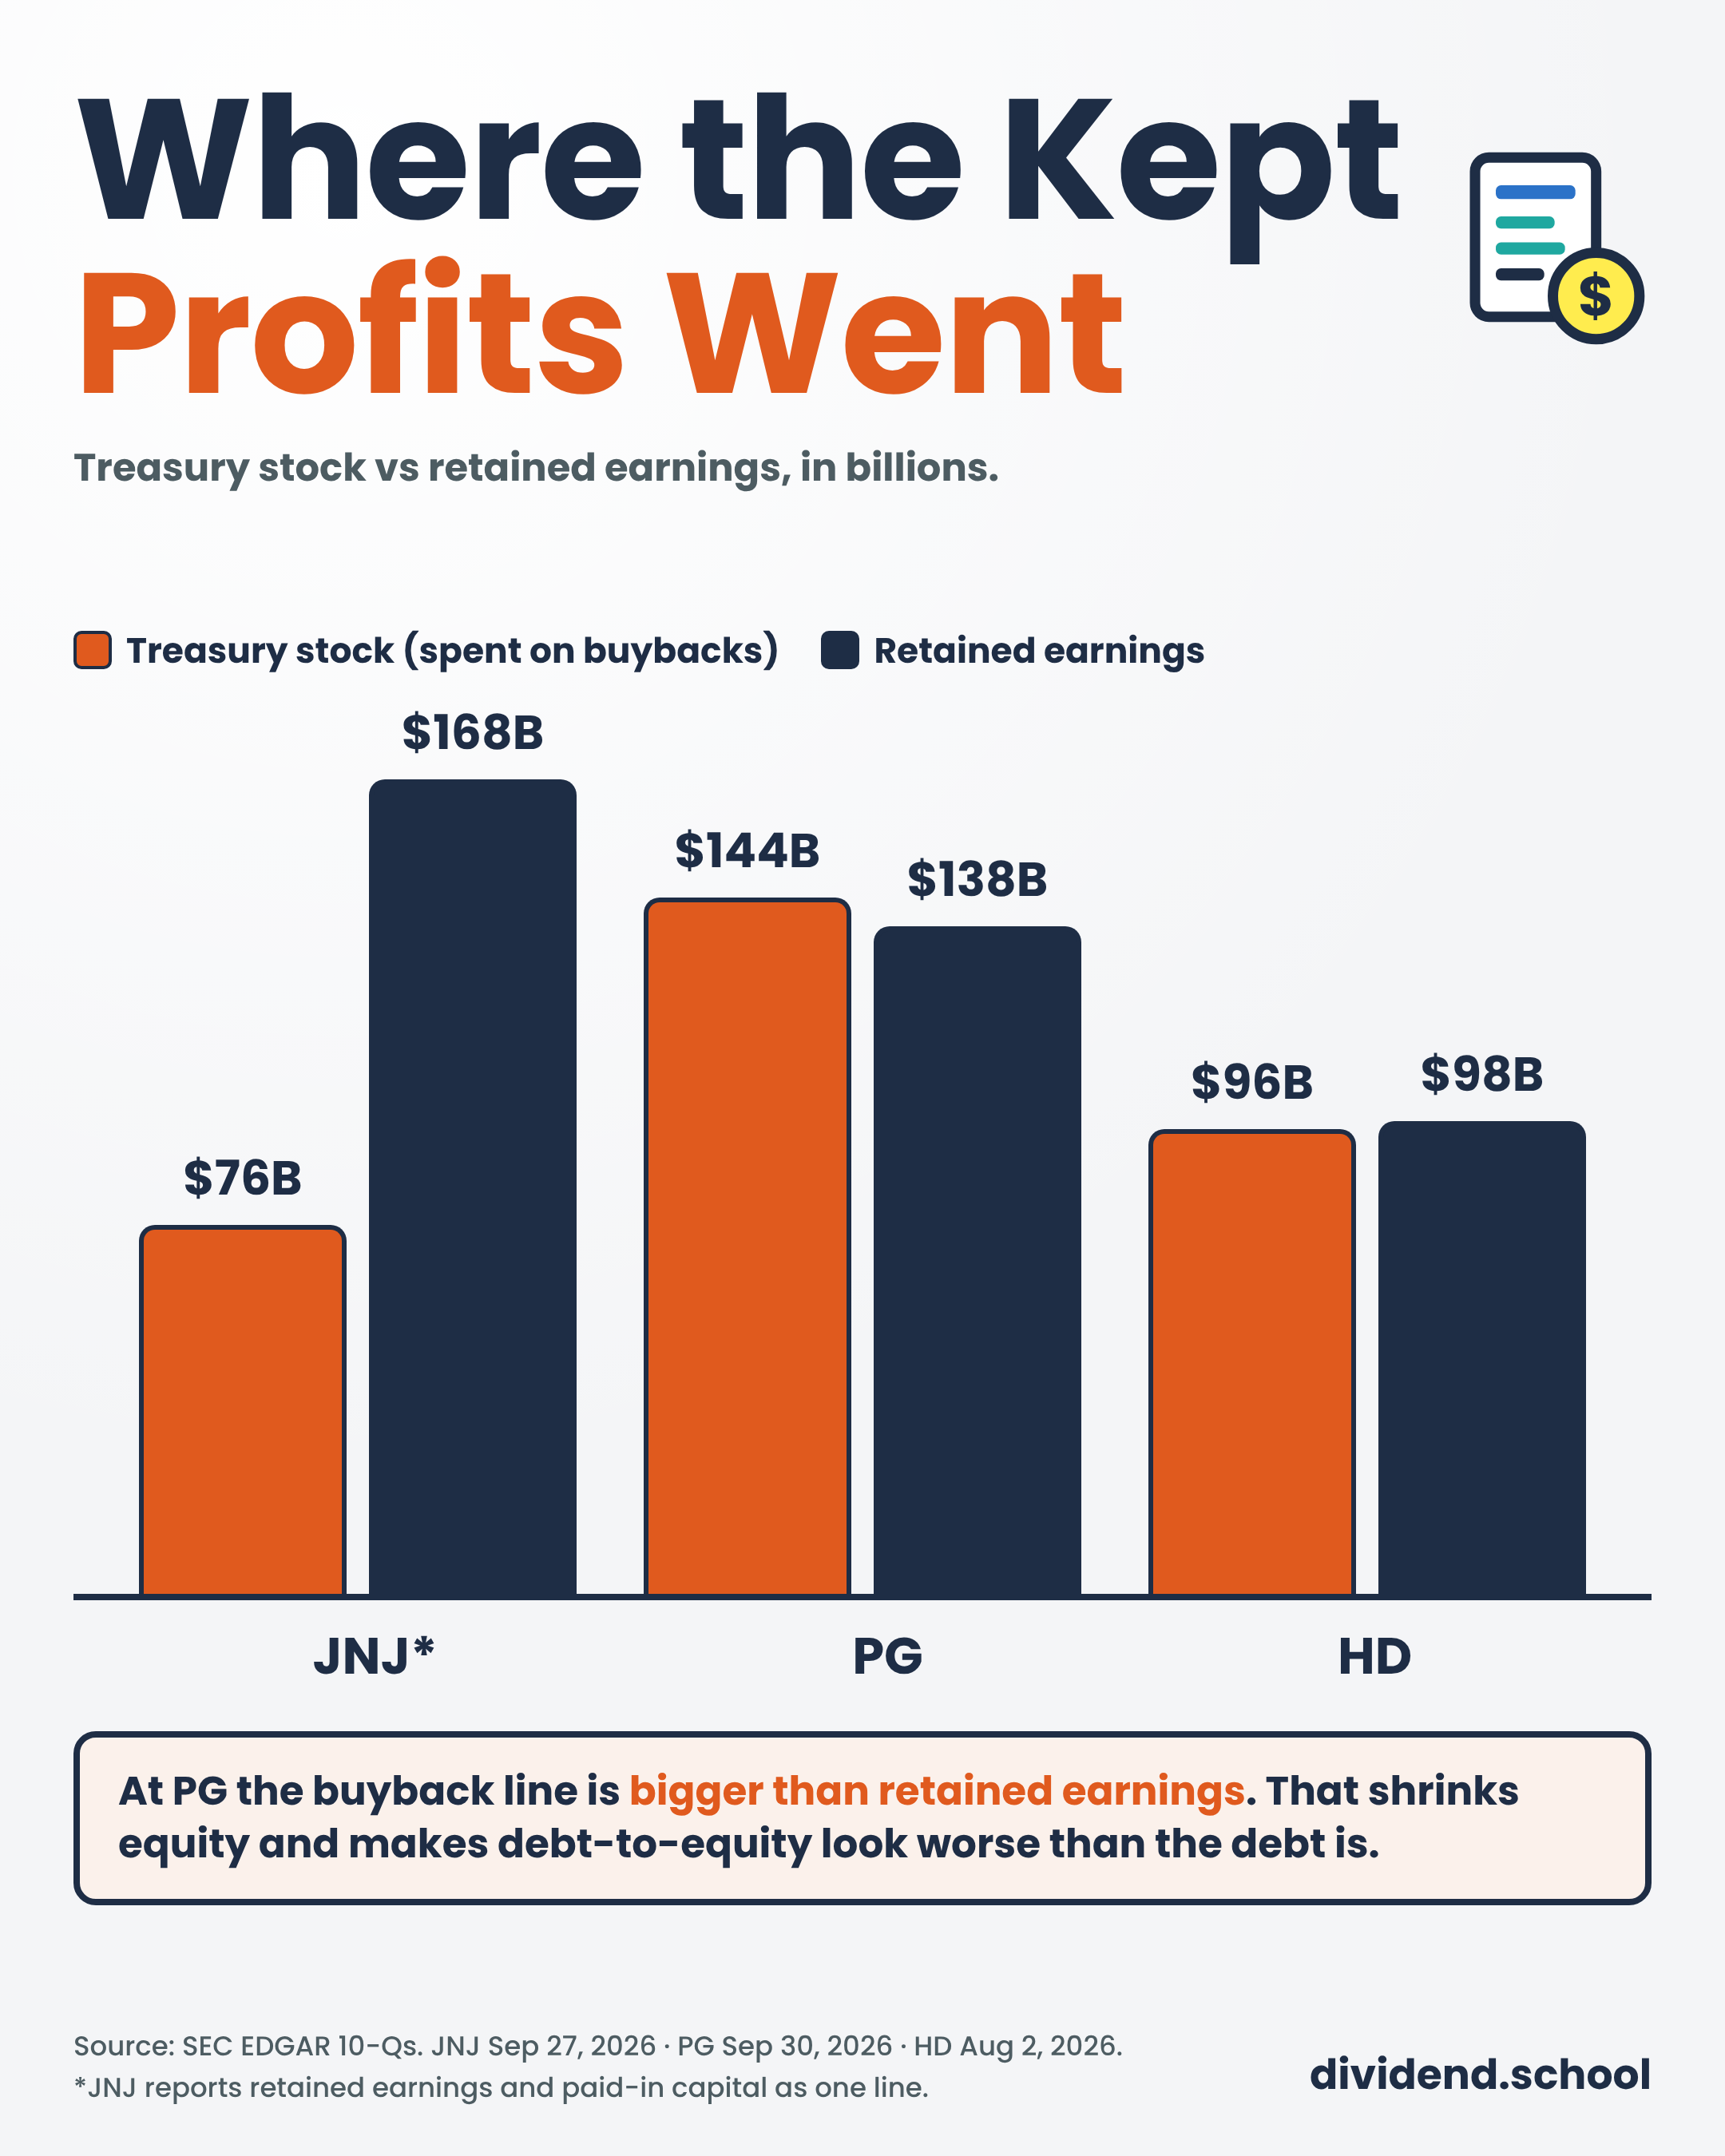
PG’s treasury stock line is bigger than everything it has kept in retained earnings. HD is right behind it. That is why HD’s equity is only $16.6 billion against $52.9 billion of debt, and why its debt-to-equity looks scary while its net debt to EBITDA sits at 2.06.
Fun fact: HD paused buybacks in March 2024 and had not restarted as of August 2, 2026. With no buybacks, equity climbed from $12.8 billion in February to $16.6 billion in August. Same business, same debt, better ratio.
Buybacks and dividends are both ways of returning cash to us. A balance sheet with a big treasury stock line belongs to a company that has been generous with shareholders for a long time, and that’s a trait I want in a dividend stock.
WARNING: never judge a buyback-heavy company by debt-to-equity alone. NEVER. Use net debt to EBITDA and interest coverage.
Check #5: What’s Hiding in the Notes
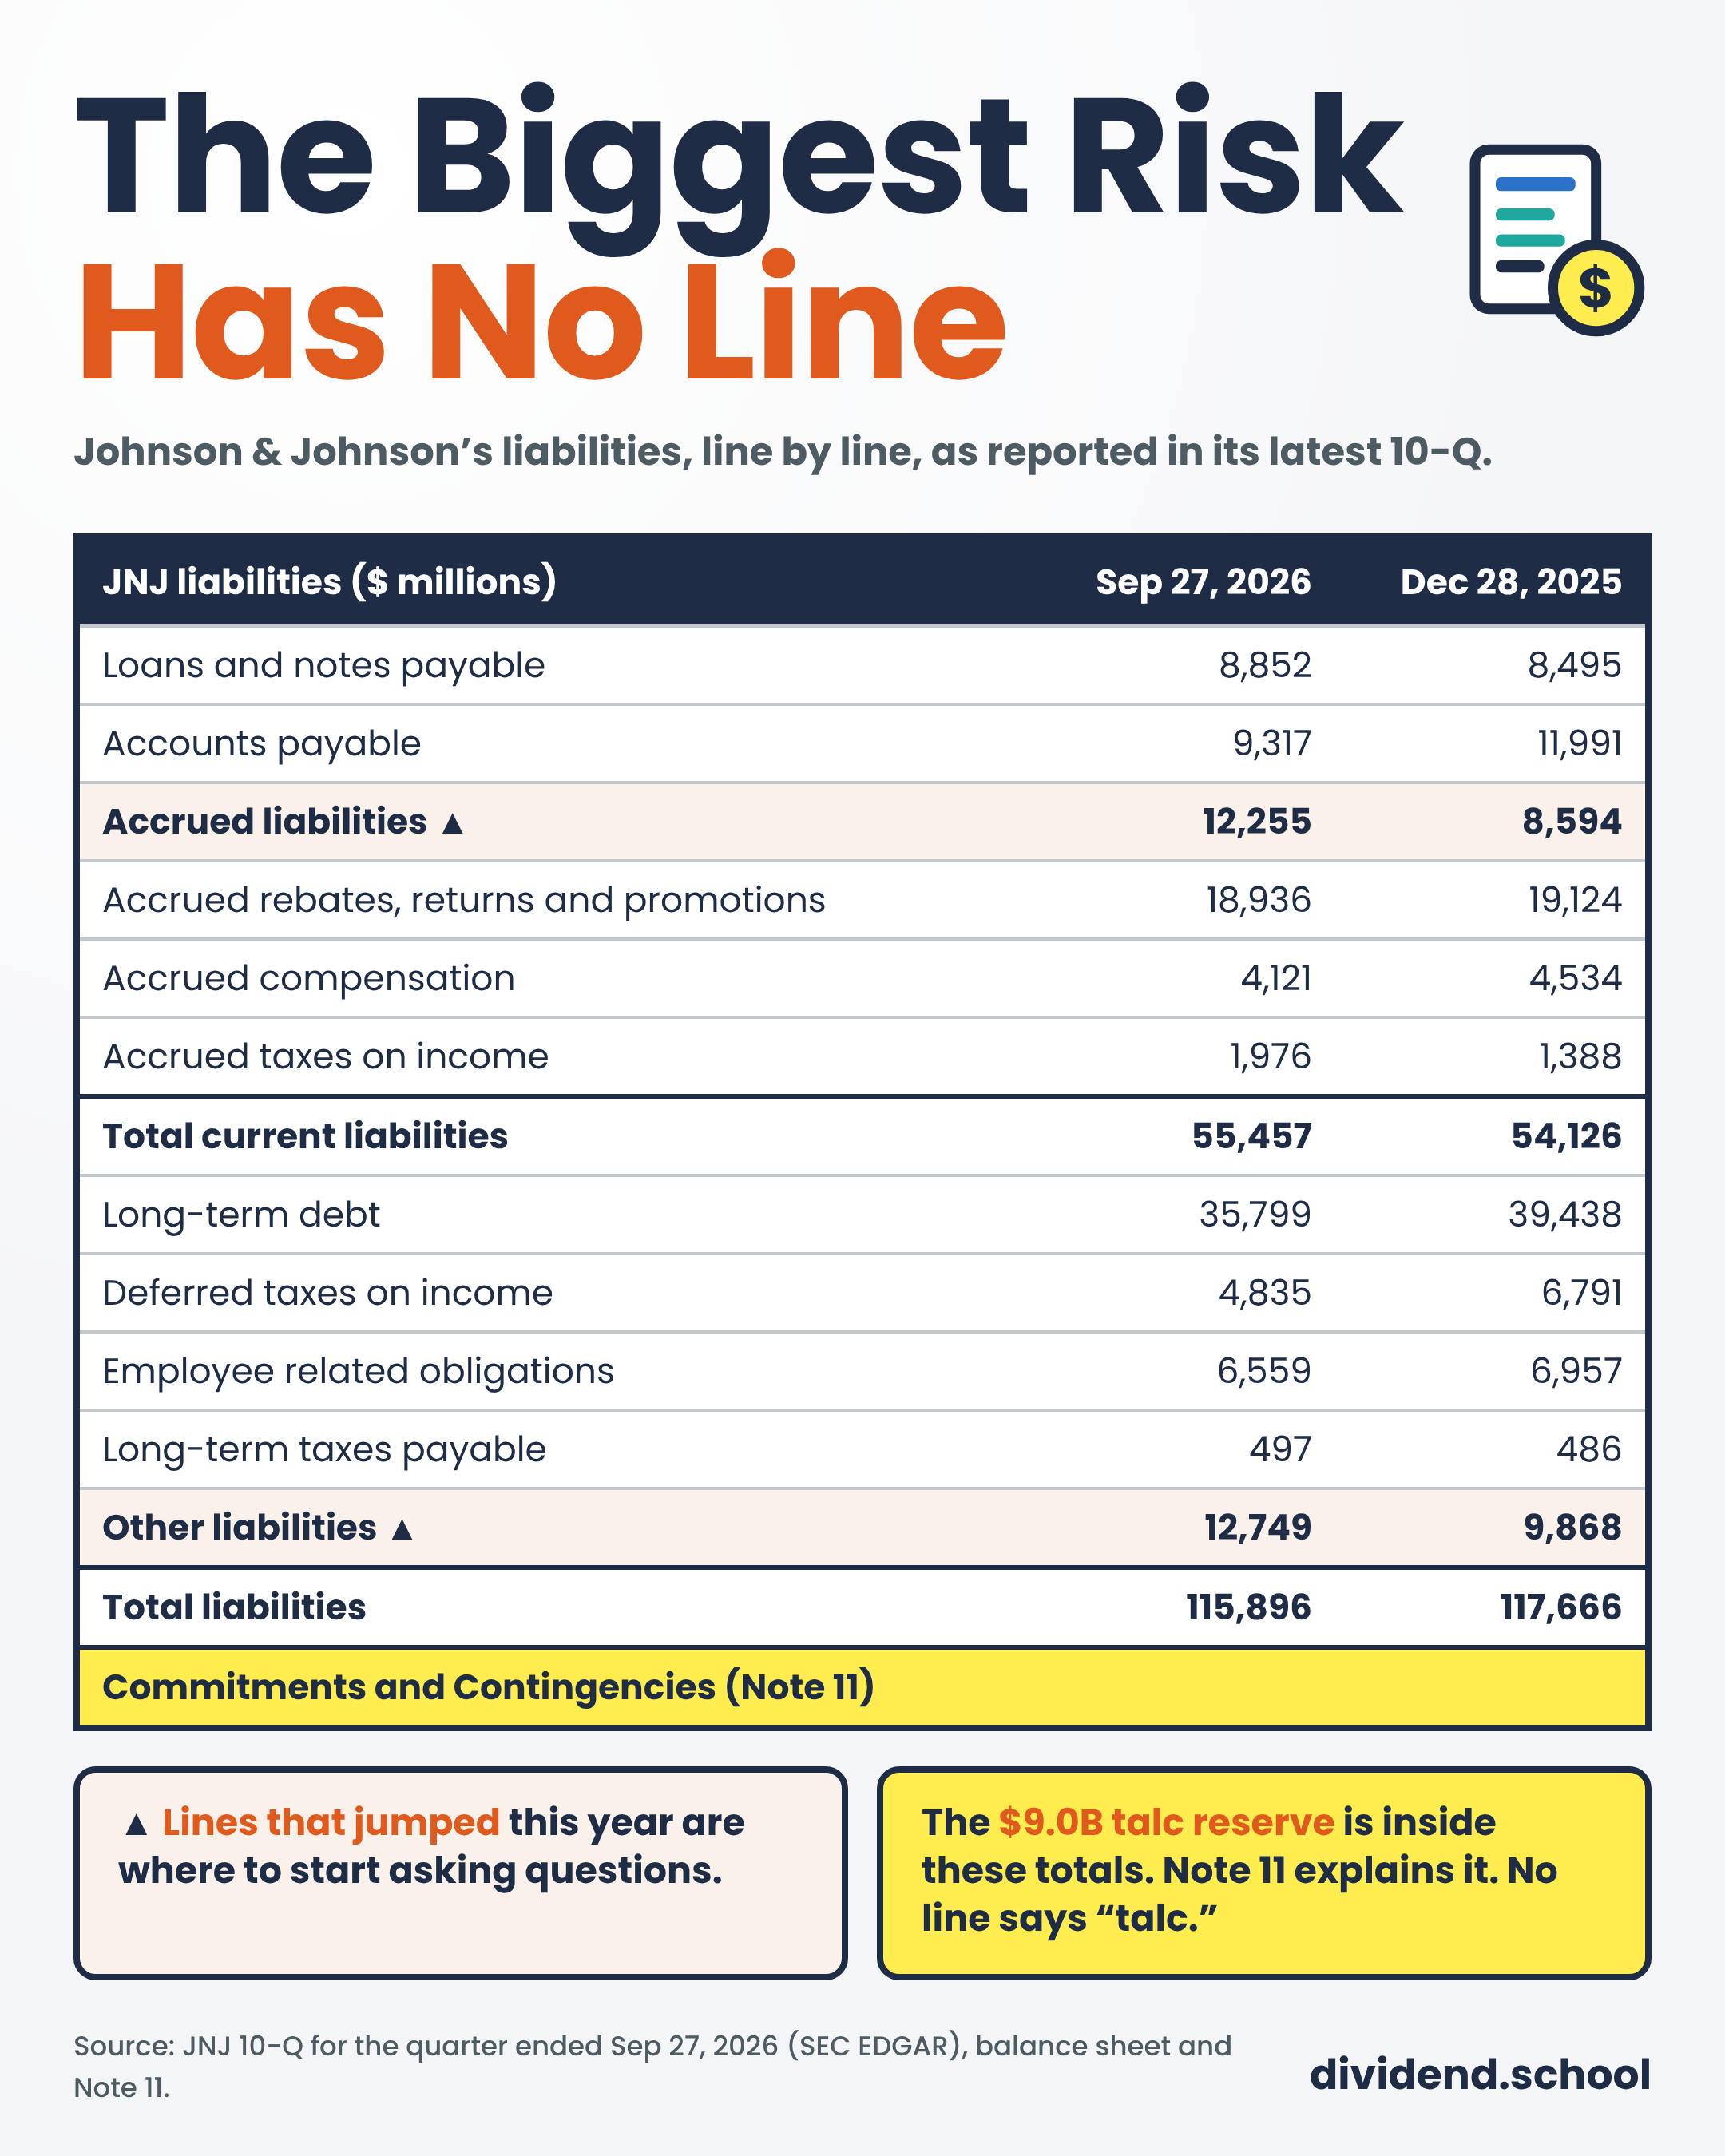
The face of the balance sheet gives us the totals. The notes tell us what is inside them.
The best example is JNJ’s talc litigation.
At September 27, JNJ carried a $5.5 billion accrual for the proposed resolution of its talc ovarian litigation. The 10-Q puts the count at 76,500 plaintiffs with pending lawsuits. On the face of the balance sheet, no line is labeled “talc.”
You find it in the commitments and contingencies note.
Three notes I read on every dividend stock:
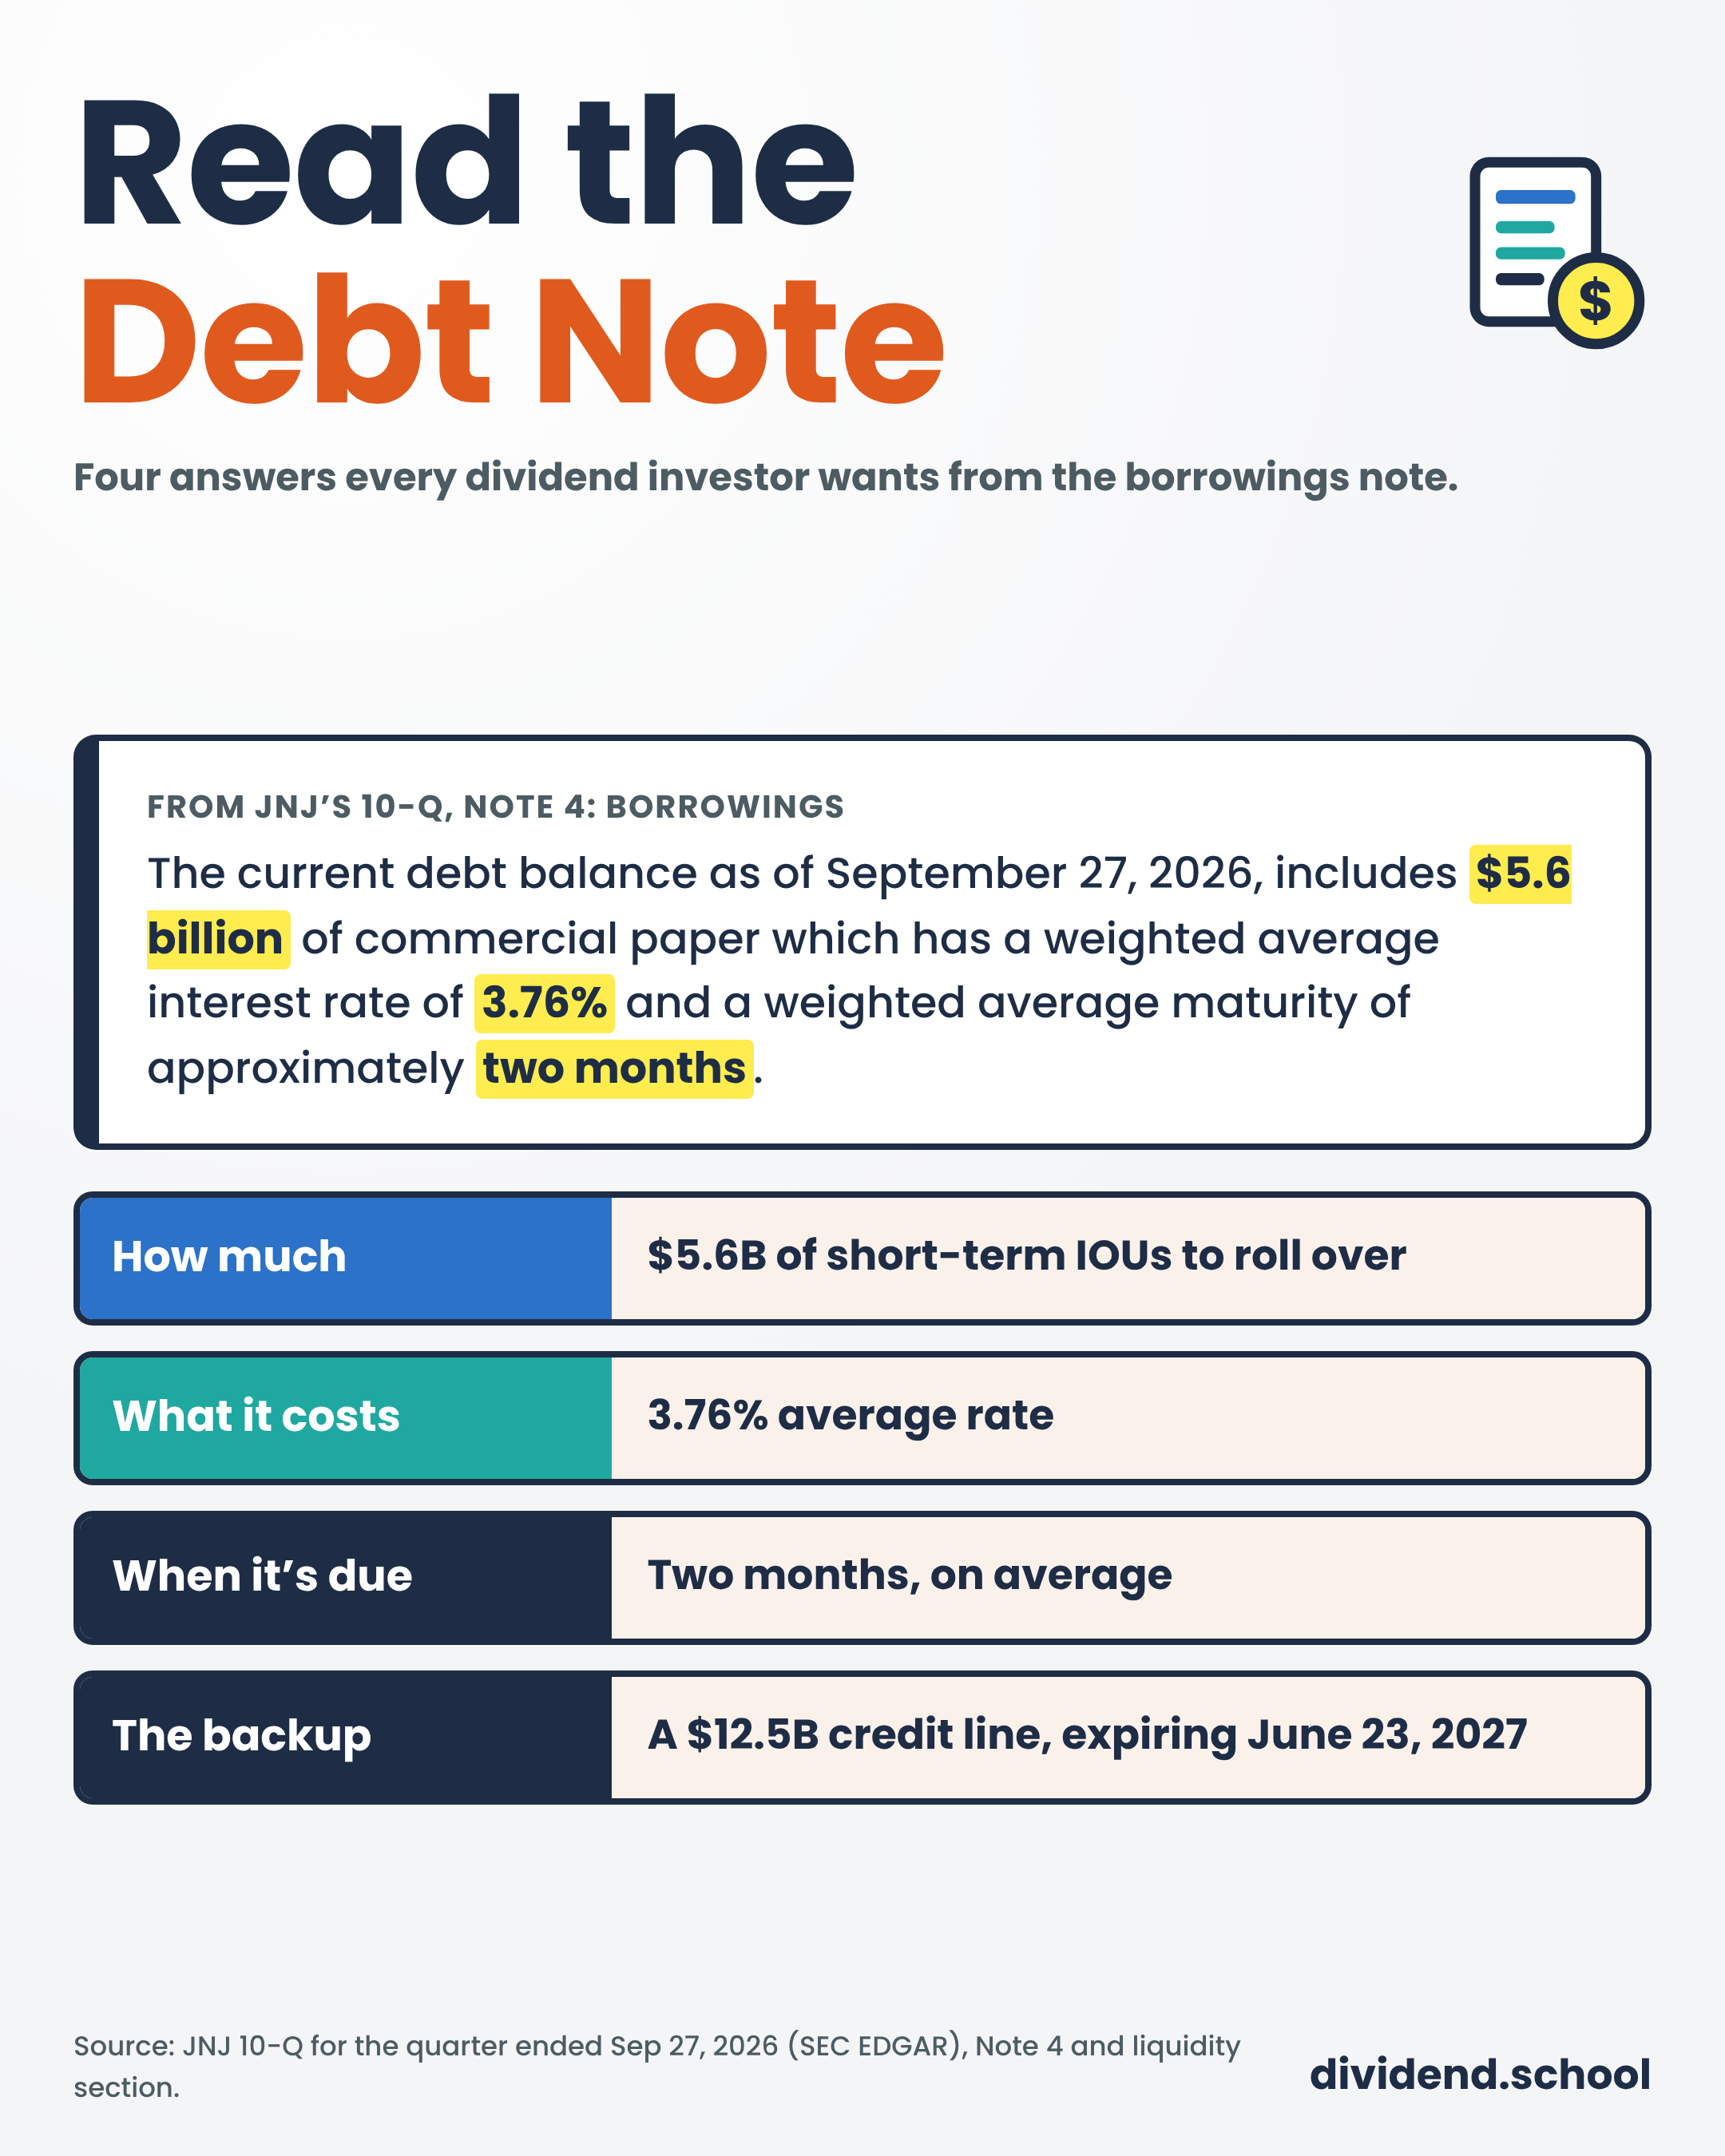
Debt. What rates the company pays and when the debt comes due. JNJ’s 10-Q shows $5.6 billion of commercial paper at a 3.76% rate, with a two-month average maturity.
Commitments and contingencies. Lawsuits, guarantees, and anything that could become a liability later.
Acquisitions. What was bought, for how much, and how much went to goodwill.
Also check structural risk factors. JNJ plans to separate its Orthopedics business, and a spin-off changes the balance sheet for everyone who stays.
Every monthly deep dive takes one company through the balance sheet, the cash flow, and the valuation, start to finish.
The Balance Sheet Checklist
Here’s the checklist. Print it, keep it next to the 10-Q, and work down the list. [DAVE: add how long it takes you per company]
Step 1: Set up
Check the balance sheet date and the fiscal year-end
Pull the latest 10-Q from sec.gov, plus the last 10-K for the full-year figures
Build trailing twelve-month figures: last fiscal year + this year-to-date - last year-to-date
Step 2: Can they pay the bills this year?
Current ratio: around 1.0 or better, unless the company has supplier muscle like PG
Quick ratio: compare to peers, since retailers will always run low
Cash to short-term debt: below 0.5 means the company depends on refinancing
Step 3: How much debt is too much?
Net debt to EBITDA: under 2 conservative, 2 to 3 normal, above 3 dig deeper
Interest coverage: above 8 comfortable, below 4 a problem
Debt-to-equity: only after checking treasury stock
Step 4: What are the assets worth?
Goodwill and intangibles as a share of total assets
Has goodwill jumped? Find the acquisition that caused it
Any impairments in the last year?
Step 5: What does the equity section say?
Treasury stock vs retained earnings
Is equity shrinking because of buybacks or because of losses? The first is fine. The second is not.
Step 6: Read the notes
Debt maturities and interest rates
Lawsuits and contingencies
Recent and planned acquisitions or spin-offs
One habit worth building: run the checklist once a year on every dividend stock you own, and again any time a company announces a big acquisition. Patience is a virtue, but an hour with the notes beats a surprise dividend freeze.
Common Mistakes to Avoid
Judging one ratio alone. HD looks loaded with debt on the debt-to-equity ratio and comfortable on interest coverage. One number never tells the whole story.
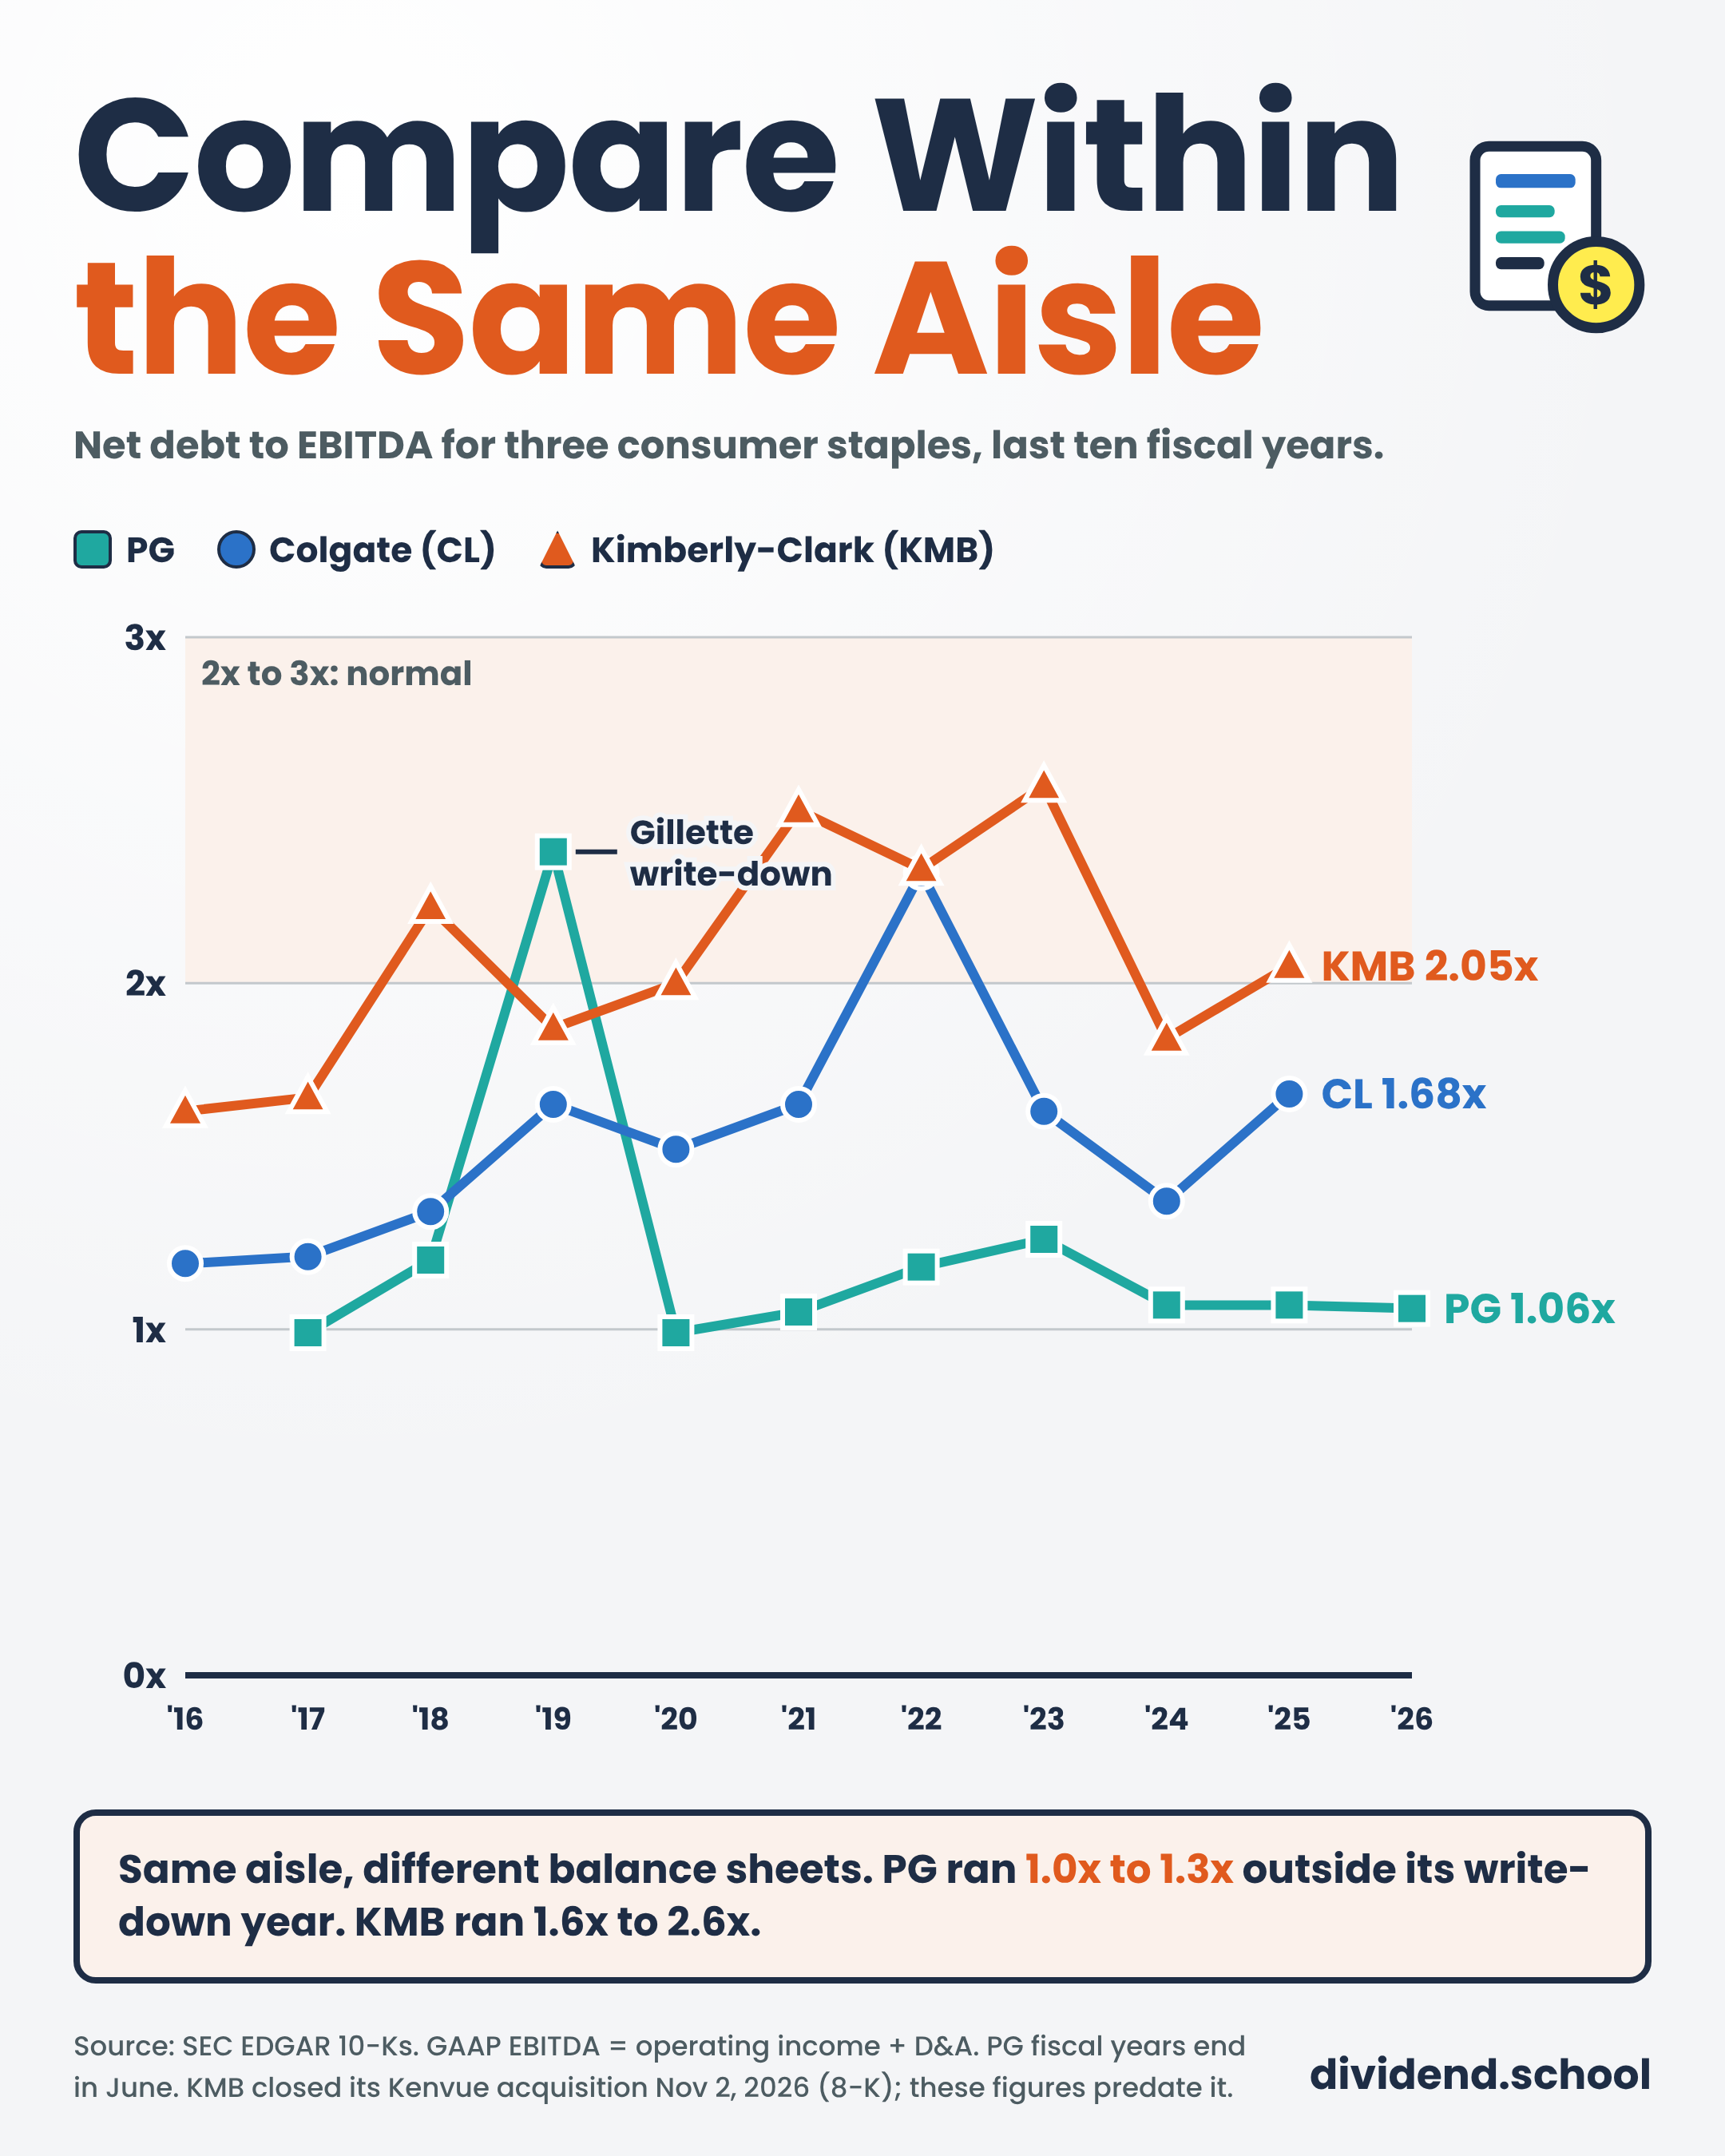
Comparing across industries. A retailer’s quick ratio will always look worse than a drug company’s. Compare HD to Lowe’s, and PG to Colgate or Kimberly-Clark.
Ignoring the date. HD’s balance sheet is eight weeks older than JNJ’s and PG’s. A lot can happen in eight weeks.
Skipping the notes. JNJ’s biggest balance sheet risk, the talc litigation, has no line of its own on the face of the balance sheet.
Treating negative tangible equity as a death sentence. Brands and patents have value the accounting doesn’t capture. Watch for write-downs instead.
The balance sheet won’t tell us what a stock is worth. It tells us whether the dividend survives a bad year, and that’s the first thing I want to know before I buy.
On Thanksgiving Day, Pro members get the Yield Trap Tracker: the highest yields in the S&P 500, sorted into keepers and traps.
Upgrade to Dividend School Pro
If you have any questions or would like me to cover something in particular, please don’t hesitate to reach out.
Until next time, take care and be safe out there,
Dave
P.S. If you would rather not run this checklist on every stock yourself, that’s what Pro is for. We do the digging on the companies in our Dividend Universe and set a Buy Below price for each one. Two paid issues a week, $369 a year or $35 a month, with a 30-day money-back guarantee.