
Buy, Build, or Bury: How to Judge Post-M&A Quality Using Danaher’s Accounting and Cash Flows

Acquisitions are where great compounders stand out from the rest. The accounting is noisy—goodwill, inventory step-ups, intangible amortization. However, the economics are straightforward: did ROIC remain above WACC, and can management reinvest at attractive returns?
Today, we’ll use Danaher’s Abcam deal to show you exactly how to make that call.
TL;DR
Focus on economic value creation: ROIC > WACC, sustained, with a reinvestment runway.
Separate accounting from cash: adjust for one-offs (inventory step-up), non-cash (intangible amortization), and working capital timing to get to “owner earnings.”
Post-M&A, build a pre-to-post ROIC bridge including: NOPAT effects, capital base step-up (including goodwill), and synergy/retention assumptions.
Danaher is a useful template: high recurring revenue, strong FCF conversion, and disciplined capital allocation. Acquisition accounting is complex but tractable.
Decision rules: prefer ROIC – WACC > 5% sustained, 100%+ FCF/net income conversion through cycles, stable margins, and per-share value growth.
Use per-share framing; buybacks matter. Check share count and SBC economics.
Why it matters
Acquisitions can look accretive on adjusted EPS while quietly destroying value. Quality investors need to translate GAAP into economic reality, then test whether the post-deal ROIC clears the WACC with a margin of safety, and if the per-share value compounds.
Where investors go wrong:
Treating reported GAAP margins as economic margins post-M&A without adjusting for purchase accounting.
Ignoring fair value “inventory step-up” and calling gross margin weakness “structural.”
Adding back intangible amortization without considering cash reinvestment needs and customer churn risk.
Using the company's “core” metrics without reconciling to cash.
Base rates to keep in mind:
Many serial acquirers hover near their cost of capital. For healthcare products/tools, a reasonable cost of capital proxy is ~8–9% as of Jan 2025, per NYU Stern/Aswath Damodaran’s industry dataset (Healthcare Products cost of capital ~8.5%) as of Jan 2025.
Durable value creation demands ROIC > WACC through cycles, not in one good year.
Core concepts (quality-investing angle)
ROIC vs WACC and value creation
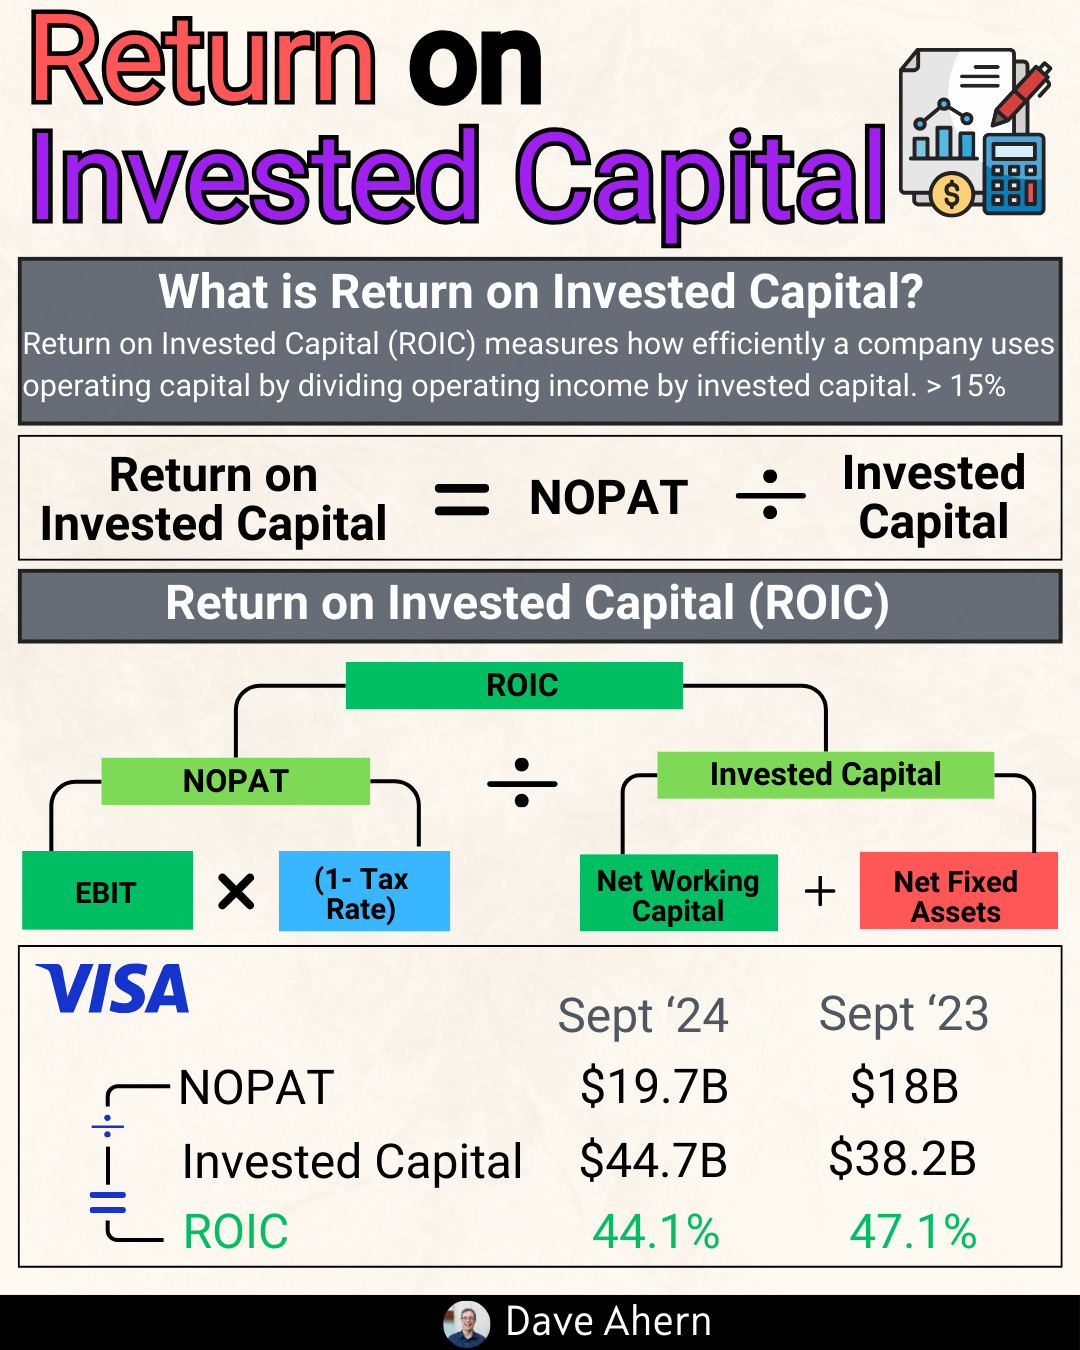
ROIC = NOPAT / Invested Capital.
NOPAT is operating profit after taxes; Invested Capital includes net working capital + net PP&E + capitalized intangibles. For stewardship ROIC, include goodwill; for project ROIC, analyze with and without goodwill to see deal economics.
Value creation rule of thumb: sustained ROIC – WACC > 5% is solid for quality investors. Higher is better, but durability and reinvestment matter more than the absolute number in one period.
Reinvestment runway and capital intensity
Reinvestment runway is the combination of TAM + product innovation + cross-sell + geographic/adjacency expansion that can absorb retained cash at high returns.
Tools and diagnostics often have moderate capital intensity and high recurring consumables—good raw material for reinvestment.
Unit economics and per-share metrics
Consumables and service revenue drive recurrence and resilience. Danaher disclosed high recurring shares across segments in 2024: Biotech 85% recurring, Life Sciences 67%, Diagnostics 89% as of Dec 31, 2024, Danaher 2024 Annual Report.
Per-share framing: track FCF/share, EPS, and share count. Check if buybacks are timing well and not offset by dilution.
Moat durability and evidence
Indicators: price/mix, renewal/retention, switching costs (installed base + workflow integration), stable gross-to-operating margin bands, and resilient working capital turns.
Mode focus: Accounting nuances → economic reality
Acquisition accounting creates:
Goodwill: premium over fair value of identifiable assets. Non-amortizing under U.S. GAAP; impairment risk if economics disappoint.
Intangible amortization: customer relationships, technology, trade names—non-cash but reduces GAAP earnings.
Inventory fair value step-up: a one-time bump in COGS post-close as acquired inventory is sold—temporarily depressing gross margins and FCF.
Your job:
Normalize gross margin by excluding inventory step-up charges.
Consider the economic implications of amortization: add back for owner earnings, but assess whether the acquired intangibles require reinvestment to sustain cash flows.
Build a pre-to-post ROIC bridge, with and without goodwill, to judge deal value creation.
Worked example: Danaher x Abcam
Danaher (NYSE: DHR) is a global life sciences and diagnostics company with strong recurring revenue and FCF conversion.
Highlights:
2024 revenue: $23.9B; FCF: $5.3B; FCF exceeded net income for the 33rd consecutive year as of Dec 31, 2024, Annual Report and FY24 release, FY24 press release, Jan 29, 2025.
Segment mix (2024): Biotechnology ~$6.8B, Life Sciences ~$7.3B, Diagnostics ~$9.8B as of Dec 31, 2024.
Abcam deal: announced Aug 2023; closed mid-2024 timing per IR; financed with cash on hand; approximately $3.9B of goodwill recorded SEC 10-K, FY2024, as of Dec 31, 2024.
Purchase accounting effects to note:
Inventory fair value step-up for Abcam: The company cites approximately $92M in nonrecurring charges across late 2023 and early 2024, as well as an additional $25M included in the 9M 2024 pro forma adjustments as of September 27, 2024, in the Q3 10-Q, Note 2. This temporarily compresses gross margin; should not be annualized.
Intangible amortization remains a large non-cash charge at Danaher; FY24 amortization of acquisition-related intangibles was significant (e.g., ~$1.6B pretax over FY24 per non-GAAP reconciliation in FY24 press release) as of Jan 29, 2025.
Owner earnings thinking (conceptual, not precise):
Start with operating cash flow (FY24: $6.7B) and subtract maintenance capex (estimate a portion of $1.4B capex is growth; maintenance is likely well under total capex for tools/diagnostics). Result is a baseline owner earnings proxy.
Add back one-time inventory step-up costs and restructuring cash if not recurring; ignore non-cash amortization for economic cash but assess whether reinvestment is needed to defend cash flows (e.g., R&D, commercial support).
Cross-check: Danaher’s FCF/net income typically >100% through cycles (FY24: FCF $5.3B vs NI $3.9B) as of Dec 31, 2024.
Pre → Post M&A ROIC bridge (framework)
Pre-Abcam (baseline): Calculate or proxy NOPAT and Invested Capital (include goodwill for stewardship ROIC).
Add acquisition effects:
Capital: increase invested capital by acquired net tangible + identifiable intangibles + goodwill (~$3.9B goodwill for Abcam).
NOPAT: adjust operating income for revenue and margin contribution; strip out one-time inventory step-up; decide on amortization treatment.
Compute post-deal ROIC: NOPAT / Invested Capital. Run-with and run-without goodwill to judge deal cash returns vs. price paid and stewardship ROIC including goodwill.
WACC benchmark: ~8–9% for healthcare products/tools as of Jan 2025. Aim for ROIC comfortably > WACC through cycle.
Per-share framing
Share count decreased: from ~739.2M outstanding at Dec 31, 2023 to ~714.7M as of Feb 3, 2025 (10-K cover data) with ~$7B+ buybacks around FY24/FY25 window; Danaher repurchased ~20M shares YTD by Q3 2024 and authorized a new 20M share program as of Sep 27, 2024, 10-Q Note 13 and as of Dec 31, 2024, 10-K. This supports FCF/share and EPS growth.
Cyclicality note
COVID-era diagnostics (molecular testing) created a step-up in revenue/margins; post-pandemic normalization affected 2023–2024 comps. Analyze mid-cycle margins for valuation and ROIC.
Caveats
Segment-level disclosure and reallocation effects (e.g., Veralto separation in 2023) complicate time-series comparability.
Capitalized R&D vs. expensed R&D: treat consistently across peers when benchmarking ROIC.
How to do this yourself
Step-by-step
Data to gather (primary)
10-K/20-F and latest 10-Qs for: segment revenue/mix, cash flow statement, goodwill/intangibles rollforward, share count, buybacks/SBC, acquisition notes (purchase price allocation), and any impairment charges.
Non-GAAP reconciliations for inventory step-up and amortization disclosures.
Investor presentations for recurring revenue mix and segment context.
Industry WACC benchmark (e.g., Damodaran’s datasets).
Exact checks and calculations
Owner earnings:
Start with operating cash flow.
Subtract maintenance capex (estimate if not disclosed; triangulate from depreciation, asset turns, management commentary).
Add back one-time inventory step-up and restructuring cash; remove working capital timing if atypical.
Consider adding back intangible amortization (non-cash) but ask if ongoing reinvestment is required to maintain the acquired cash flows.
ROIC:
NOPAT = Operating income × (1 – tax rate). Normalize for one-offs (inventory step-up, restructuring).
Invested capital = Net working capital + net PP&E + capitalized intangibles (+ goodwill for stewardship ROIC).
Compute ROIC with goodwill (stewardship view) and without goodwill (project-level economic returns). Compare both to WACC.
Decision rules:
Prefer ROIC – WACC > 5% sustained; mid-cycle, not only peak.
FCF/net income conversion ≥ 100% through cycle.
Recurring revenue mix high and stable; margin bands tight; CCC stable or improving.
Per-share value accretion: FCF/share up, buybacks at sensible valuations, limited dilution from SBC.
Valuation cross-check (even on a Saturday)
Use EV/FCF and EV/EBIT vs 5–10y medians. Penalize if today’s multiple assumes heroic margin expansion or if normalized FCF is below the last two-cycle average.
Sanity-test implied ROIC in a reverse DCF: does the market price assume returns far above WACC for too long? If yes, require superior moat evidence.
Pitfalls and false positives
Annualizing inventory step-up: It’s one-time as acquired inventory sells through; don’t build it into steady-state margins.
Blindly adding back amortization: While non-cash, amortization reflects purchased customer relationships/technology. If churn or reinvestment needs are real, your “owner earnings” should reflect economic maintenance spending (R&D, customer success).
Ignoring working capital quality: A jump in FCF from extended payables isn’t repeatable. Watch CCC trend.
Confusing adjusted metrics with cash: Reconcile to the cash flow statement.
Overlooking per-share math: Buybacks at high multiples can destroy value; SBC can offset repurchases.
Checklist / one-pager
ROIC:
NOPAT normalized (strip one-offs)
Invested capital with and without goodwill
ROIC – WACC > 5% sustained?
Reinvestment:
Recurring revenue mix ≥ 60–70% and stable
R&D and new product cadence support runway
Cash conversion:
FCF/net income ≥ 100% through cycle
CCC stable/improving
Purchase accounting normalized:
Inventory step-up isolated and removed from steady state
Amortization added back for owner earnings, but maintenance needs assessed
Per share:
FCF/share and EPS growing
Share count falling without heavy SBC offset
Valuation:
EV/FCF & EV/EBIT vs 5–10y medians
Reverse DCF sanity vs mid-cycle margins/ROIC
Glossary
ROIC: Return on invested capital; NOPAT divided by invested capital.
WACC: Weighted average cost of capital; hurdle rate for value creation.
NOPAT: Net operating profit after tax; operating income × (1 – tax rate).
Inventory step-up: Purchase accounting adjustment that raises acquired inventory to fair value; depresses gross margin once as it sells through.
Goodwill: Premium paid over fair value of acquired net assets; not amortized under GAAP; can be impaired.
Intangible amortization: Non-cash GAAP expense for acquired intangibles (customer relationships, tech, trade names).
Owner earnings: Cash-based earnings proxy: operating cash flow less maintenance capex, normalized for one-offs.
CCC: Cash conversion cycle; DSO + DIO – DPO; measures working capital efficiency.
Further reading
Danaher FY2024 press release and non-GAAP reconciliations (Jan 29, 2025) as of Jan 29, 2025
Danaher 2024 Annual Report and embedded 10-K as of Dec 31, 2024
Danaher Q3 2024 Form 10-Q (purchase accounting details, goodwill rollforward) as of Sep 27, 2024
NYU Stern (Damodaran) industry cost of capital tables as of Jan 2025
References
Danaher 2024 Annual Report and 10-K: segment revenue/mix, recurring revenue shares, FCF conversion; “free cash flow exceeded net income for the 33rd consecutive year” as of Dec 31, 2024
Danaher Q3 2024 10-Q: acquisition notes (Abcam inventory fair value step-up ~$92M late-2023/early-2024; $25M included in 9M 2024 pro forma adjustments), goodwill rollforward, buyback program activity and share count as of Sep 27, 2024
Danaher FY2024 press release: revenue, FCF, amortization disclosures (non-GAAP) as of Jan 29, 2025
SEC 10-K FY2024 (HTML): Abcam acquisition financing and ~$3.9B goodwill recorded as of Dec 31, 2024
NYU Stern (Damodaran) industry WACC dataset (Healthcare Products ~8.5%) as of Jan 2025
Disclaimer
Educational content, not investment advice.