
SCHD Owns 103 Stocks. None of Them Are Apple, Microsoft, or Nvidia. Here's Why.
103 quality dividend payers, 0.06% expense ratio, and a methodology most investors have never read.

The Schwab U.S. Dividend Equity ETF (ticker: SCHD) has become one of the most popular dividend funds on the market. With roughly $90 billion in assets, it sits at the heart of countless retirement accounts, brokerage portfolios, and dividend reinvestment plans.
But popularity is not the same thing as understanding. Many investors own SCHD because someone told them it pays a good dividend, not because they know what is inside it, how the methodology actually works, or whether it fits their portfolio.
In today’s post, we will learn:
What SCHD Is and Why It Matters
The Methodology Behind SCHD
A Look at SCHD’s Top Holdings
How to Analyze SCHD Before You Buy
Where to Buy SCHD
Investor Takeaway
Okay, let’s dive in and learn more about how SCHD works.
What SCHD Is and Why It Matters
SCHD is an exchange-traded fund managed by Charles Schwab. Its full name is the Schwab U.S. Dividend Equity ETF, and its stated goal is straightforward: track the total return of the Dow Jones U.S. Dividend 100 Index, before fees and expenses.
In plain English, SCHD owns a basket of about 100 U.S. companies that pay reliable dividends and have demonstrated financial strength over many years. When you buy one share of SCHD, you buy a small piece of every one of those companies.
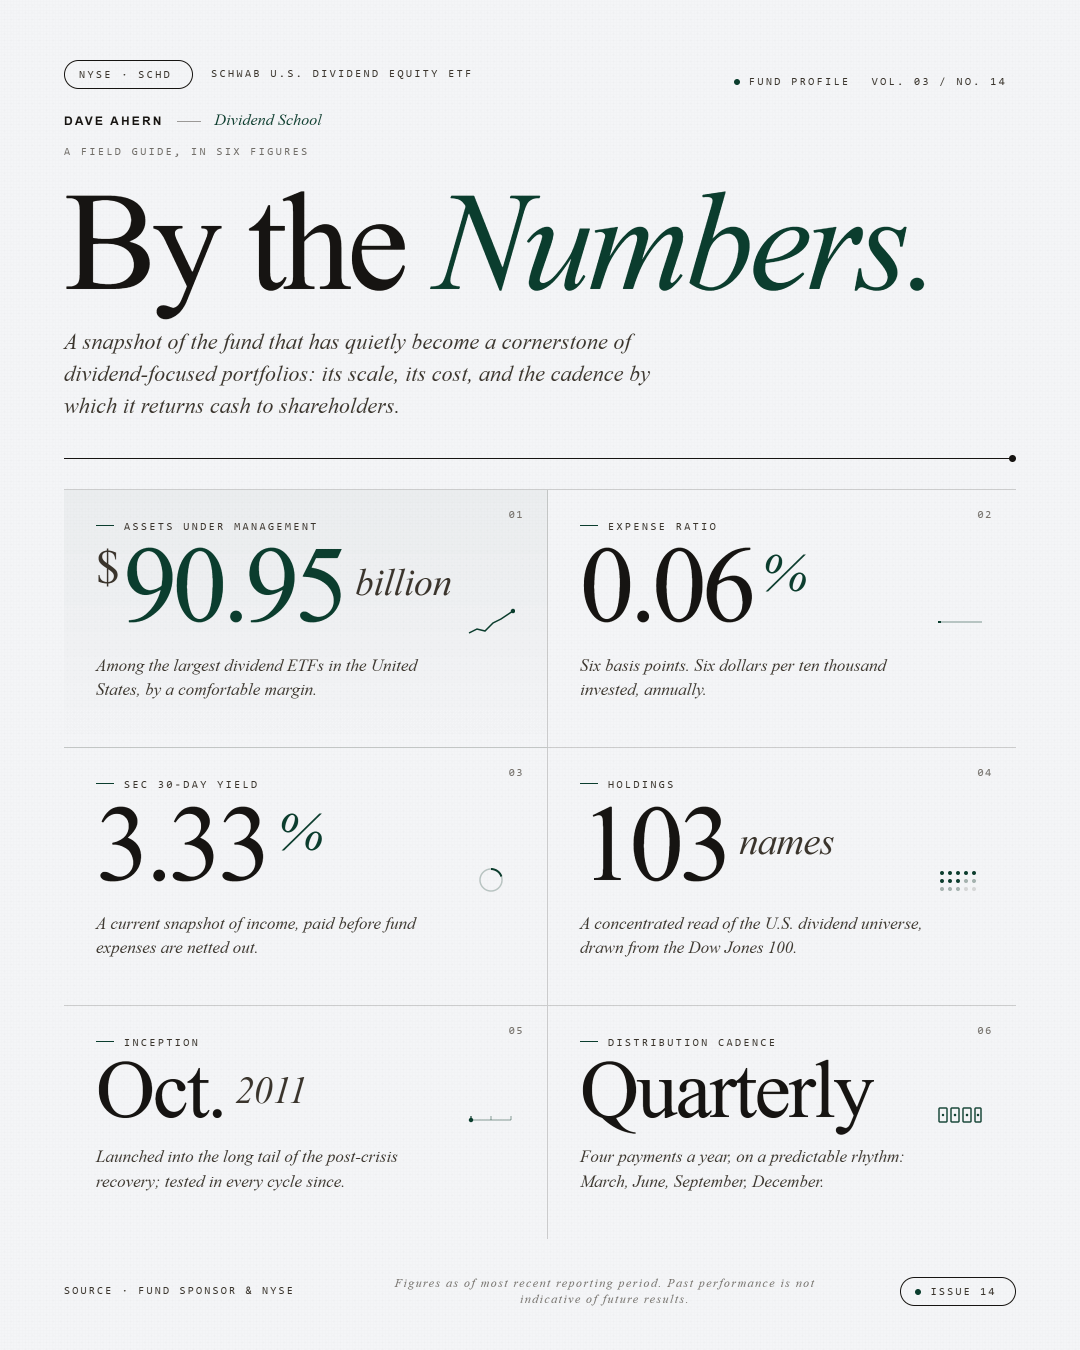
A few facts worth knowing up front (data as of May 2026):
Ticker: SCHD
Inception: October 20, 2011
Assets under management: roughly $90.95 billion
Expense ratio: 0.06% (that is $6 per year on a $10,000 investment)
30-day SEC yield: about 3.33%
Distribution frequency: quarterly
Number of holdings: 103
The expense ratio deserves a second look. At 0.06%, SCHD ranks among the cheapest dividend ETFs available. The average expense ratio across all U.S. ETFs is roughly 0.36%, so SCHD costs about six times less than the typical fund. Over decades of compounding, that fee gap turns into real money.
Why does SCHD matter for dividend investors?
Three reasons.
First, it offers instant diversification. Instead of picking individual dividend stocks (and risking a single dividend cut wrecking your income stream), you spread your bet across 100 companies.
Second, the methodology screens for quality, not just yield. Many high-yield funds load up on troubled companies whose dividends are at risk. SCHD specifically tries to avoid that trap.
Third, the cost is low enough that nearly all of the dividend income flows through to you rather than to the fund company.
The Methodology Behind SCHD
This is where most investors stop reading, and where the real story actually starts. SCHD is a passive fund, but the index it tracks is anything but generic. Understanding the methodology tells you why SCHD owns what it owns.
The fund tracks the Dow Jones U.S. Dividend 100 Index, maintained by S&P Dow Jones Indices. The index starts with the Dow Jones U.S. Broad Market Index, which tracks roughly 2,500 companies, and narrows it to the 100 best dividend payers.
The screening starts with four eligibility rules:
Ten consecutive years of dividend payments. Companies that have not paid a dividend every year for at least a decade are immediately disqualified. This single rule eliminates most younger companies and any business that has cut its dividend recently.
A minimum float-adjusted market capitalization of $500 million. This keeps tiny, illiquid companies out of the index.
A minimum three-month average daily trading volume of 200,000 shares. Another liquidity safeguard.
Real estate investment trusts are excluded. SCHD is a dividend equity fund, not a REIT fund. If you want REITs, that is a separate decision.
The companies that survive the eligibility screens are then ranked by a composite score built from four fundamentals:
Cash flow to total debt (a balance sheet quality measure)
Return on equity (a profitability measure)
Indicated dividend yield (the current income measure)
Five-year dividend growth rate (the growth measure)
The top 100 stocks by composite score make the index. Weights are assigned by a tilted yield formula, capped at roughly 4.5% per position, so no single company can dominate the fund.
The index is reconstituted once a year in March, replacing companies that no longer pass the screens with those that do. It also rebalances quarterly to bring weights back to target levels.
The takeaway here matters. SCHD is not chasing the highest yield in the market. It is chasing the best combination of yield, growth, and financial quality. That is a very different mandate, and it is exactly why SCHD looks different from funds like JEPI or high-yield bond ETF.
If this kind of breakdown is useful to you, the paid tier goes a layer deeper every week. Last month I walked through a full company analysis, including the 10-K pages I pulled from, the valuation math, and the red flags I would have missed five years ago. That is the kind of work I'm trying to make accessible to everyday investors.
A Look at SCHD’s Top Holdings
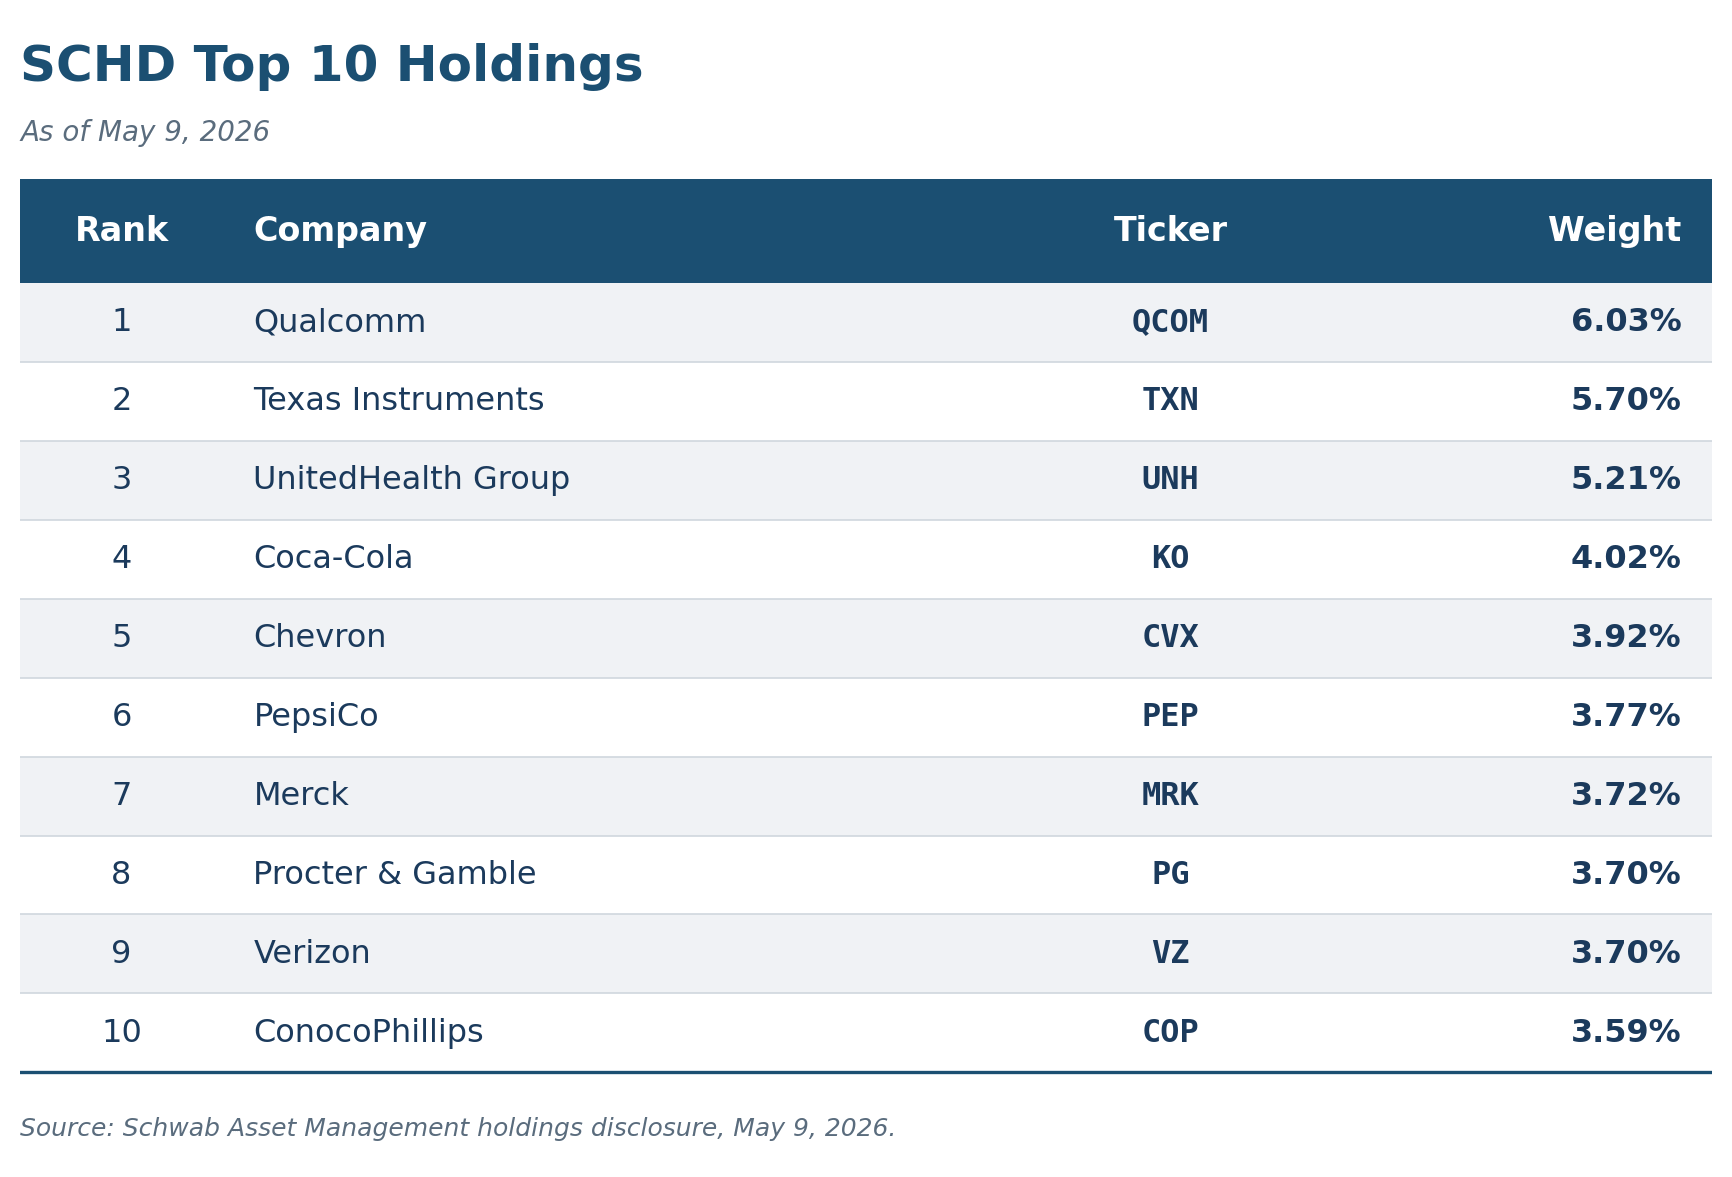
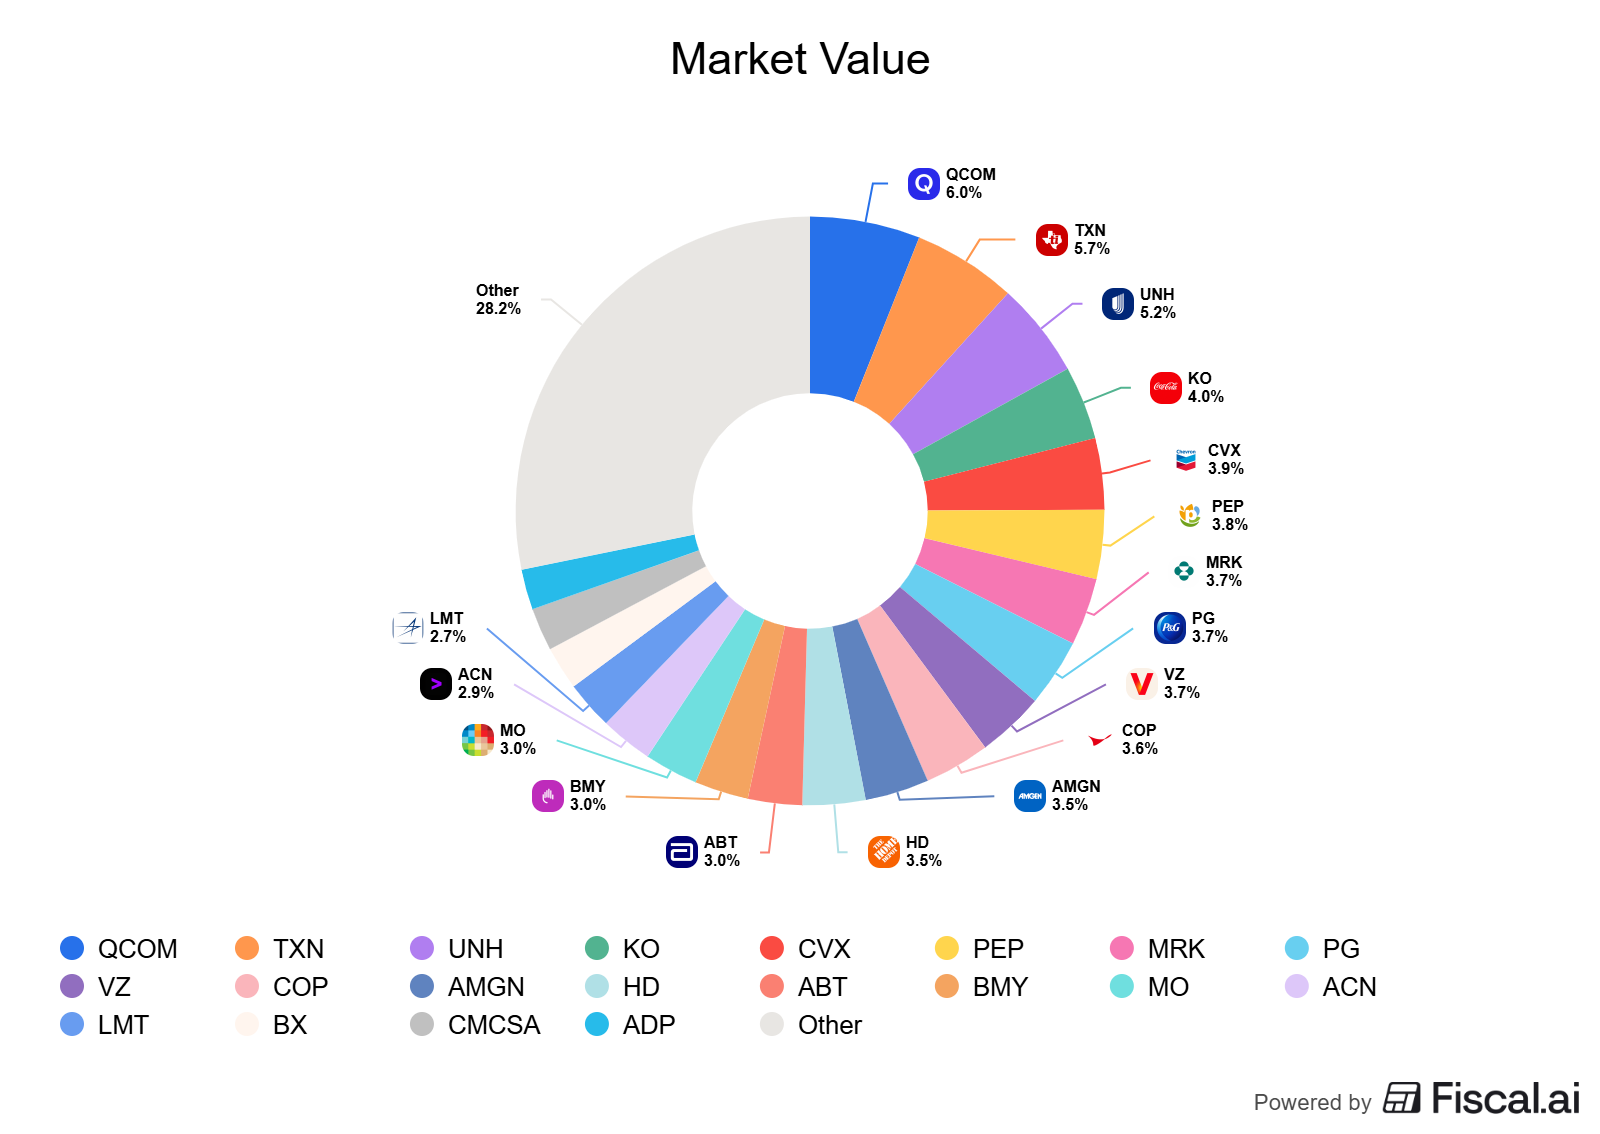
The top 10 positions in SCHD account for roughly 43% of the fund. As of May 9, 2026, those holdings are:
Two things jump out when you look at this list.
The first is the sector mix. SCHD currently tilts heavily toward technology (QCOM, TXN), healthcare (UNH, MRK), consumer staples (KO, PEP, PG), and energy (CVX, COP). You will not find Apple, Microsoft, Nvidia, or Tesla in here. Those companies either do not pay a meaningful dividend or do not meet the ten-year dividend history rule.
The second is the kind of business mix. These are mature, cash-generative companies with established moats. Coca-Cola has the brand power Warren Buffett wrote about in his shareholder letters. Procter & Gamble owns dozens of household consumer brands. UnitedHealth is the largest health insurer in the U.S. by revenue. ConocoPhillips and Chevron sit at the center of global energy infrastructure.
This is by design. The methodology forces SCHD to own established businesses with durable cash flow, not high-growth speculation.
One caveat worth flagging. SCHD’s energy exposure has climbed meaningfully over the past few years. The most recent reconstitution added several energy names and the sector now represents a sizable portion of the fund. If you already own energy stocks elsewhere in your portfolio, SCHD will add to that exposure.
How to Analyze SCHD Before You Buy
Owning SCHD without analyzing it is like buying a house without looking inside. Here is the framework I use, the same one I would apply to any dividend ETF.
1. Check the current yield against its history
SCHD’s 30-day SEC yield sits around 3.33% as of May 2026. Compare that to where the yield has been over the last five years. A current yield meaningfully below the historical average suggests the price has run up faster than the dividend, which can mean you are paying more for the same income. A yield meaningfully above the average can be a sign of either opportunity or trouble in the underlying holdings.
2. Look at the dividend growth, not just the yield
The dividend growth rate matters more than the headline yield, especially if you have a long time horizon. SCHD has grown its distribution steadily since inception in 2011. The Q1 2026 distribution of $0.2569 per share was a 3.3% increase year over year. Pull up the dividend history and look at the year-over-year growth rate. A growing distribution beats a high but stagnant one over time.
3. Examine the sector concentration
Pull up the current sector breakdown on Schwab’s website or any major brokerage. Check whether the mix lines up with what the rest of your portfolio already owns. If you hold a lot of individual energy stocks, SCHD’s energy weight may push your total energy exposure higher than you intended.
4. Check the overlap with your other funds
If you also own an S&P 500 index fund, you may already own Chevron, Coca-Cola, and most of the rest. SCHD often overlaps heavily with broad market funds. Owning both is not wrong, but you should know how much you are doubling up.
5. Compare the expense ratio to alternatives
At 0.06%, SCHD is hard to beat on cost. But check the competition. The Vanguard Dividend Appreciation ETF (VIG) and the iShares Core Dividend Growth ETF (DGRO) both compete in this space with different methodologies. Cheaper does not always mean better, but you should know what trade-offs you are making.
6. Understand the rebalancing schedule
Because SCHD reconstitutes annually in March, the fund can look noticeably different one year to the next. Stocks that have run up too far in price (and therefore yield too little) get kicked out. New names that pass the screens get added. This is a feature, not a bug. It forces a mechanical buy-low, sell-high discipline. But it also means today’s SCHD is not necessarily tomorrow’s SCHD.
Where to Buy SCHD
SCHD trades on the NYSE Arca exchange and is available at essentially every major U.S. brokerage. Here are the most common options:
Charles Schwab: commission-free, no surprise (Schwab is the issuer).
Fidelity: commission-free trading on ETFs, including SCHD.
Vanguard: commission-free ETF trading.
E*TRADE and Morgan Stanley: commission-free trading.
Robinhood: commission-free, supports fractional shares.
Interactive Brokers: commission-free under the IBKR Lite tier.
M1 Finance: available within their pie portfolio structure.
For tax-advantaged accounts (Roth IRA, traditional IRA, 401(k) brokerage window), SCHD is widely available wherever the account is held. Holding SCHD in a tax-advantaged account is generally more efficient than holding it in a taxable account, because the quarterly distributions are taxed as either ordinary income or qualified dividends depending on your situation. Inside an IRA, that tax drag disappears.
A quick note for international readers. SCHD itself is a U.S.-listed ETF, but Schwab and partners have launched related products on exchanges in other countries. Whether SCHD or a local equivalent is the better choice depends on your tax residency, which is a conversation for a qualified advisor.
Investor Takeaway
SCHD is not a magic income machine. It is a rules-based, low-cost wrapper around 100 quality dividend payers. The methodology screens for financial strength, dividend history, and growth potential, which is exactly what Buffett’s filters tell us to look for in individual companies.
But the same advice applies here that applies to any investment. Understand what you own. Know how the methodology works. Check that the holdings line up with the rest of your portfolio. And remember that “popular” and “right for you” are two different things.
If you want broad, diversified exposure to quality U.S. dividend payers at a rock-bottom expense ratio, SCHD does that job well. If you want maximum growth, maximum yield, or exposure to small-cap names and REITs, look elsewhere.
The framework stays simple. Verify the yield. Watch the dividend growth. Check the sector mix. Compare the expense ratio. Understand the rebalancing. If those five boxes check out for your situation, you are well on your way to building a quality core holding.
That is going to wrap up our discussion for today.
As always, thank you for taking the time to read this post, and I hope you find something of value on your investing journey.
If I can further assist, please don’t hesitate to reach out.
Until next time, take care and be safe out there,
Dave
If you've made it this far, you're already doing the work most investors skip. The paid tier is where that work goes deeper.
Full company analyses pulled from SEC filings. The Dividend Safety Spreadsheet. Weekly valuation breakdowns. None of it tells you what to buy. All of it helps you decide on your own.
Hi Dave, this work, much appreciated, leads me to the question; if I can get 3.8% on a CD why would I risk market declines for an ETF that earns less and could have a major price drop during a sell off or correction?