
Beyond EPS: Measuring Real Per‑Share Value Creation at Apple

You can’t grow what you don’t measure.
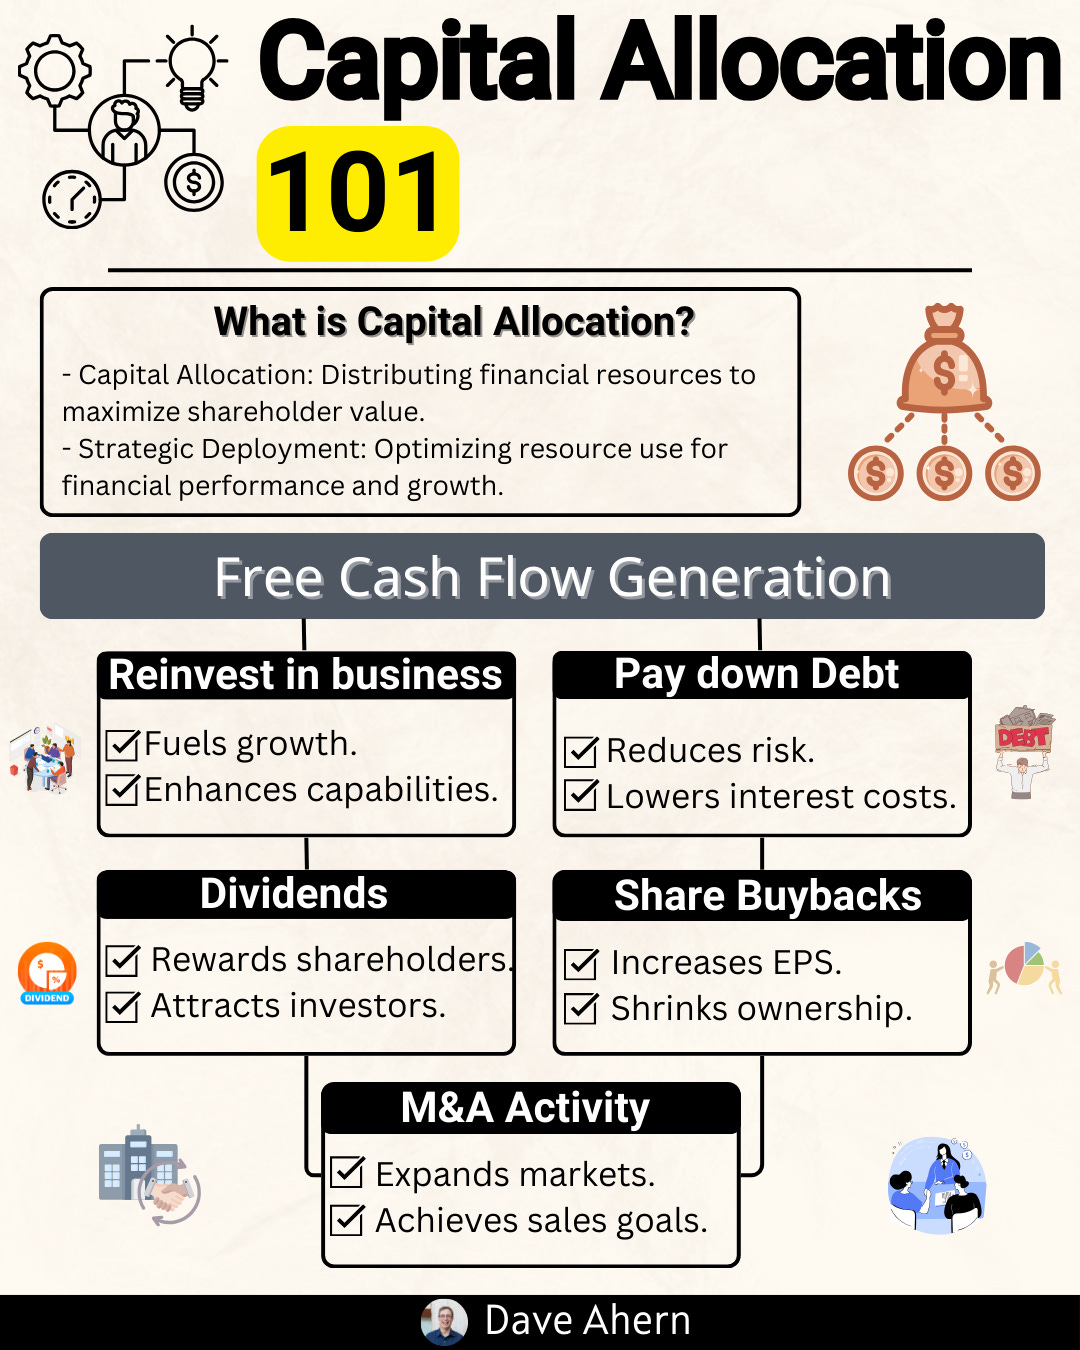
For per‑share compounding, the right measures surface whether management is creating value per share or just moving numbers around.
Apple is the canonical case: exceptional free cash flow, disciplined capital allocation, and sustained buybacks. This explainer demonstrates exactly how to test that story and replicate the process for any quality compounder.
TL;DR
Favor companies with ROIC well above WACC for years; that spread funds durable compounding.
Measure per‑share value creation directly: FCF/share, EPS, and share count over time.
Judge buybacks with a “quality test”: fueled by excess FCF, below intrinsic value, anti‑dilutive, and not starving reinvestment.
Apple is a high-quality company, characterized by massive cash generation, a negative working capital cycle, and a long record of buybacks, resulting in declining share count and rising per-share metrics (CNBC, as of January 2022; Apple Q2 FY25 press release, as of May 1, 2025).
Do it yourself: pull 10‑K/10‑Q cash flows, share count, SBC, and build a per‑share dashboard with explicit thresholds (e.g., sustained ROIC – WACC > 5%, FCF conversion > 90% over cycle).
Why it matters
Quality investing ultimately reduces to durability and reinvestment. If a business earns high returns on capital, has a runway to reinvest at similar returns, and allocates excess cash wisely, you get compounding, especially per share.
Where investors go wrong:
Chasing headline EPS growth without checking share count and FCF/share.
Treating buybacks as always good or always bad; context matters.
Ignoring the cost of capital. High ROIC only creates value if it exceeds WACC meaningfully.
Underestimating per‑share dilution from stock‑based comp (SBC).
Base rates to remember:
Most firms do not sustain ROIC – WACC > 5% for a decade. When you find it, pay attention.
In large caps, buybacks often offset SBC at best (hello, Meta). The standouts reduce share count 2–4% per year while still investing.
Negative working capital cycles (suppliers funding operations) can supercharge FCF, but they’re moat‑dependent.
Core concepts (quality lens)
ROIC vs WACC and value creation
ROIC (return on invested capital): after‑tax operating profit versus the capital required to run the business.
Where NOPAT = operating income × (1 – tax rate), and Invested Capital excludes excess cash.
WACC (weighted average cost of capital): blended cost of debt and equity.
Value creation happens when ROIC > WACC. The spread multiplied by reinvested dollars drives intrinsic value growth.
Decision rule:
Prefer businesses with ROIC – WACC > 5% sustained for 5–10 years; higher is better.
Reinvestment runway and capital intensity
Reinvestment runway: how much the firm can redeploy at high ROIC before returns fade.
Capital intensity: how much new capital is required to grow. Asset‑light models often scale with less capital, boosting FCF.
Look for:
New products/segments with similar economics.
TAM with pricing power and retention to sustain returns.
Organic growth that doesn’t require heavy working capital or capex.
Unit economics and per‑share metrics
Unit economics: price, gross margin, retention, CAC payback in services; or SKU margin and churn in hardware/ecosystem.
Per‑share metrics matter most to owners:
FCF/share (free cash flow per share)
EPS and diluted shares outstanding
Owner earnings/share (FCF adjusted for maintenance capex and SBC realities)
Moat durability and evidence (not claims)
Evidence: stable or rising gross and operating margins through cycles; negative or improving cash conversion cycle (CCC); low churn/high retention in services; enduring network/switching costs.
Watch for margin stability despite input shocks, and pricing power without volume loss.
Worked example: Apple
Apple is a large, US-based compounder with a long history of capital returns, consistent cash generation, and a services mix that supports durable margins. Management has consistently returned capital to shareholders via buybacks and dividends since 2012, with multiple program expansions (Apple, 2013; Apple, 2014). As recently as May 1, 2025, the board authorized a new $100B repurchase program and returned $29B to shareholders in the March 2025 quarter (Apple Newsroom, as of May 1, 2025).
Key quality angles:
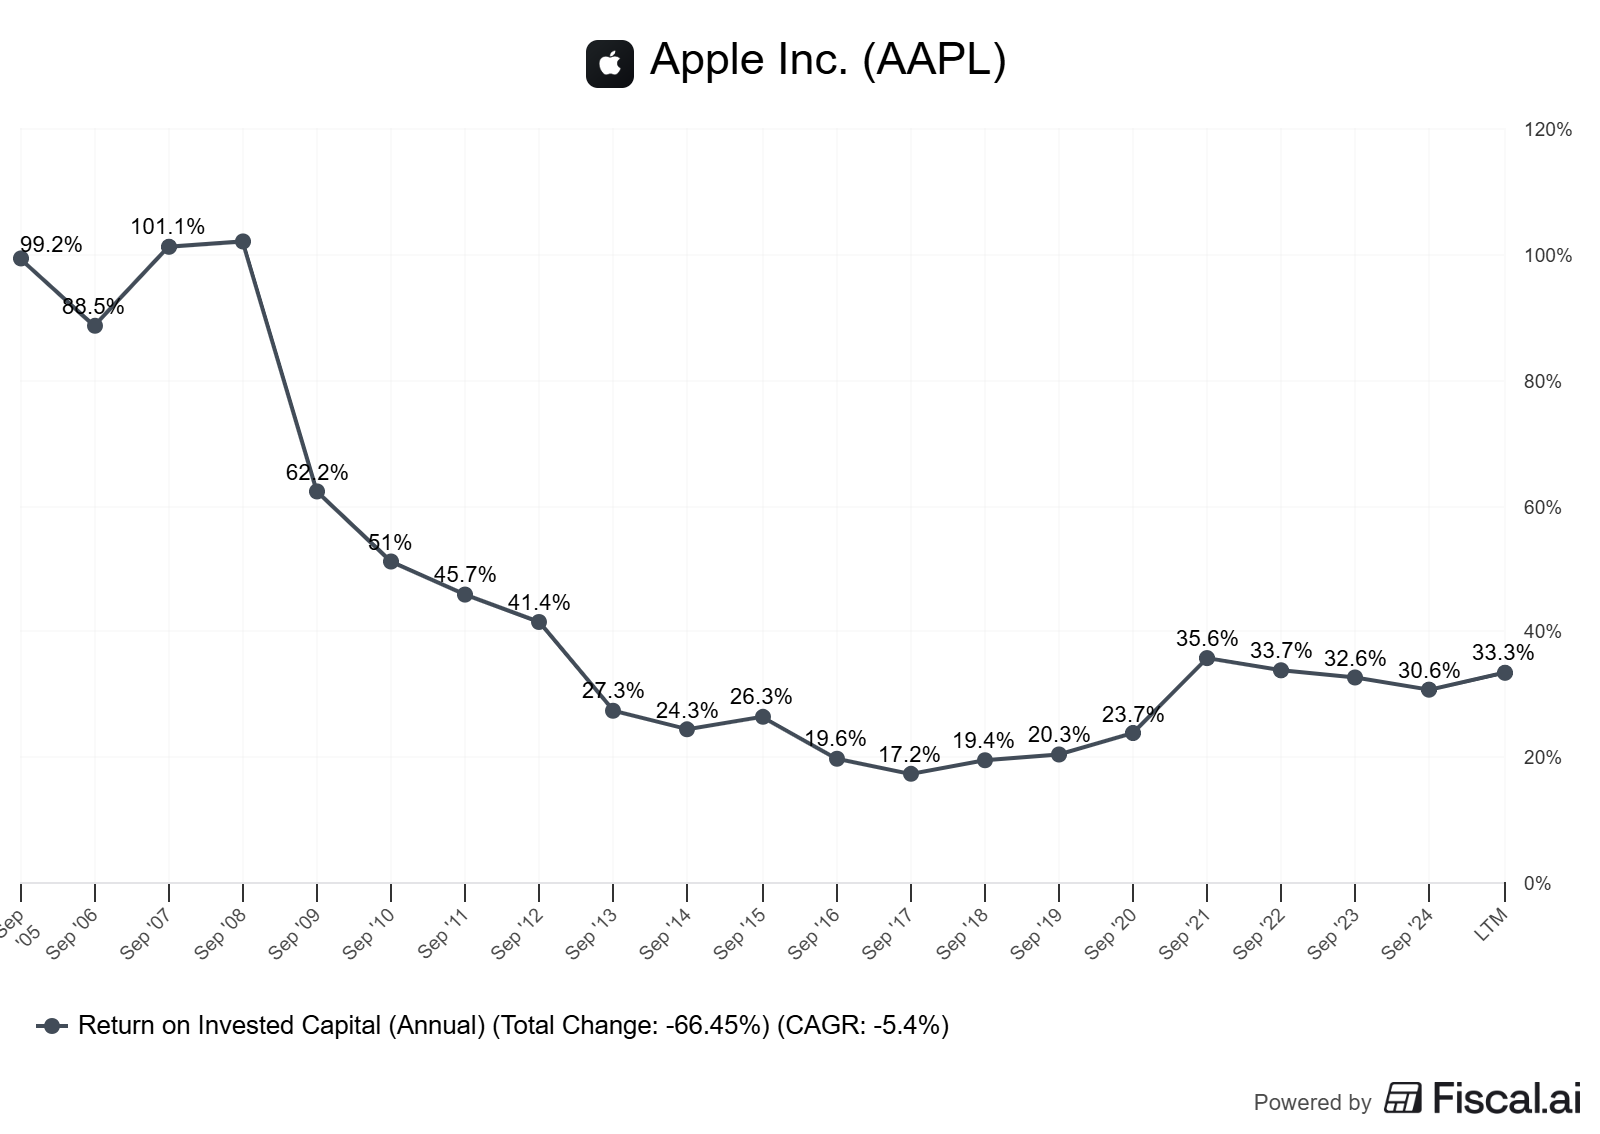
ROIC likely well above WACC over the past decade, supported by premium brand, ecosystem lock‑in, and services scaling. Compute from 10‑Ks for precise series.
FCF conversion strong: large OCF minus modest capex, aided by negative working capital (suppliers fund inventory pipeline).
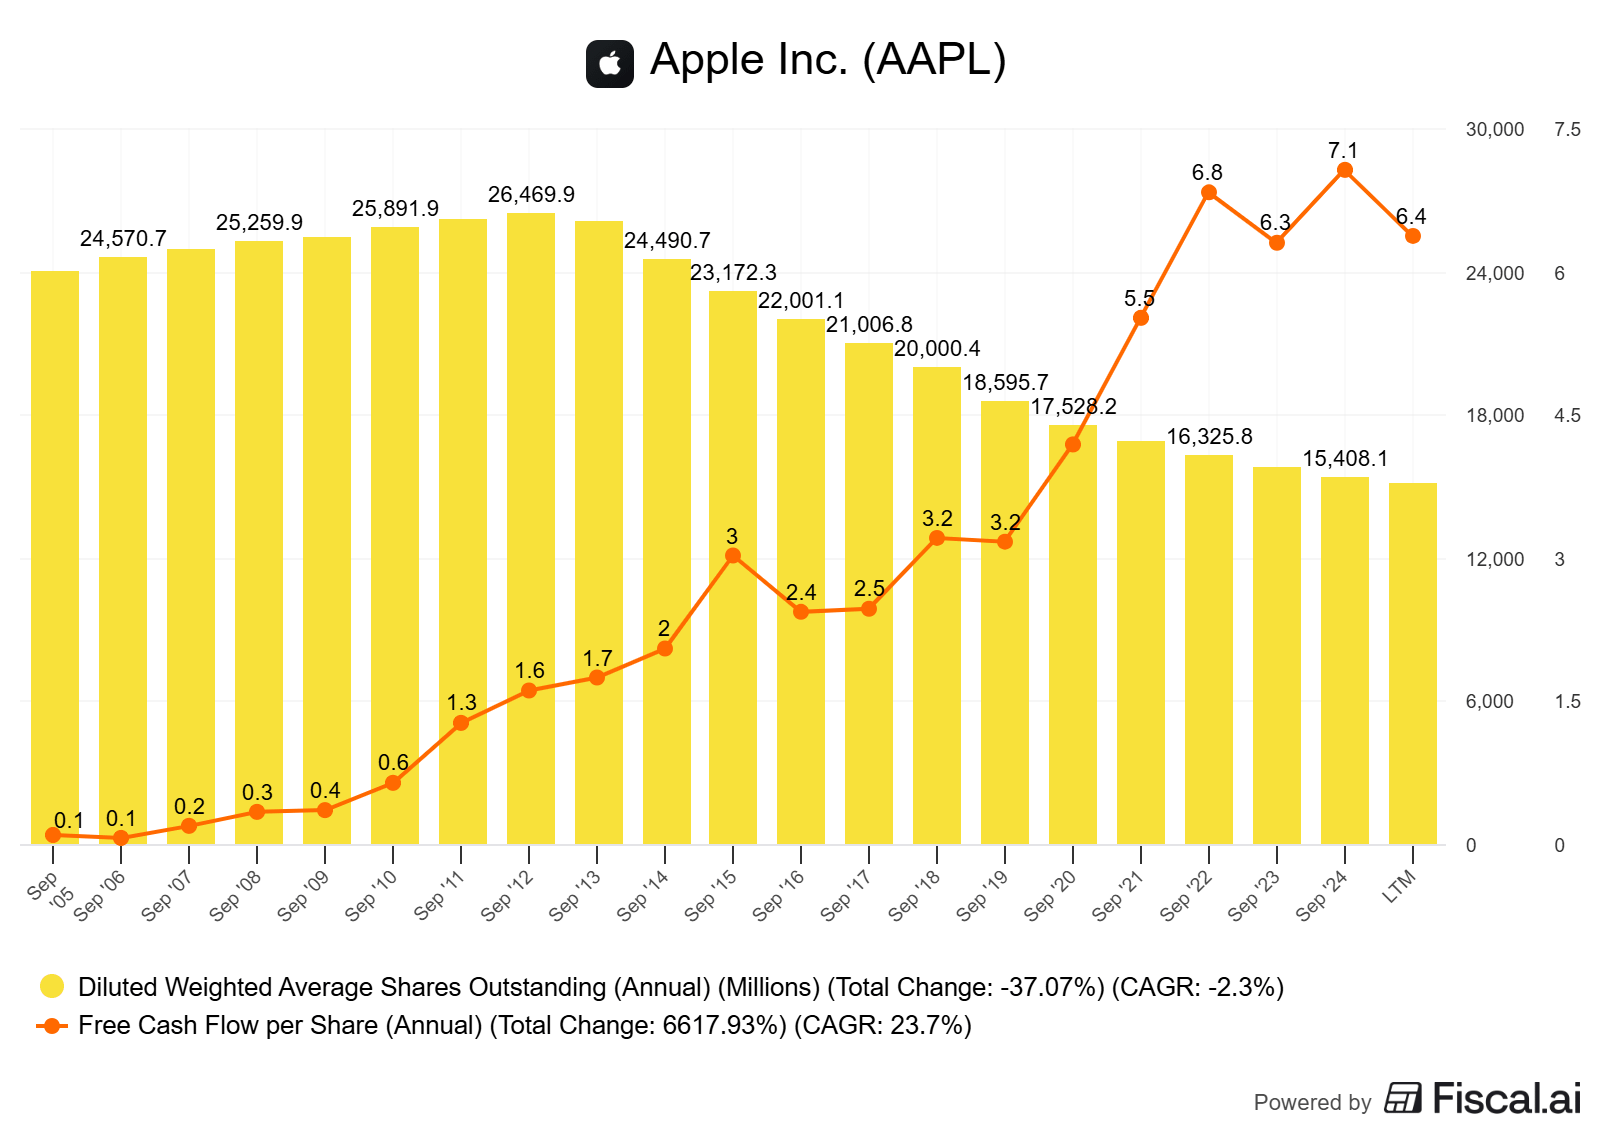
Per‑share compounding: reduced share count materially since 2012; numerous sources highlight cumulative repurchases (e.g., $467B buybacks through 2021 per CNBC, as of Jan 2022).
Balanced capital allocation: heavy buybacks plus steady dividend; reinvestment continues (R&D, capex, M&A) per filings.
Caveats and alternative interpretations
Buyback timing vs intrinsic value: headline authorization amounts don’t guarantee value‑accretive execution. Cross‑check buyback dollars versus contemporaneous valuation multiples.
SBC dilution: ensure net share count is falling after stock‑based comp; check “stockholders’ equity—share repurchases” and SBC notes in the 10‑K.
Services mix durability: monitor price increases, churn, regulatory actions, and platform risk.
Working capital: a negative CCC is an advantage but can compress if bargaining power shifts.
Sources:
Apple FY2024 10‑K (year ended Sep 28, 2024) for audited financials and segment disclosures (SEC filing link: SEC; as of FY2024).
Apple Newsroom press release on Q2 FY25 results and $100B repurchase authorization (Apple Newsroom; as of May 1, 2025).
Historical buyback context: CNBC (as of Jan 2022); early program expansions in 2013 and 2014.
How to do this yourself
Data to gather (primary sources first)
Filings: 10‑K/20‑F, 10‑Q — Income statement, balance sheet, cash flow, share repurchases, SBC footnotes.
Investor relations/newsroom — dividend changes, buyback authorizations, capital return commentary.
Market data (for EV/FCF): share price, shares outstanding, net debt.
Exact checks/calculations
ROIC:
NOPAT = Operating income × (1 – effective tax rate).
Invested capital = Total equity + total debt – cash and equivalents – non‑operating assets (approximation).
Use average invested capital over the period.
WACC:
Cost of equity from CAPM or implied; cost of debt from interest expense/tax rate; capital structure weights from market values.
FCF and conversion:
FCF = Operating cash flow – capital expenditures.
FCF margin = FCF / Revenue; FCF conversion = FCF / Net income.
Per‑share:
FCF/share = FCF / diluted weighted average shares.
EPS (from filings) and diluted shares (time series).
Share count trend: shares outstanding at period end and diluted W.A. shares.
Working capital metrics:
DSO = AR / Revenue × 365; DIO = Inventory / COGS × 365; DPO = AP / COGS × 365; CCC = DSO + DIO – DPO.
Valuation bands:
EV/FCF and EV/EBIT versus 5–10y medians; plot current vs history.
SBC:
SBC expense from cash flow statement; shares granted/withheld; compare SBC to FCF and to buyback dollars.
Decision rules and thresholds
ROIC – WACC > 5% for ≥5 years; ideally ≥10%.
FCF conversion > 90% over a cycle; FCF margin stable or rising.
Net share count falling 2–4% per year without levering to unhealthy levels (Net Debt/EBITDA < 1.5× unless cash flows are ultra‑defensive).
Buyback Quality Test: yes on all four—excess FCF funded, below intrinsic value, anti‑dilutive after SBC, not crowding out high‑ROIC reinvestment.
Moat evidence: margins stable through shocks; negative/declining CCC; retention/pricing power metrics steady.
Pitfalls and false positives
EPS mirage: EPS up solely from buybacks while FCF/share stagnates.
Debt‑funded buybacks at peak multiples; levered recap without durable cash flows.
ROIC inflated by under‑investing (decaying competitive position hidden by near‑term numbers).
SBC leakage: heavy SBC neutralizes buybacks; share count doesn’t fall despite large repurchases.
One‑off working capital tailwind (temporary payables spike) misread as sustainable FCF strength.
Checklist / one‑pager
ROIC – WACC spread ≥ 5% 5–10y
Reinvestment runway: clear, with similar economics
FCF conversion ≥ 90% over cycle; FCF margin stable
Per‑share: FCF/share and EPS up; diluted shares down 2–4%/yr
Buyback Quality Test: pass all four gates
SBC < 25% of FCF and fully offset by repurchases
CCC stable/negative; margin bands resilient
EV/FCF and EV/EBIT near/below long‑term medians (preferable for buyback accretion)
Balance sheet conservative (net cash or modest net debt)
Capital allocation scorecard shows discipline (clear ROIC hurdle and sequencing)
Mini‑FAQ
Q1: Are buybacks always good?
No. They create value only when funded by excess FCF, executed below intrinsic value, and not displacing high‑ROIC reinvestment.
Q2: What if ROIC is high but shrinking?
A shrinking spread to WACC suggests returns are normalizing. Size the runway and assume mid‑cycle margins to avoid overpaying.
Q3: How do I treat cash hoards?
Exclude true excess cash from invested capital when computing ROIC; consider net cash in EV/FCF and balance sheet safety.
Q4: Should I use reported or adjusted FCF?
Start with reported (OCF – capex). Adjust only for recurring, clearly identified items. Stay consistent across years.
Q5: What’s a quick red flag on per‑share compounding?
Rising SBC with flat share count (buybacks merely offset dilution) and FCF/share stagnation.
Glossary
ROIC: After‑tax operating profit divided by invested capital.
WACC: Weighted average cost of debt and equity capital.
FCF: Operating cash flow minus capital expenditures.
FCF conversion: FCF as a percentage of net income.
Cash conversion cycle (CCC): DSO + DIO – DPO; lower/negative is better.
SBC: Stock‑based compensation; non‑cash expense that can dilute shareholders.
Intrinsic value: Present value of future cash flows; what the business is worth.
Reinvestment runway: Capacity to deploy incremental capital at attractive returns.
Further reading
Apple Newsroom: Capital return updates and quarterly results — Apple Newsroom (check Q2 FY25 release; as of May 1, 2025)
SEC Filings (10‑K/10‑Q) — Apple IR SEC Filings (as of latest filings)
Historical buybacks context — CNBC: Apple and buybacks (as of Jan 2022)
References
Apple Inc. Form 10‑K, fiscal year ended September 28, 2024 — SEC Filing (as of FY2024)
Apple Newsroom, “Apple reports second quarter results” (includes $100B repurchase authorization and capital returns) — Apple Newsroom (as of May 1, 2025)
Apple Newsroom, “Apple More than Doubles Capital Return Program” — Apple (2013) (as of Apr 23, 2013)
Apple Newsroom, “Apple Expands Capital Return Program to Over $130 Billion” — Apple (2014) (as of Apr 23, 2014)
CNBC, “Apple’s rise to $3 trillion market cap shows the value of its massive share buybacks” — CNBC (as of Jan 3, 2022)
Disclaimer
Educational content, not investment advice.