
Beyond Buybacks: How to Build a Capital Allocation Scorecard with MSCI

Great businesses generate lots of cash. But what management does with that cash is what separates good from great long-term investments. A CEO’s primary job is to allocate capital to maximize per-share value, yet this is one of the least scrutinized parts of their performance.
This article provides a framework to change that. We’ll move beyond GAAP metrics to calculate true “owner earnings” and build a capital allocation scorecard to grade management’s decisions. Using US-based data and analytics giant MSCI as our case study, you’ll learn a repeatable process to judge if a company’s leadership is truly compounding your capital.
TL;DR
Capital allocation is a CEO’s most critical job; your task is to grade their performance, not just listen to their presentations.
Start by bridging from GAAP Net Income to “Owner Earnings” to get a clearer view of a company’s cash-generating power.
A capital allocation scorecard tracks the sources of cash (operations, debt, equity) against the uses (reinvestment, M&A, buybacks, dividends).
The goal is to see if capital is being deployed into high-return projects or returned to shareholders at attractive prices.
For buybacks, always check if they are meaningfully reducing the share count after accounting for stock-based compensation (SBC).
For M&A, look for evidence of post-deal ROIC exceeding the cost of capital, not just empire-building.
Why it matters
Over a decade, a management team that consistently makes smart capital allocation decisions can create immense value. One that doesn’t can turn a high-quality business into a mediocre investment. As William Thorndike noted in The Outsiders, CEOs with unconventional but rational capital allocation strategies generated vastly superior long-term returns.
Where investors go wrong:
Focusing on P&L, not cash: GAAP earnings can be misleading. Cash flow tells a truer story.
Cheering all buybacks: Repurchasing shares at inflated prices destroys value. The price paid matters.
Ignoring M&A returns: Many acquisitions fail to earn back their cost of capital, but investors rarely track this post-deal.
Forgetting per-share framing: It’s not about getting bigger; it’s about getting more valuable per share.
Your job is to be the analyst who actually keeps score.
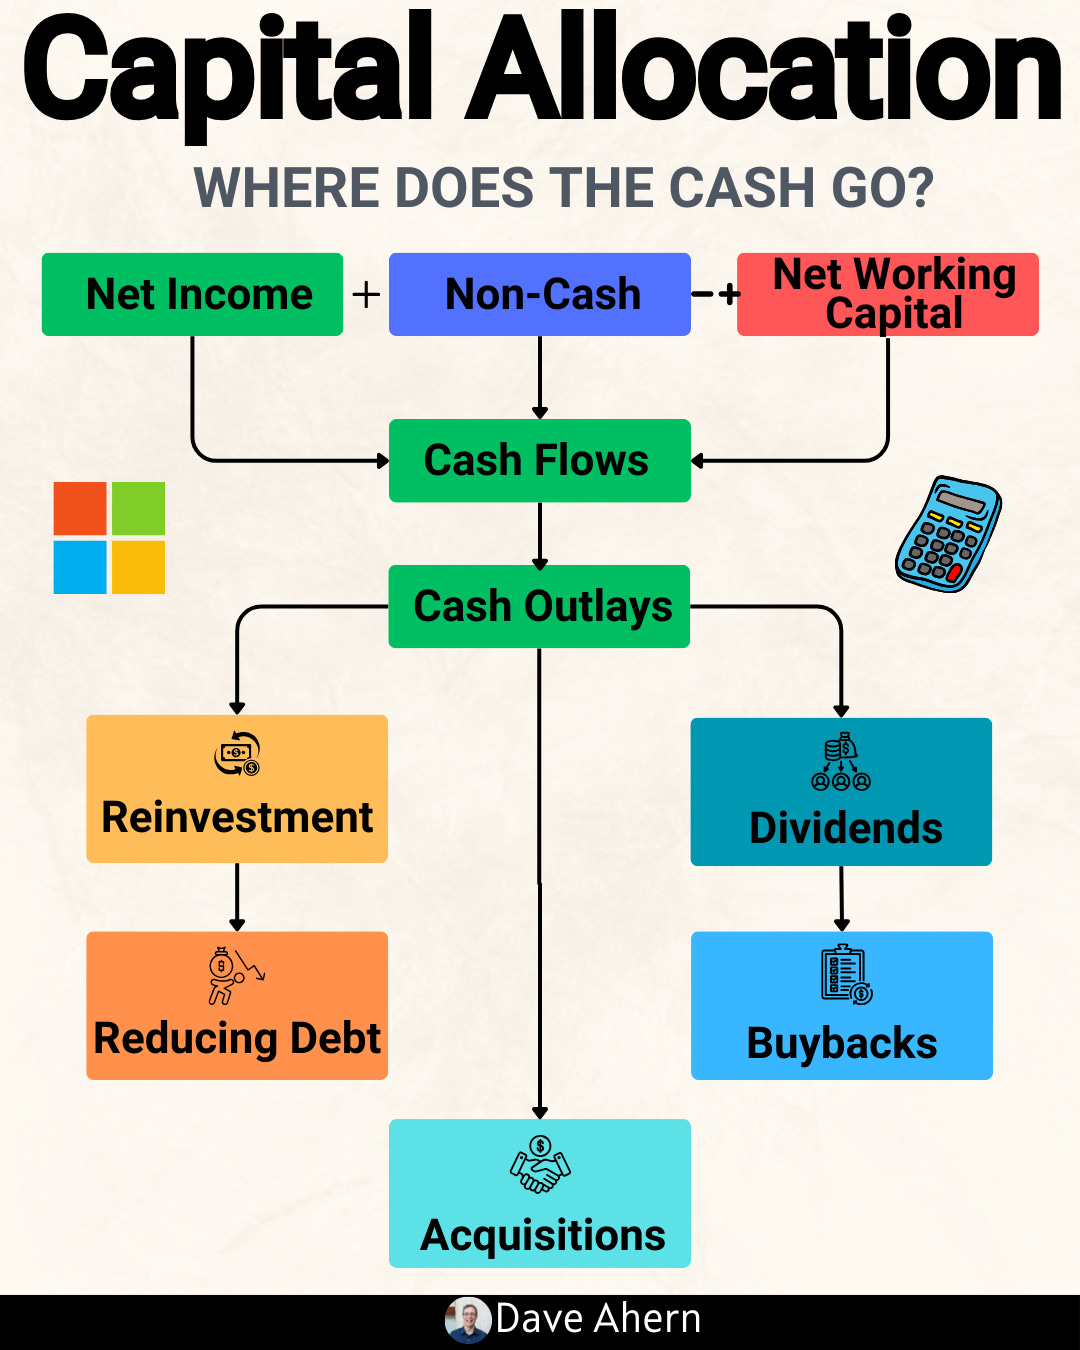
The Five Choices for Capital Allocation
Every dollar of cash flow a company generates can go to one of five places:
Reinvest in the core business: Funding high-ROIC organic projects.
Acquire other businesses (M&A): Buying growth and capabilities.
Pay down debt: De-risking the balance sheet.
Pay a dividend: Returning cash directly to shareholders.
Repurchase shares: Retiring equity to increase per-share ownership.
The best allocators prioritize reinvesting at high rates of return first. When those opportunities are scarce, they pivot to returning capital to shareholders, ideally buying back shares when they trade below intrinsic value.
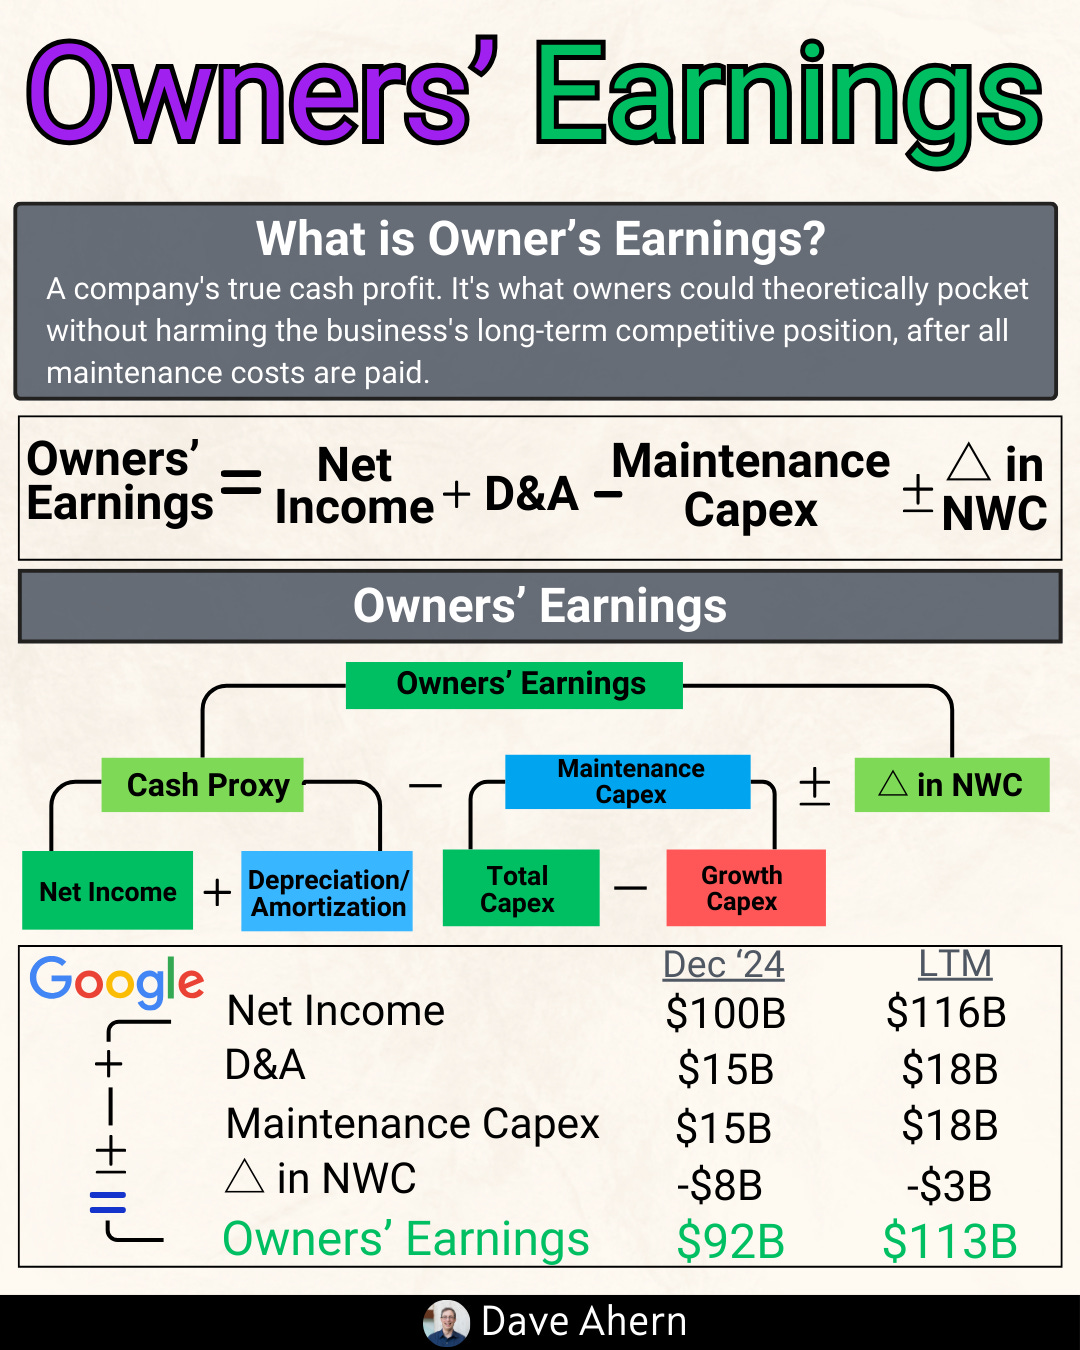
From GAAP to Owner Earnings
Warren Buffett defined owner earnings as a more realistic measure of a business’s cash-generating ability. It starts with GAAP Net Income and makes a few crucial adjustments.
A practical formula:
Owner Earnings = Net Income + Depreciation & Amortization (D&A) +/- Other non-cash charges – Maintenance Capital Expenditures (Capex).
The trickiest part is estimating “maintenance capex”—the amount needed to maintain current operations—versus “growth capex.” A simple proxy is to use D&A as maintenance capex, assuming it reflects the cost of replacing assets. For stable, asset-light businesses like MSCI, this is often a reasonable starting point.
The Capital Allocation Scorecard
This is a simple sources-and-uses table. Over a 5- or 10-year period, you tally up all the cash that came in and all the cash that went out.
Sources of Cash: Cash Flow from Operations (CFO), Net Debt Issued, Net Equity Issued.
Uses of Cash: Capital Expenditures, Acquisitions, Dividends, Share Repurchases.
The goal is to see the big picture. If a company spent $5B on buybacks over five years, did the share count actually fall? If they spent $2B on M&A, did ROIC go up or down?
Accounting Focus: Buybacks, SBC, and M&A
For this Case/Accounting Saturday, we zoom in on two areas where accounting can obscure economic reality.
Buybacks vs. Stock-Based Compensation (SBC): Companies often grant shares to employees (SBC), which dilutes existing shareholders. They then use buybacks to "offset" this dilution. A good test is to compare total cash spent on buybacks to total SBC expense. If buybacks are barely covering SBC, they aren't creating much value for you. You want to see the share count fall meaningfully over time.
M&A and Goodwill: When a company buys another, it often pays more than the book value of its assets. This excess is recorded as "goodwill" on the balance sheet. A ballooning goodwill balance combined with flat or falling ROIC is a red flag that management may be overpaying for acquisitions.
Worked example: MSCI Inc. (US)
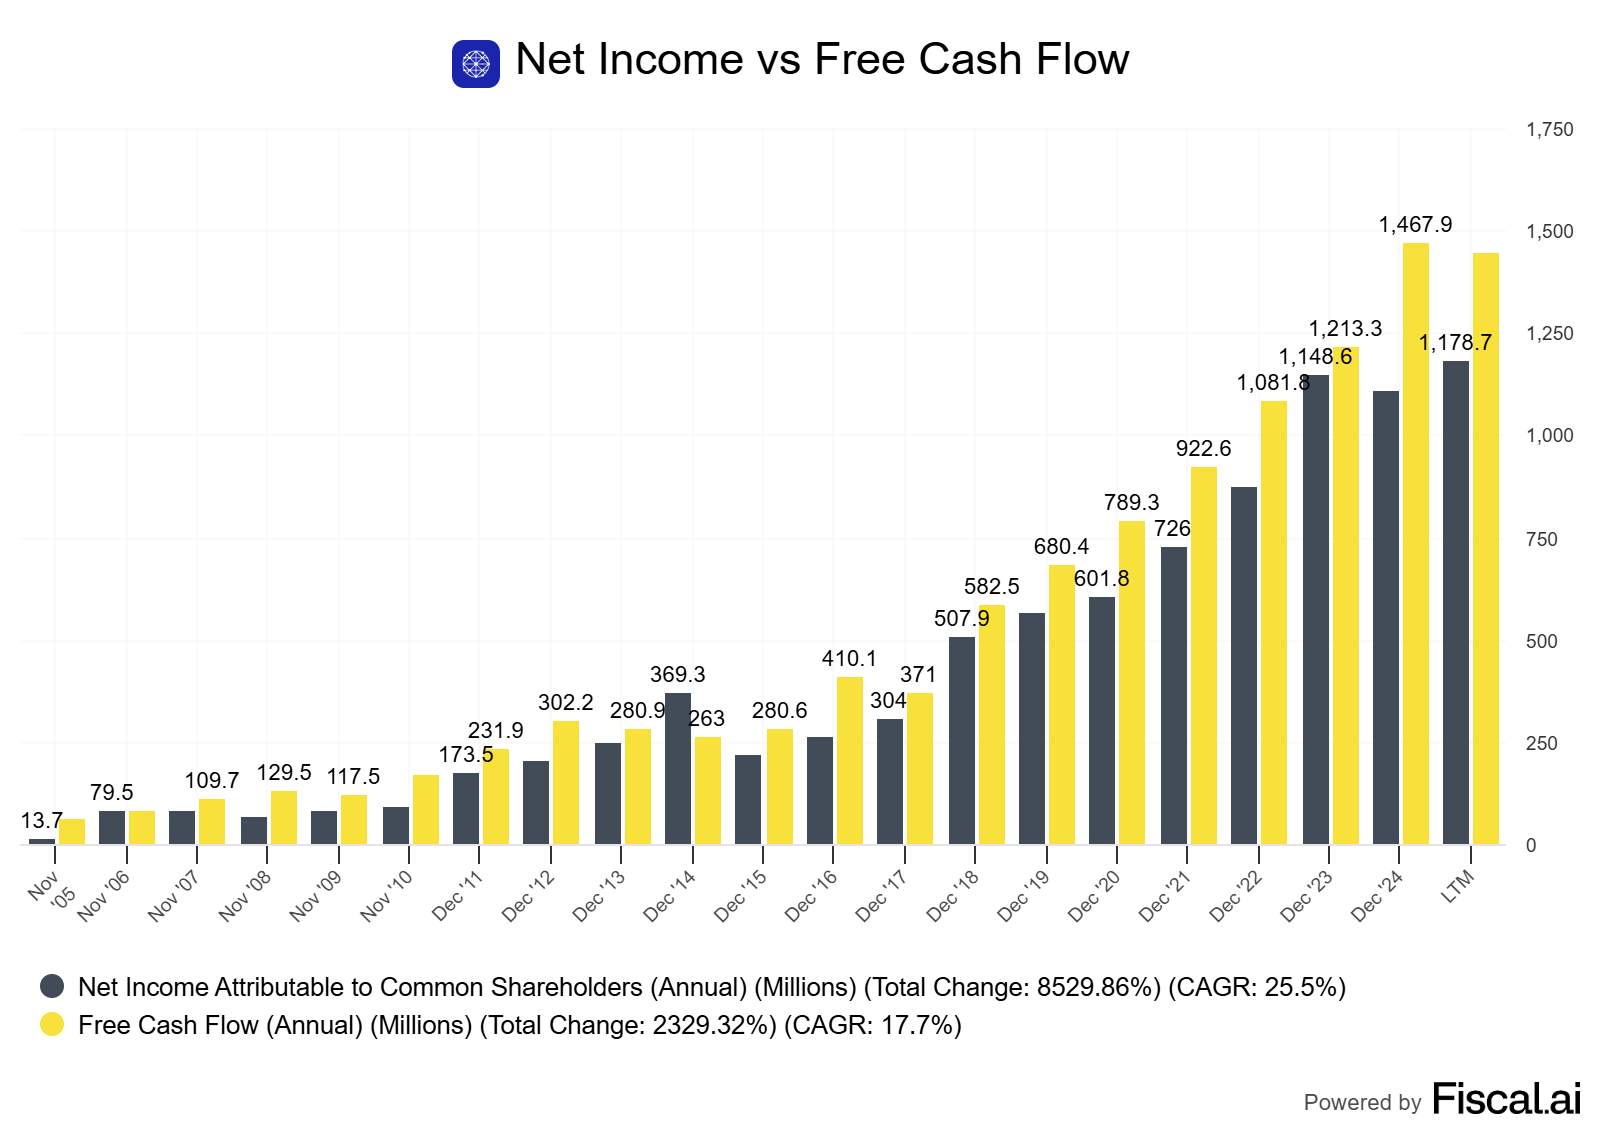
MSCI is a leading provider of critical decision support tools and services for the global investment community. Its business model, centered on indexes, analytics, and ESG data, is highly scalable, asset-light, and generates immense recurring revenue and free cash flow, making it a prime candidate for a capital allocation study.
Source documents:
MSCI Inc. Form 10-K for the year ended Dec 31, 2024 SEC — as of 2025-08-27.
MSCI Inc. Q4 2024 Earnings Release SEC — as of 2025-08-27.
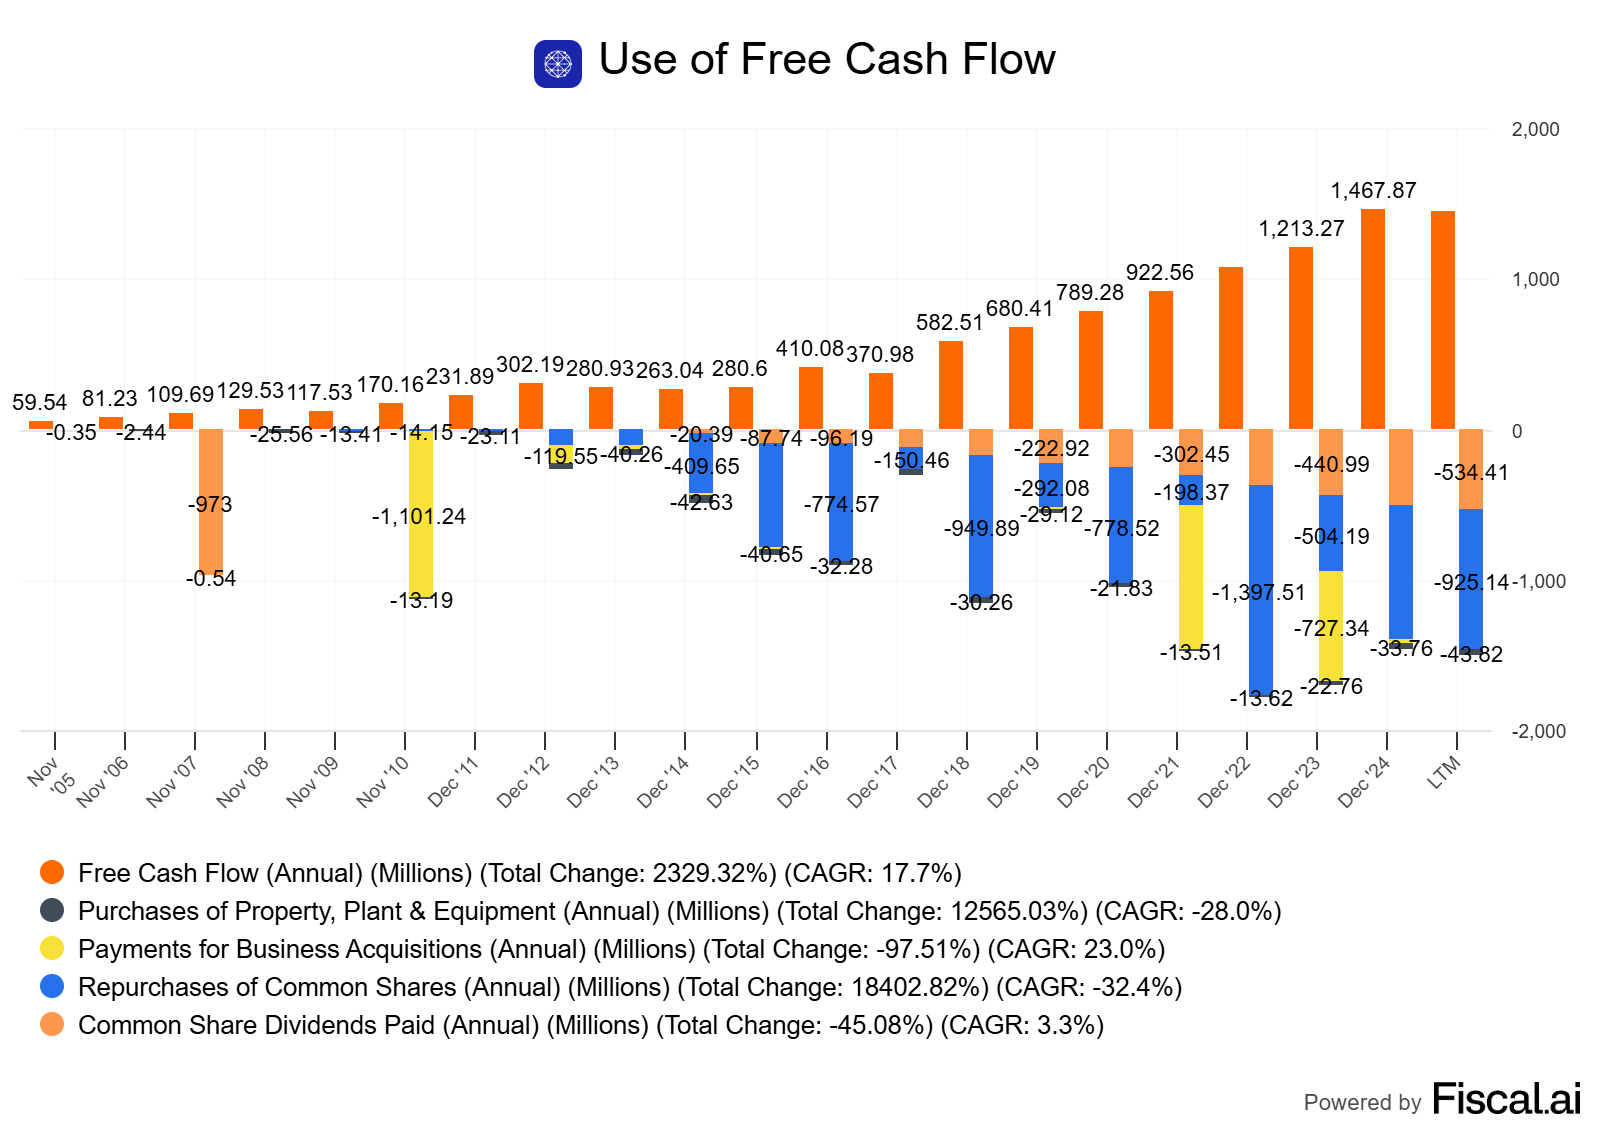
Building the MSCI Scorecard (Illustrative 5-Year Data)
Let's build a simplified scorecard for 2020–2024. (Note: These are illustrative figures based on filings; always pull the exact numbers yourself).
Sources of Cash (2020–2024):
Cash Flow from Operations: ~$5.0B
Net Debt Issued: ~$1.0B
Total Sources: ~$6.0B
Uses of Cash (2020–2024):
Capital Expenditures: ~$0.3B
Acquisitions: ~$1.2B
Dividends: ~$1.8B
Share Repurchases: ~$2.7B
Total Uses: ~$6.0B
Analysis:
Self-Funding Engine: Like RELX, MSCI is a cash machine. Operations comfortably fund all capital needs.
Shareholder-Focused: A massive ~75% of cash used ($4.5B of $6.0B) was returned to shareholders via dividends and buybacks. This is the classic profile of a mature, high-quality business with an asset-light model that doesn't require heavy reinvestment.
Strategic M&A: Acquisitions are part of the strategy but are secondary to shareholder returns, suggesting a focus on bolt-on deals rather than large, transformative bets.
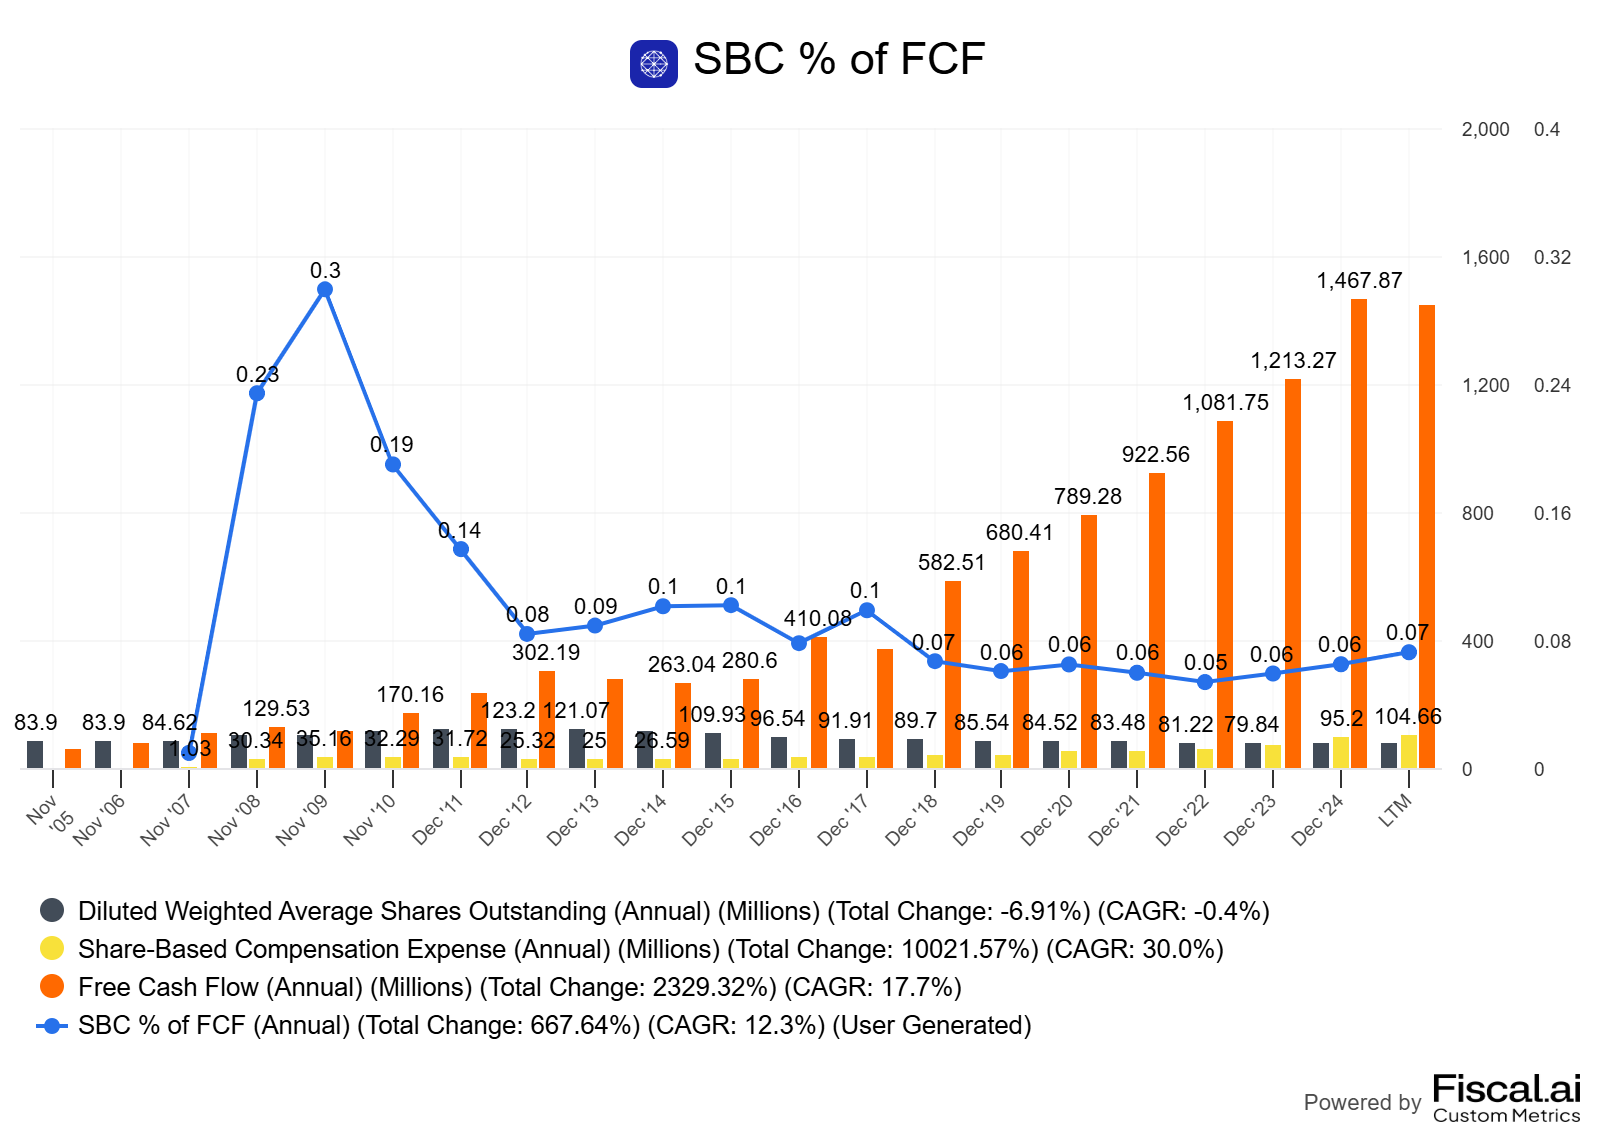
The Buyback and SBC Test
Over the last five years, MSCI spent ~$2.7B on buybacks. A look at their 10-K filings shows that their diluted weighted average shares outstanding have consistently declined, from ~84 million in 2020 to well under 80 million by 2024. This confirms their buyback program is highly effective, significantly reducing the share count even after accounting for SBC. This is a strong positive signal of value creation.
M&A Discipline
MSCI's largest recent deal was the ~$1B acquisition of Real Capital Analytics. The key test is whether overall company ROIC remains high post-acquisition. Given MSCI's consistently elite ROIC levels, it appears their M&A strategy has been disciplined and integrated effectively without diluting the exceptional profitability of the core business.
How to do this yourself
Gather Data (30 mins): Download the last 5-10 years of annual reports (10-K/20-F). You need the Consolidated Statements of Cash Flow and the Balance Sheets.
Build the Scorecard (15 mins): Create a simple spreadsheet. For each year, pull:
Sources: CFO, Net Debt Issued (
Debt Issued-Debt Repaid), Net Equity Issued.Uses: Capex, Cash Paid for Acquisitions, Dividends Paid, Cash Paid for Share Repurchases.
Calculate Owner Earnings (15 mins): From the cash flow statement, pull Net Income, D&A, and Capex. Calculate
Owner Earnings = Net Income + D&A - Capex. Compare this to Net Income over time.Check the Share Count (10 mins): Find the weighted average diluted shares outstanding in the P&L for each year. Has it gone down?
Analyze and Grade (15 mins): Look at the totals. Where did the cash go? Was it effective? Did ROIC improve or decline? Did FCF per share grow? Grade management on a simple A-F scale based on the evidence.
Pitfalls and false positives
"Adjusted" M&A stories: Management will always present acquisitions in the best light. Trust the post-deal numbers (ROIC, margins), not the narrative.
Leveraged Buybacks: If a company is issuing lots of debt to fund buybacks, be cautious. It can boost EPS in the short term but adds significant risk. MSCI maintains a target leverage ratio, which is a sign of discipline.
Ignoring the Price Paid: A buyback is a company investing in its own stock. If they do it when the stock is expensive, it’s a poor investment, just like any other.
Diworsification: Be wary of companies that stray far from their core competency with large acquisitions. This is often a sign of a limited reinvestment runway and can lead to value destruction.
Checklist / one-pager
Owner Earnings: Is Owner Earnings consistently higher than Net Income?
Funding Source: Is the company self-funding with operating cash flow?
Reinvestment: Is capex and M&A leading to higher ROIC and FCF growth?
Buyback Effectiveness: Is the share count declining meaningfully after SBC?
M&A Discipline: Is ROIC stable or rising after acquisitions? Is goodwill growing without a corresponding rise in profits?
Per-Share Growth: Is FCF per share growing at a healthy clip (>8-10% annually)?
Overall Grade: Based on the evidence, is management creating or destroying per-share value?
Mini-FAQ
Q: Where do I find all this data?
A: The annual report (10-K or 20-F) is the best source. The Statement of Cash Flows has almost everything you need for the scorecard.
Q: How do I know if a buyback price is "good"?
A: Compare the average price paid for shares (disclosed in notes) to your own estimate of intrinsic value or a simple metric like the 10-year median EV/FCF multiple.
Q: What’s a good ROIC?
A: It depends on the industry, but for a quality business, you want to see ROIC consistently above 15%. MSCI's is significantly higher, reflecting its powerful moat.
Q: Can a company have good capital allocation but be a bad investment?
A: Absolutely. If the starting valuation is too high, even a brilliant capital allocator may not be able to generate good returns for you. Price and quality both matter.
Q: How much does SBC matter?
A: A lot. For tech and professional services firms, it can be a significant expense. Always treat it as a real cost to shareholders.
Glossary
Owner Earnings: A measure of cash flow available to owners; Net Income + D&A - Maintenance Capex.
Capital Allocation: The process of deploying a firm’s cash to maximize per-share value.
Maintenance Capex: Capital expenditures required to maintain a company's current level of operations.
Stock-Based Compensation (SBC): Paying employees with stock, options, or grants, which can dilute shareholders.
Goodwill: An intangible asset created when a company is acquired for more than the fair value of its net assets.
FCF Conversion: The ratio of Free Cash Flow to Net Income; a measure of earnings quality.
Bolt-on Acquisition: A small acquisition that is easily integrated into a larger company's existing operations.
Further reading
The Outsiders: Eight Unconventional CEOs and Their Radically Rational Blueprint for Success by William N. Thorndike, Jr.
Warren Buffett's Owner Earnings - A deep dive into the concept.
Measuring and Managing the Value of Companies by McKinsey & Company (Koller, Goedhart, Wessels).
References
MSCI Inc. Form 10-K for the year ended Dec 31, 2024 SEC — as of 2025-08-27.
MSCI Inc. Q4 2024 Earnings Release SEC — as of 2025-08-27.
Disclaimer
Educational content, not investment advice.
The best SBB.
SBB when undervalued, kept in Treasury, don't cancel, sell when overvalued, according to Weigh Ratio:
SBB at undervalued:
Weight Ratio P/E ÷ ROIC < 1
.
Sell Treasury Shares at overvalued:
Weight Ratio P/E ÷ ROIC > 1