
Apple’s Per-Share Flywheel: How FCF/share and Buybacks Compound Value

Buybacks are often labeled as “financial engineering.” Sometimes they are. But when a company earns returns above its cost of capital and converts those returns to cash, retiring shares accelerate per-share compounding.
Apple is a masterclass in that flywheel, and a great template for judging buybacks in any quality business.
TL;DR
Quality lens: value creation = sustained ROIC above WACC, strong FCF conversion, and reinvestment discipline. Buybacks are beneficial only after positive NPV reinvestment is funded.
Per-share framing beats headline growth. Track FCF/share, EPS/share, and diluted share count. Give credit only for net reductions after SBC dilution.
Apple’s decade of buybacks coincided with high margins, solid FCF conversion, and steadily falling share count—amplifying per-share economics (S&P DJI buyback data, as of Oct 7, 2024).
Decision rules: prioritize ROIC – WACC > 5% for years, FCF conversion > 80% mid-cycle, and net share count falling ≥2–3%/yr without starving growth capex.
Pitfalls: conflating EPS growth with economic value, ignoring SBC, using trough/peak margins, and crediting repurchases at rich valuations.
Why it matters
Quality investors are rewarded when a business creates value and reduces the denominator per share. That means:
Generate high returns on invested capital (ROIC) above the weighted average cost of capital (WACC).
Convert accounting profits into free cash flow (FCF).
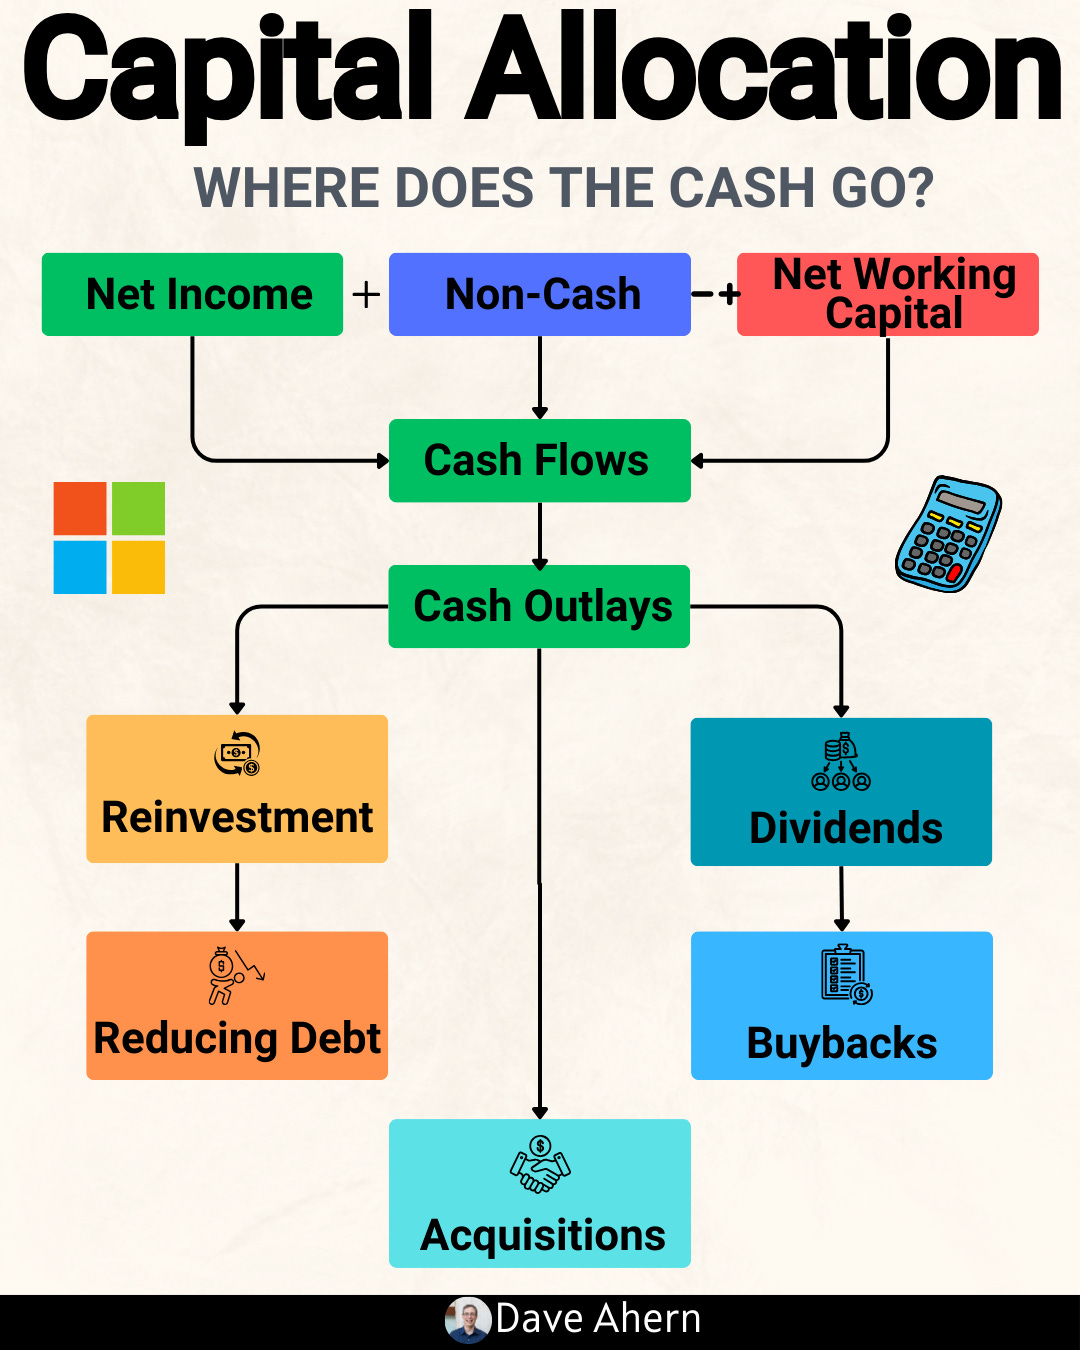
Reinvest in positive-NPV opportunities first; then return surplus cash via buybacks or dividends.
Focus on per-share economics, not corporate vanity metrics.
Where investors go wrong:
Treating repurchases as inherently good, regardless of ROIC, reinvestment needs, or valuation.
Ignoring stock-based compensation (SBC) and net dilution.
Confusing EPS growth with real value creation.
Assuming past margins are perpetually sustainable without testing moat durability.
Core concepts (quality lens)
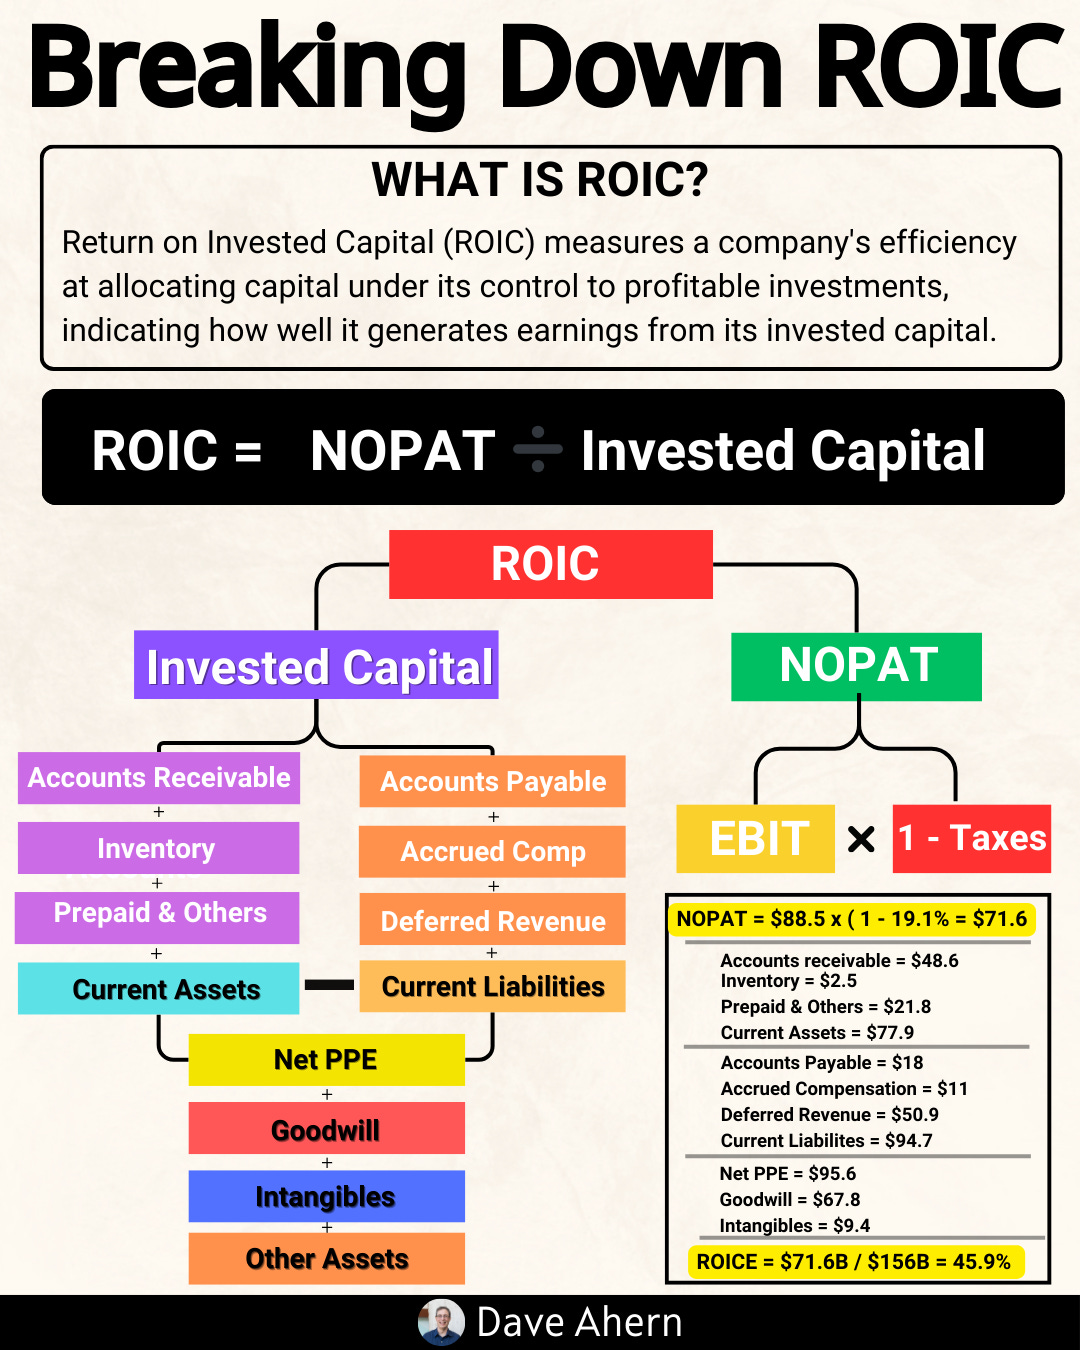
ROIC vs WACC
ROIC: after-tax operating profit divided by invested capital. A core signal of economic value creation.
WACC: blended investor-required return for debt and equity.
Decision rule: durable value creation typically needs ROIC – WACC > 5% sustained across a cycle.
Reinvestment runway and capital intensity
Reinvestment runway: the availability of projects to deploy capital at high incremental returns.
Capital intensity: how much capital is required to grow. Low intensity with high ROIC is powerful.
Decision rule: fund organic growth at high incremental ROIC, then evaluate buybacks vs alternatives.
Unit economics and per-share metrics
Unit economics: GAAP profit can hide poor cash economics. Track FCF conversion and working capital efficiency.
Per-share lens: FCF/share, EPS/share, and diluted share count show owner outcomes.
Decision rule: FCF conversion > 80% mid-cycle is robust for asset-light businesses; track stability.
Moat durability and evidence (not claims)
Evidence: pricing power (stable or rising ASPs), retention and ecosystem lock-in, switching costs, supply chain scale, brand equity, and high services attach.
For Apple, Services growth and installed base metrics support durability; test against competitive intensity (Android OEMs, regulators).
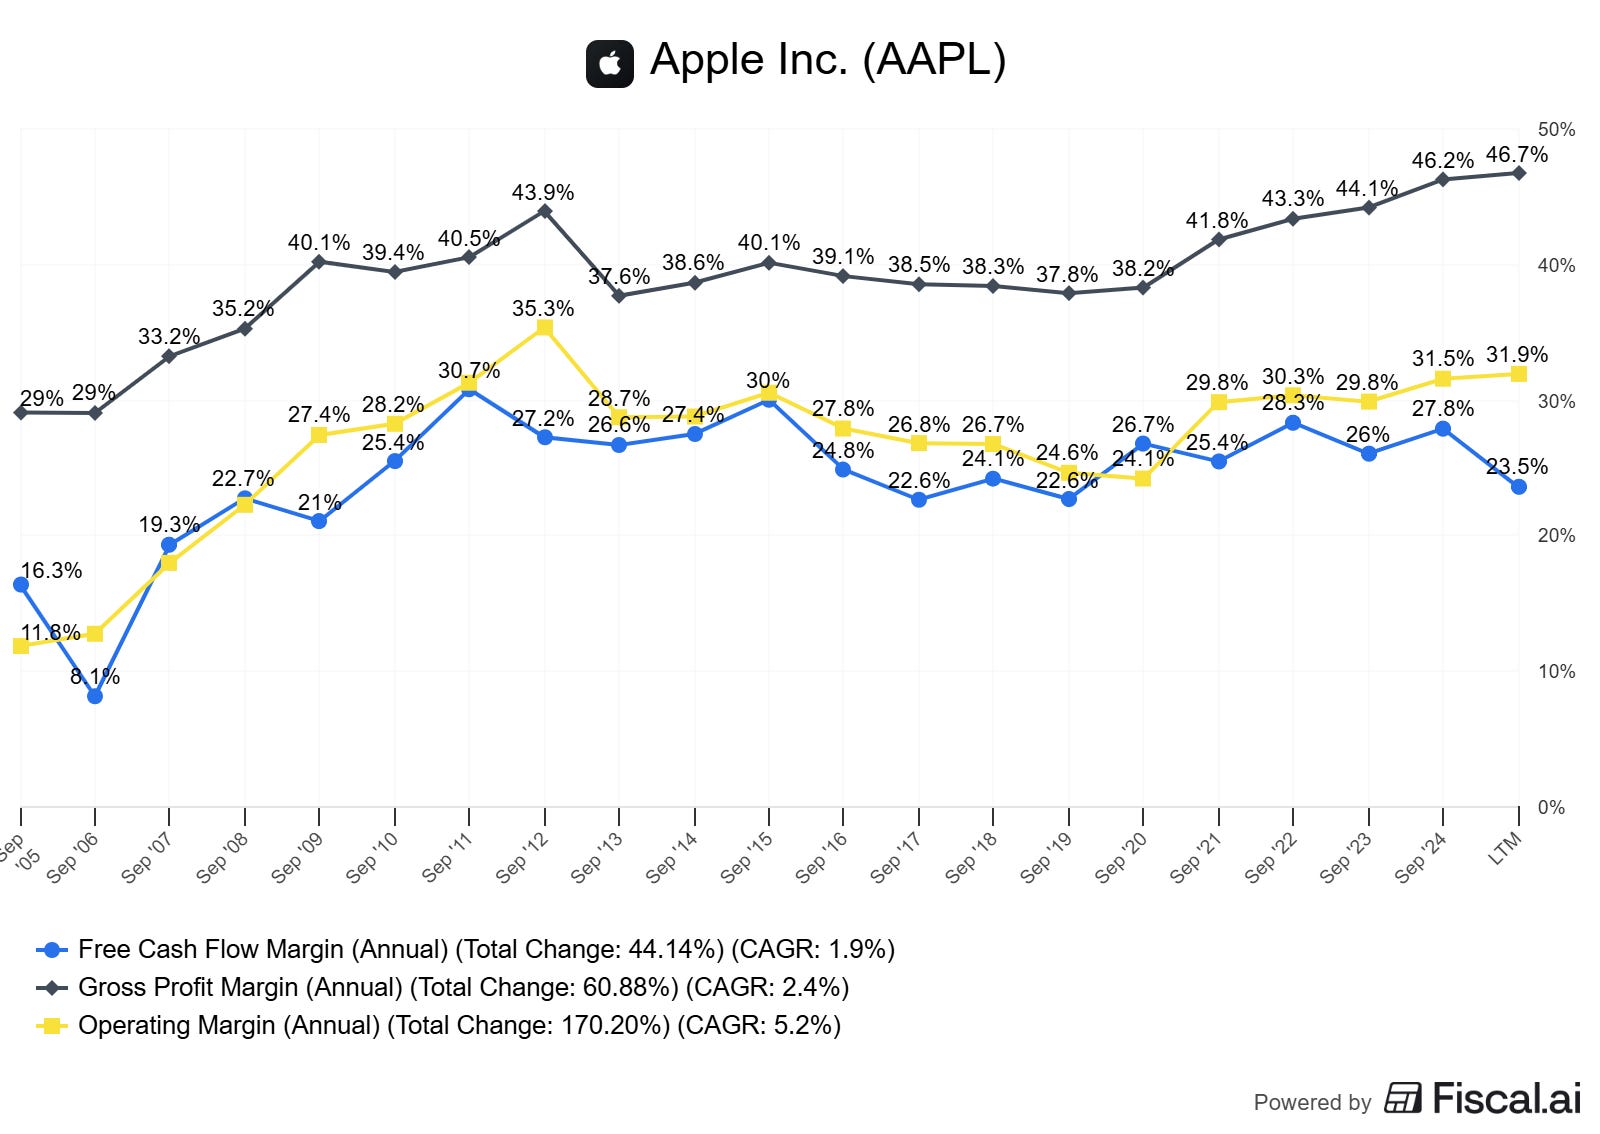
Decision rule: favor businesses with stable gross and operating margin bands across cycles and consistent returns above WACC.
Worked example: Apple and per-share compounding
Why Apple?
Mid-cap+? It’s mega-cap, yes—but it’s also a gold standard for disciplined capital returns and per-share framing.
Repurchases at scale: Apple has spent approximately $687 billion on buybacks over the past decade and $96.3 billion over the 12 months ending June 2024 (S&P Dow Jones Indices press release, as of October 7, 2024).
Cash generation that funds both growth and capital returns. Apple reported approximately $27B operating cash flow in the September quarter alone (Apple Newsroom Q4 FY2024 press release, as of Oct 31, 2024).
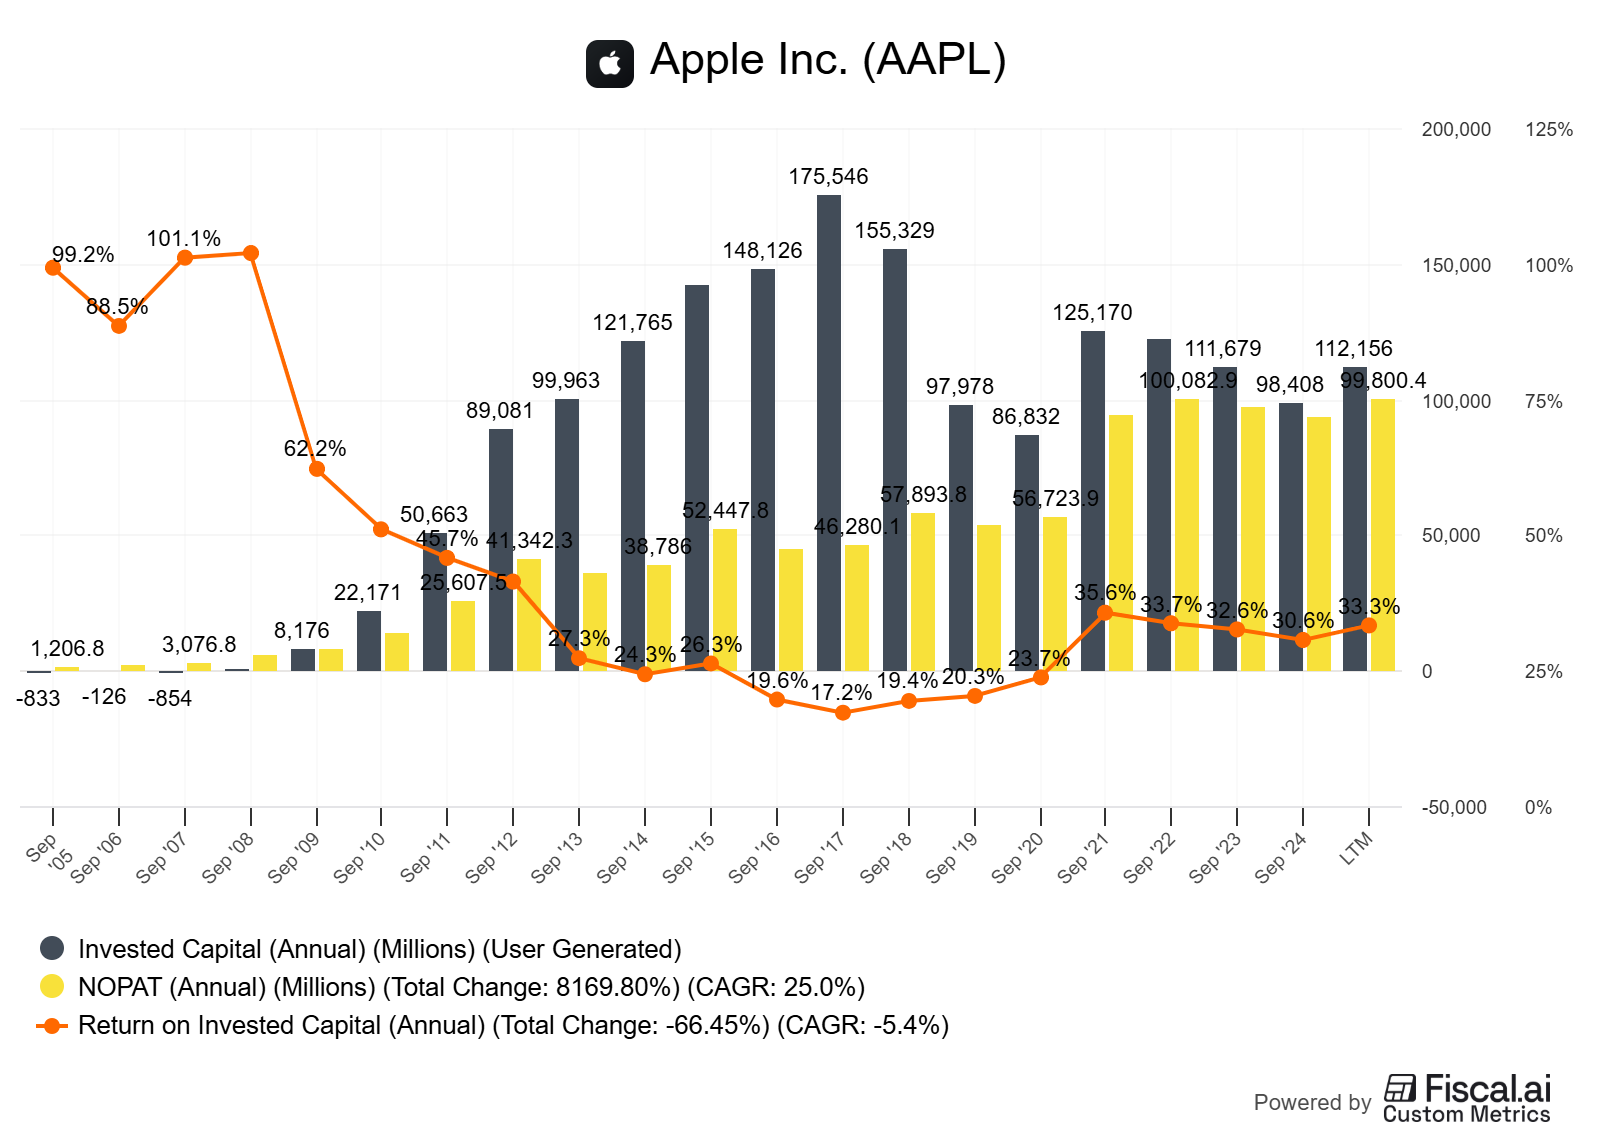
What the 5–10 year trends show (conceptual summary; see chart markers below):
ROIC > WACC for years, with stable to rising gross margins and solid operating margins, implying consistent value creation (range FY2015–FY2024; Apple FY2024 10-K).
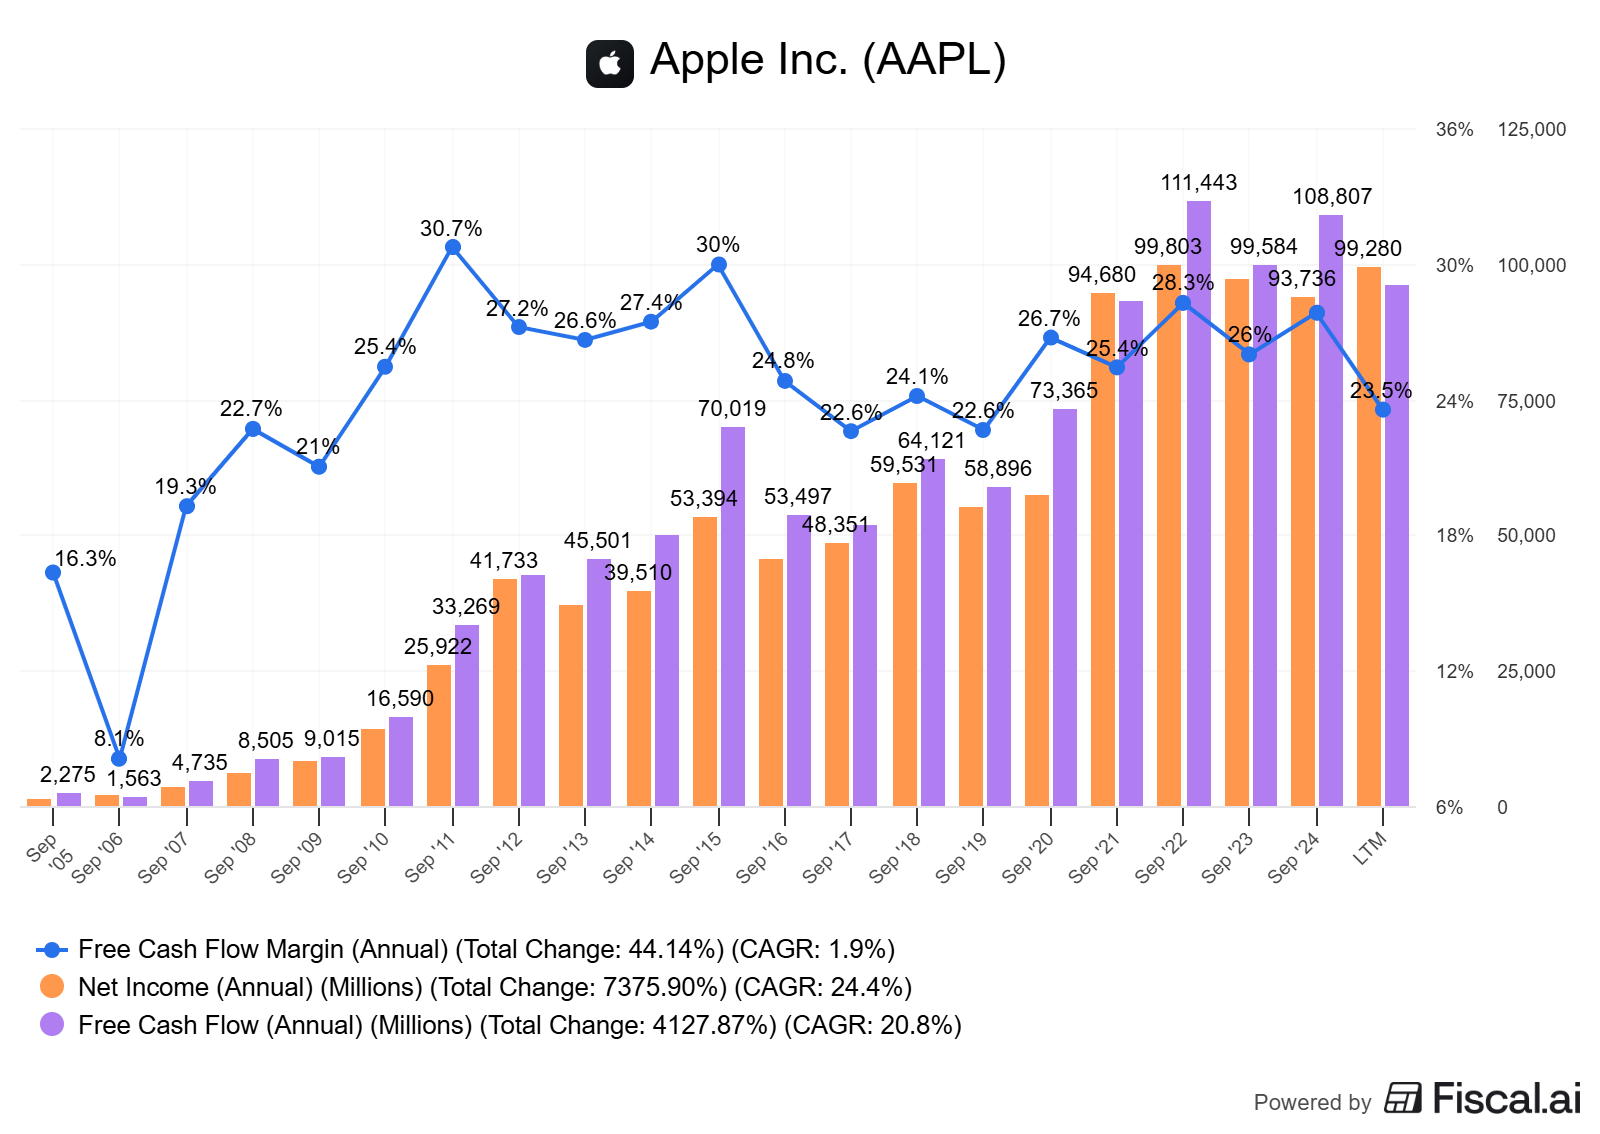
Strong FCF conversion and healthy FCF margins; Services mix expanded, improving resilience of cash flows.
Diluted share count declined materially over a decade, amplifying FCF/share and EPS/share growth even in periods of modest revenue growth.
Capital returns: recurring repurchase authorizations, scaled execution over time, and ongoing dividends.
Per-share compounding and buybacks, net of SBC:
Apple’s diluted share count has fallen dramatically since the early 2010s; third-party analyses estimate a reduction of around 40% from FY2012 to FY2022, illustrating the scale effect of persistent buybacks (Forbes analysis, as of October 31, 2022). Always cross-check against the company’s latest diluted shares outstanding in the 10-K or 10-Q.
SBC at Apple is lower as a percentage of revenue than many software peers, but you should still adjust your per-share math for net buybacks after SBC. In other words, give credit only for diluted share count reductions that persist over 1–3 years.
Caveats and alternative interpretations:
Repurchases at elevated multiples can reduce future IRR vs dividends or reinvestment.
Services growth strengthens resilience, but faces regulatory scrutiny and platform policy risks.
Hardware cycles, competitive intensity in China, and component costs can pressure margins.
Tax and regulatory changes (e.g., buyback excise tax) can alter capital return calculus (S&P DJI, as of Oct 7, 2024).
How to do this yourself
Step-by-step workflow:
Gather filings and base data
Company 10-K/20-F and 10-Qs for the last 5–10 years (income statement, cash flow, balance sheet, diluted shares, SBC, capex, working capital). Source: company IR and SEC.
Segment revenue and margin trends were disclosed, along with installed base metrics.
Market data for EV, share count, and price to compute EV/FCF and EV/EBIT history.
Calculate core metrics
ROIC: choose a consistent definition (NOPAT / average invested capital). Consider capitalizing R&D if you want a more economic view.
WACC: use a reasonable range; sensitivity matters more than false precision.
FCF: operating cash flow – capex; consider “owner earnings” by subtracting maintenance capex and treating SBC as a real cost.
Per-share: compute FCF/share and EPS/share using diluted shares. Track the 3-year CAGR.
Working capital: DSO, DIO, DPO and cash conversion cycle (CCC).
Valuation context: EV/FCF and EV/EBIT vs 5–10y medians.
Decision rules and thresholds
ROIC – WACC: prefer sustained > 5%. A positive and stable spread is your first green flag.
FCF conversion: target > 80% mid-cycle for asset-light or mixed hardware/services models.
Per-share compounding: FCF/share CAGR > 8–10% without multiple expansion reliance.
Buyback quality: net share count down ≥ 2–3% per year for ≥ 3 years after SBC; do not see debt rising unsustainably to fund repurchases.
Debt prudence: interest coverage remains robust; no crowding out of growth investments.
Valuation discipline: buybacks near or below your conservative DCF or compared to long-term EV/FCF medians.
Evidence of moat durability
Stable margin bands through cycles; pricing power; retention; switching costs; ecosystem lock-in; supply chain advantages; services attach rates.
Build your visuals
Recreate the chart markers listed here with your data. Keep “as of” dates on every chart.
Pitfalls and false positives
EPS mirage: headline EPS growth driven by buybacks without growth in owner earnings.
Ignoring SBC: repurchases that merely offset SBC do not improve per-share economics.
Peak/trough distortion: judging conversion at a cyclical extreme; always normalize.
Debt-funded buybacks at high multiples: leverage risk with poor repurchase ROI.
Narrow ROIC definitions: excluding intangible investments (like R&D) can overstate returns.
Checklist / one-pager
ROIC – WACC > 5% for 5+ years?
FCF conversion > 80% mid-cycle and stable?
Per-share metrics: FCF/share and EPS/share CAGRs > 8–10%?
Diluted share count falling ≥ 2–3%/yr net of SBC?
Buybacks valuation-aware (vs 5–10y EV/FCF median and your intrinsic value)?
No crowd-out of high-IRR projects; capex and R&D funded appropriately?
Moat evidence: margin bands stable, retention high, switching costs real?
Balance sheet remains strong; interest coverage high?
Transparent capital allocation commentary from management?
Glossary
ROIC: Return on invested capital; NOPAT divided by invested capital.
WACC: Weighted average cost of capital; blended investor-required return.
FCF: Free cash flow; operating cash flow minus capital expenditures.
FCF conversion: FCF divided by net income; shows earnings-to-cash efficiency.
SBC: Stock-based compensation; non-cash expense but economically dilutive.
Owner earnings: Buffett’s term; a cash proxy after maintenance capex and working capital.
CCC: Cash conversion cycle; time to turn inventory and receivables into cash net of payables.
EV/FCF: Enterprise value divided by free cash flow; a valuation ratio.
Further reading
Apple FY2024 Q4 results press release (Oct 31, 2024) for recent cash flow and capital return context: Apple Newsroom
Apple FY2024 Form 10-K for segment, margins, cash flows, SBC, and capital returns: SEC 10-K filing
S&P Dow Jones Indices on buyback trends and concentration (Oct 7, 2024): S&P DJI Press Release
Historical analysis on Apple’s buyback program and share count trends (contextual, older): Forbes analysis
References
Apple Inc., Form 10-K for fiscal year ended Sep 28, 2024 (as of Oct 2024): SEC filing
Apple, “Apple reports fourth quarter results” press release (as of Oct 31, 2024): Apple Newsroom
S&P Dow Jones Indices, “S&P 500 Q2 2024 Buybacks…” press release (as of Oct 7, 2024): S&P DJI
Forbes, “Apple’s Stock Buyback Program Benefits Will Slow” (contextual, as of Oct 31, 2022): Forbes
Educational content, not investment advice.