

Leggett & Platt raised its dividend for 52 straight years. Then, on April 30, 2024, the board cut it from $0.46 to $0.05 per share in a single announcement. An 89% haircut, and the end of a Dividend King.
Here’s the part most investors miss: the warning signs sat in plain sight for six quarters.
And it keeps happening. The last nine months delivered a wave of cuts, and the same signals showed up before nearly every one of them.
In today’s post, we will discuss:
The recent wave of cuts, and what it cost shareholders
Why dividend streaks can’t protect you
The five warning signs that show up before a cut
How to run a 15-minute mid-year checkup on your dividend holdings
What this checklist can’t tell you
Okay, let’s dive in and learn how to spot a dividend cut before it hits your portfolio.
The scoreboard: nine months of cuts
Income investors have taken a beating since last fall. A sample of the damage, with the one-day stock reaction where the market got to vote:
Alight (ALIT): dividend eliminated in February 2026, stock down 38%
Horizon Technology Finance (HRZN): monthly payout cut 45% (from $0.11 to $0.06), stock down 23%
Camping World (CWH): dividend paused in February 2026, stock down 17%
Diageo (DEO): interim dividend cut 51% (from $0.405 to $0.20 per share), stock down 16%
Baxter (BAX): quarterly dividend cut 94% (from $0.17 to $0.01) in November 2025
FMC (FMC): quarterly dividend cut 86% (from $0.58 to $0.08) in October 2025
Alexandria Real Estate joined in December 2025, cutting its quarterly dividend 45% (from $1.32 to $0.72 per share). Different companies, different industries, same shareholder outcome: the income disappeared and the stock got repriced in a single day.
The good news? Most of these cuts telegraphed themselves quarters ahead of time. Let’s learn how to read the signals.
Why streaks can’t protect you
A dividend cut hurts you twice.
Your income drops, which is bad enough. But the market also reprices the stock, because a cut signals the business can no longer support the payout. Look at that scoreboard again: double-digit one-day declines were the norm.
The streak is the trap. Investors see 52 years of increases and assume the 53rd is automatic. Boards feel the same pressure, which is why they keep paying long after the business stops supporting it. The streak becomes a reason to ignore the numbers.
Two definitions before we go further.
The payout ratio is dividends divided by net earnings. It tells you what portion of profit goes out the door to shareholders. Above 70% deserves attention. Above 100% means the company pays out more than it earns.
The free cash flow payout ratio is dividends divided by free cash flow (operating cash flow minus capital expenditures). This one matters more, because dividends are paid with cash, not accounting earnings.
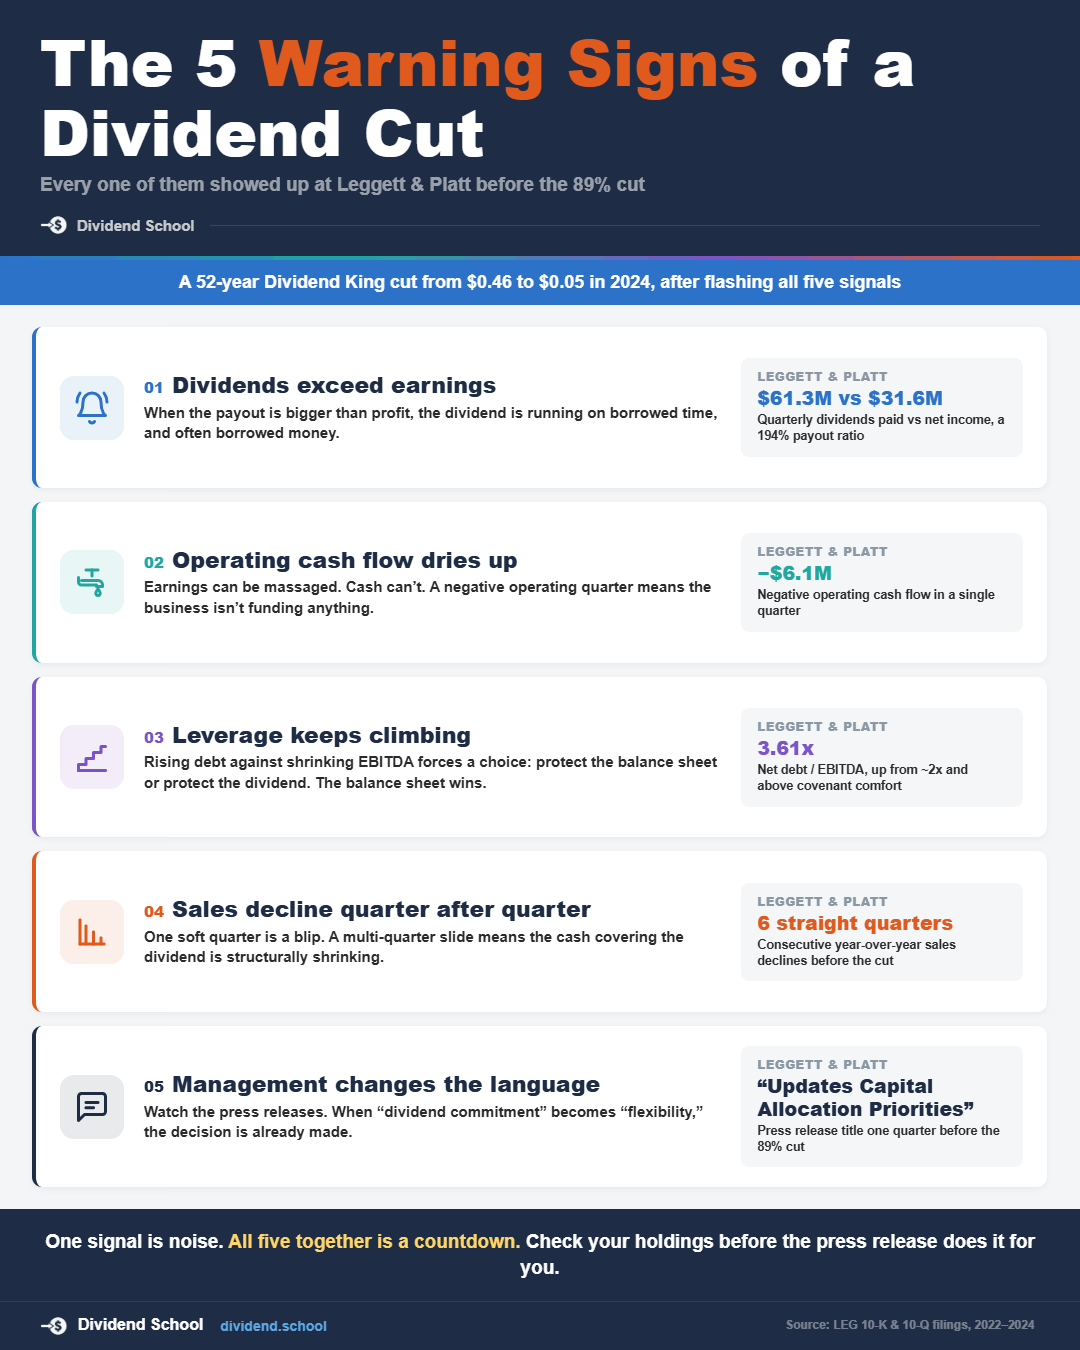
Now let’s walk through the five signs, using Leggett & Platt as our guinea pig. Every number below comes from the company’s Q1 2024 earnings release, filed as an 8-K with the SEC on April 30, 2024.
Sign 1: the dividend costs more than the company earns
This is the loudest alarm on the board.
In the first quarter of 2024, the same quarter the cut was announced, Leggett & Platt reported:
Net earnings: $31.6 million
Dividends paid: $61.3 million
The company paid out nearly twice what it earned. No business sustains that. The gap gets filled with cash on hand or borrowed money, and both wells run dry.
When you see a payout ratio above 100%, the question changes from “will they cut?” to “when?”
Sign 2: free cash flow can’t cover the check
Earnings can be massaged. Cash is harder to fake.
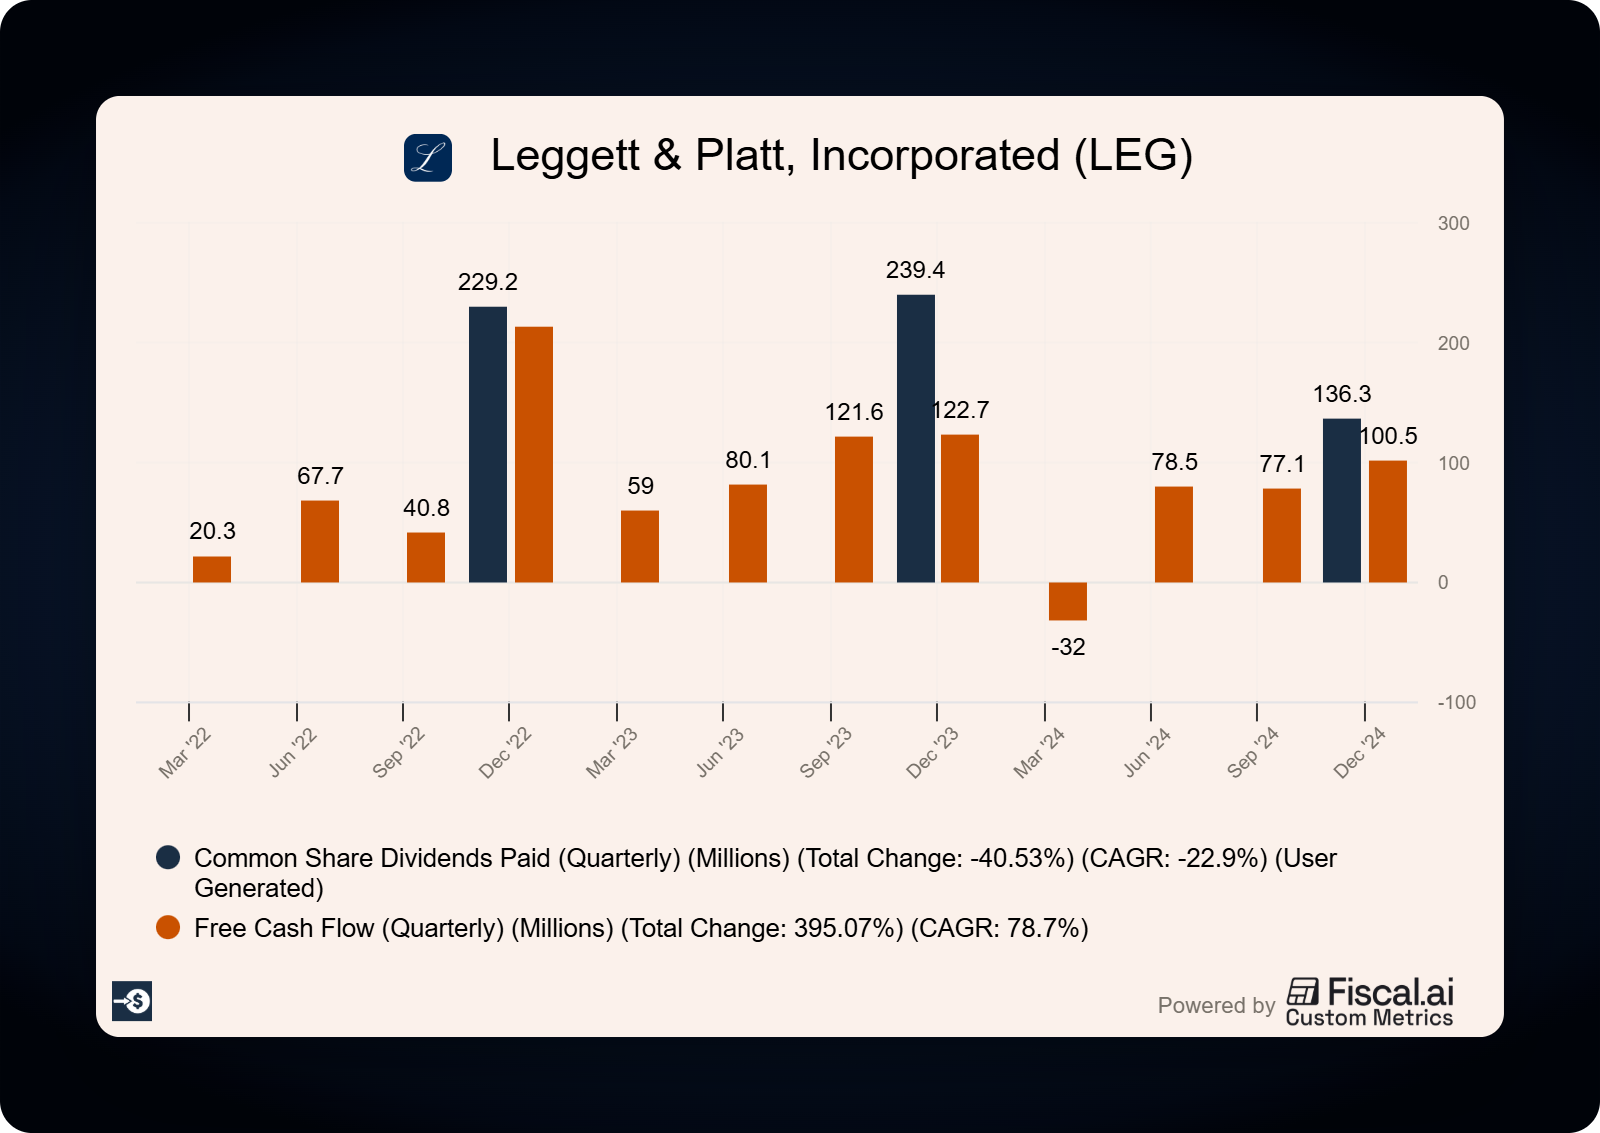
Leggett & Platt’s Q1 2024 cash flow statement showed operating cash flow of negative $6.1 million, a $103 million drop from the $96.7 million generated in Q1 2023. Add $26 million of capital expenditures on top, and free cash flow was deeply negative in the same quarter the company wrote a $61.3 million dividend check.
Think of it like a household paying the mortgage with a credit card. It works for a month or two. It does not work as a lifestyle.
One weak quarter of cash flow can be timing. The trend is what you watch. If free cash flow covers the dividend with room to spare year after year, you sleep well. If coverage keeps tightening, pay closer attention.
Do you want this checklist run on a real company every month? Do you want the filings read for you, with the math shown? Do you want it before earnings season instead of after?
Sign 3: debt climbs while earnings fall
Here’s where the pressure builds quietly.
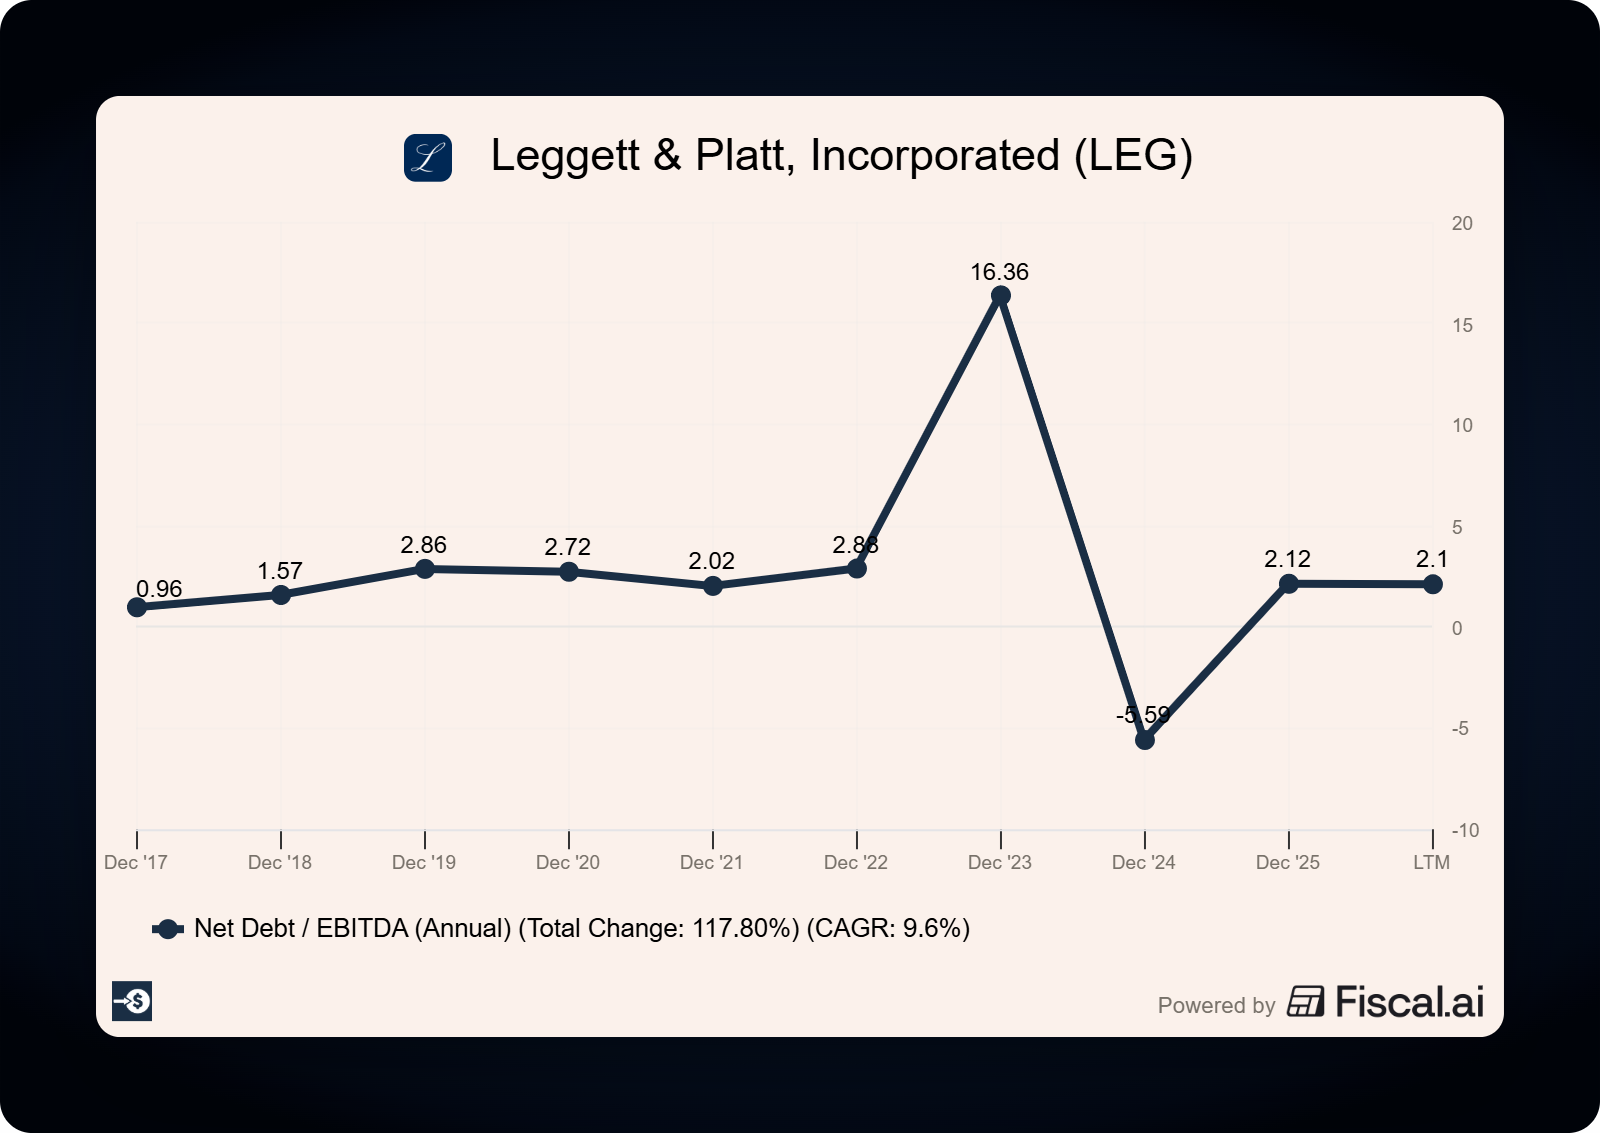
Leggett & Platt’s net debt to trailing adjusted EBITDA, straight from its own earnings releases:
Q4 2022: 2.66x
Q2 2023: 3.10x
Q4 2023: 3.16x
Q1 2024: 3.61x
Six quarters, and leverage climbed 36%. Total debt sat at $2.1 billion at March 31, 2024, with $300 million of notes maturing that November. The company also stated a long-term leverage target of 2.0x.
Read that combination out loud. Leverage rising, a debt wall approaching, and a stated target far below the current ratio. Something had to give, and the dividend was the biggest lever available. Cutting it freed up roughly $110 million a year (2024 dividend guidance dropped from $245 million to $135 million in the same release).
When management has to choose between the balance sheet and the dividend, the balance sheet wins. Every time.
The recent wave keeps proving the rule. FMC’s board said it cut the dividend “to further prioritize debt reduction” (FMC Q3 2025 earnings release, filed October 29, 2025). Baxter cut to a penny while working toward a net leverage target of roughly 3.0x by the end of 2026 through debt repayment (Baxter 2025 10-K). Camping World paused its dividend and pointed to its “focus on reducing net debt leverage” (Camping World 8-K, February 24, 2026). Three different businesses, one common thread: too much debt meeting too little cash flow.
Sign 4: sales shrink quarter after quarter
A dividend is a claim on future cash flows. Shrinking sales shrink that claim.
Leggett & Platt’s year-over-year sales growth, from the same 8-K:
Q4 2022: (10)%
Q1 2023: (8)%
Q2 2023: (8)%
Q3 2023: (9)%
Q4 2023: (7)%
Q1 2024: (10)%
Six straight quarters of decline, driven by weak demand in residential end markets. No single quarter looked catastrophic. The pattern was the problem.
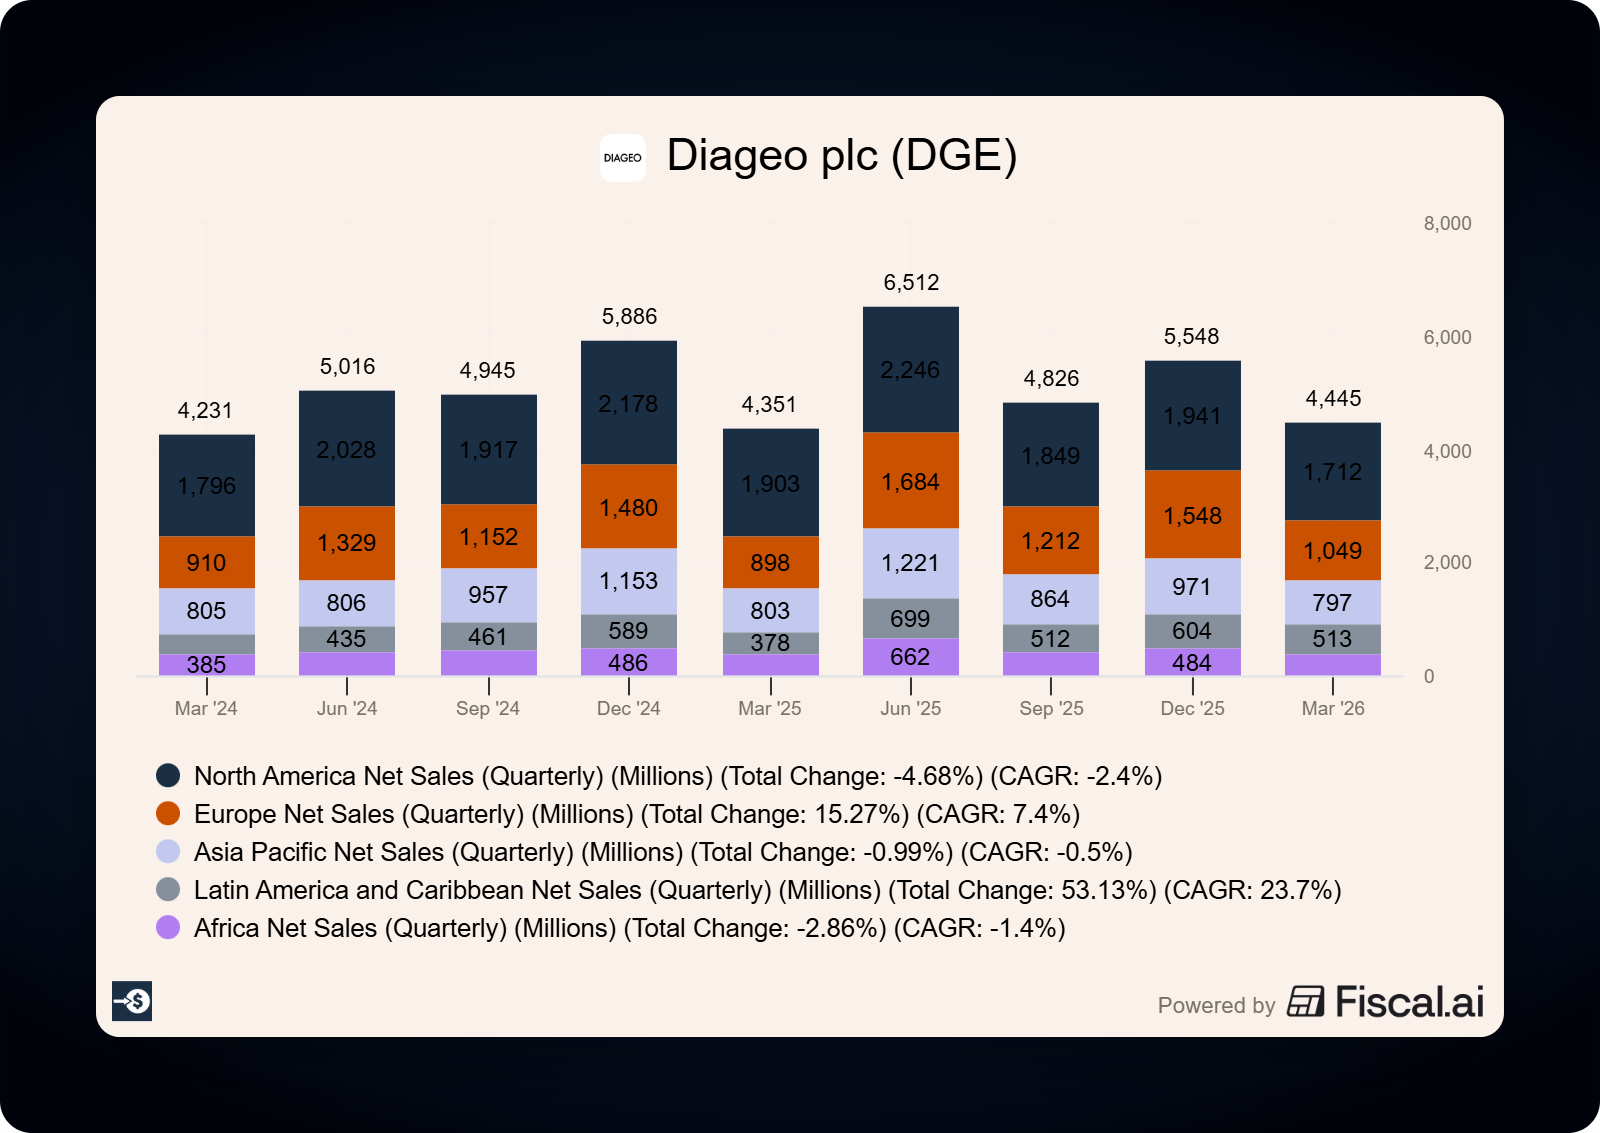
Diageo told the same story in 2026. When the spirits giant halved its interim dividend in February, the underlying numbers explained why (Diageo interim results, filed as a 6-K on February 25, 2026):
U.S. organic spirits net sales: down 9.3%
Tequila net sales: down 23.1%
Greater China net sales: down 42.3%
The board’s own words: the dividend was reduced “to accelerate the strengthening of the balance sheet and create more financial flexibility.”
A company can defend its dividend through one bad year with cost cuts and borrowing. It cannot defend it through a multi-year decline in the actual business.
Sign 5: management changes its vocabulary
This one costs you nothing but reading time, and it might be the most reliable tell of the five.
Before a cut, the language around the dividend shifts. Watch for phrases like “reviewing capital allocation priorities,” “balance sheet flexibility,” and “evaluating all options.” Leggett & Platt’s cut announcement was titled, in part, “Updates Capital Allocation Priorities.”
Walgreens ran the same play. The company cut its dividend from $0.48 to $0.25 in January 2024, then suspended it on January 30, 2025. The suspension announcement said management “continues to evaluate and refine its capital allocation policy” (Walgreens Boots Alliance 8-K, January 30, 2025). Walgreens had raised its dividend for 47 straight years before the streak ended.
The market gives you a tell too. When a stock’s yield climbs far above its own history and its peers, that’s the market pricing in a cut. A yield that looks too good to be true usually is. The price fell for a reason, and the sellers did the math before you did.
The business development company space proved this recently. Four BDCs cut between October 2025 and March 2026:
Monroe Capital (MRCC): cut 64% across two reductions ($0.25 to $0.18 to $0.09)
OFS Capital (OFS): cut 50% ($0.34 to $0.17)
Horizon Technology Finance (HRZN): monthly payout cut 45% ($0.11 to $0.06)
BlackRock TCP (TCPC): cut 32% ($0.25 to $0.17)
Every one of them sported a double-digit yield before the cut, while shrinking net investment income squeezed the cash that funds those payouts. Investors who bought the yield got the cut. And here’s the kicker: the stocks still fell hard on the announcements. A high yield priced in trouble, and the trouble arrived anyway.
Notice Monroe’s path, two cuts in three months. Walgreens followed the same script, cutting 48% in January 2024 before suspending a year later. The first cut is rarely the last.
Your July mid-year checkup
Here’s how I’d use this, and July is the perfect time. Half the year’s filings are in, and Q2 earnings are about to land.
Pull up each dividend payer you own and spend 15 minutes per company:
Open the latest 10-Q or 10-K on sec.gov and find the cash flow statement.
Compare dividends paid against net earnings. Flag anything above 70%. Above 100% is a red alert.
Compare dividends paid against free cash flow (operating cash flow minus capex). Same thresholds.
Check the debt trend. Is net debt to EBITDA rising over the last four to six quarters? Are big maturities coming due?
Check the revenue trend over the same stretch. One down quarter is noise. Four or more is a pattern.
Read the last two earnings releases and count the capital allocation language.
One flag means watch closely. Three or more flags means decide now, on your terms, before the board decides for you.
What this checklist can’t tell you
I want to be honest about the limits here.
First, it can’t catch everything. Walgreens’ suspension announcement cited litigation and debt refinancing as key cash needs. Legal liabilities of that size don’t show up cleanly in a payout ratio.
Baxter is the humbling recent example. The company cut its quarterly dividend from $0.17 to $0.01 in November 2025 with a payout ratio around 33% of adjusted earnings ($0.68 in annual dividends against $2.05 in fiscal 2025 adjusted EPS), a level this checklist would have called safe. Management simply decided that reaching its 3.0x leverage target mattered more than the payout. A safe-looking ratio measures capacity, and boards can change priorities regardless of capacity.
(The GAAP numbers told a messier story: Baxter’s fourth quarter included a $485 million goodwill impairment. Adjusted earnings hid what reported earnings revealed, which is its own lesson.)
Second, some cuts come from strength, or at least from prudence. Alexandria Real Estate cut its quarterly dividend 45% in December 2025, from $1.32 to $0.72 per share, to preserve approximately $410 million of annual liquidity while guiding 2026 FFO to $6.25 to $6.55 per share (Alexandria 8-K, December 3, 2025). The new dividend is well covered by that FFO. Painful for income investors, yes, but a different animal than a company paying out money it doesn’t have.
Third, watch your metrics by sector. For REITs like Alexandria, earnings payout ratios are nearly useless because depreciation distorts net income. Use FFO or AFFO coverage. For banks, watch regulatory capital ratios alongside the payout.
The checklist narrows your focus. It doesn’t replace reading the filings.
The checklist, ready to save
Payout ratio above 70% of earnings? Above 100%?
Free cash flow covering the dividend, with the trend improving or tightening?
Net debt to EBITDA rising over four to six quarters? Big maturities ahead?
Revenue declining for four or more straight quarters?
Capital allocation language creeping into earnings releases?
Yield far above the company’s own history and its peers?
The takeaway: dividend cuts announce themselves quarters in advance to anyone reading the cash flow statement, so read it before the board does the math for you.
You now have the same five-sign checklist that flagged Leggett & Platt six quarters before the cut. The newsletter does this every week: one investing concept, taught with real numbers from real filings. If that’s useful, subscribe and the next one lands in your inbox. Free, and you can leave anytime.
As always, thank you for taking the time to read today’s post, and I hope you find something of value on your investing journey.
If I can further assist, please don’t hesitate to reach out.
Take care and be safe out there,
Dave