
5 Dividend Stocks Near 52-Week Lows: How to Tell the Bargains From the Traps
Quality names near their lows, plus the 3-question screen that separates a bargain from a trap

The best dividend bargains rarely feel like bargains when you buy them.
They feel scary. The chart points down, the headlines are negative, and the crowd is busy buying something else. That discomfort is usually the price of admission for a quality company on sale.
Today I want to walk you through five dividend payers trading well below where they normally trade, and more importantly, how I decide a stock is actually cheap and not just falling. These are ideas to research, not a buy list to act on blindly. The goal is for you to run this screen yourself the next time the market hands you a sale.
In today’s post, we will discuss:
How I decide a dividend stock is undervalued
Why buybacks make this even more powerful
The five names and the case for each
How to use this screen in your own process
The mistakes that turn a “bargain” into a value trap
Okay, let’s dive in.
How I decide a dividend stock is undervalued
I lean on two simple tools, and I treat the answer as a range instead of a single magic number.
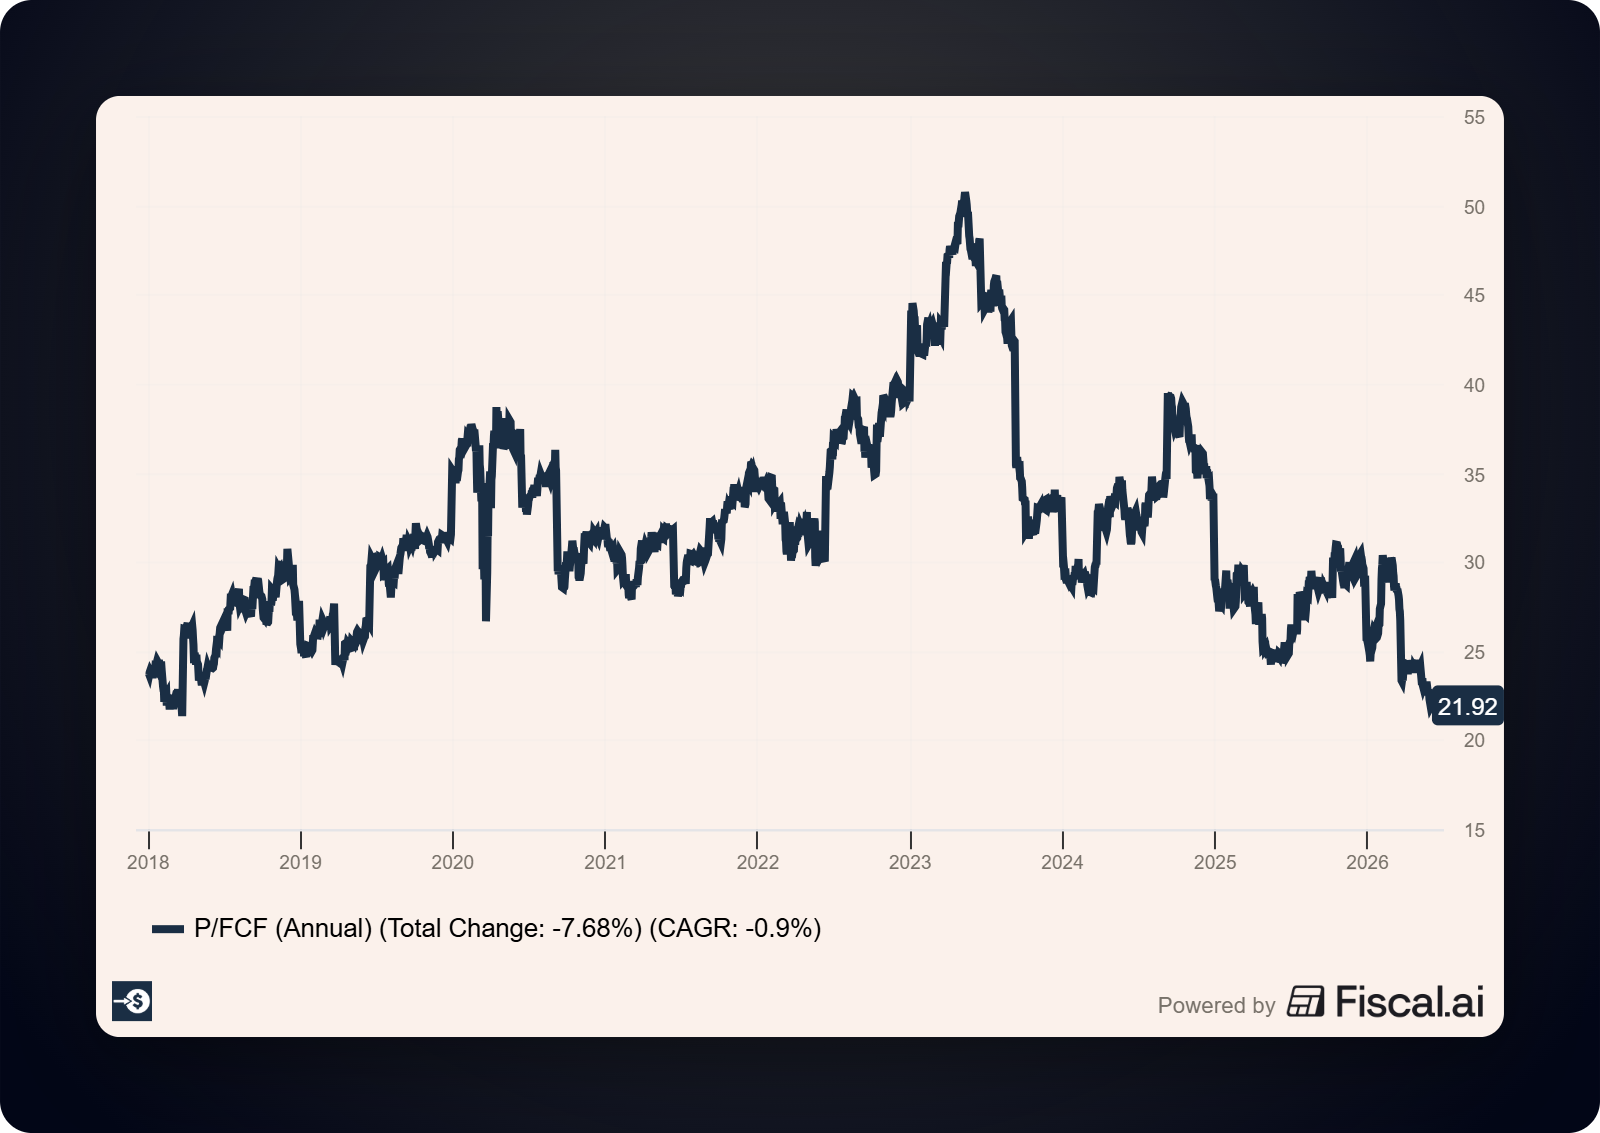
The first tool is the stock’s own history. Every quality business trades in a rough valuation band over time. When the current price-to-earnings multiple sits near the low end of its own five-year range, that is my first flag. I am not comparing Mastercard to the market. I am comparing Mastercard to Mastercard.
The second tool is a rough discounted cash flow, or DCF. You do not need a fancy model. A back-of-the-envelope estimate of the cash a business will throw off over the next decade, discounted back to today, tells you whether the current price is asking for heroic growth or modest growth.
When both tools point the same direction, I pay attention.
Here is the judgment part. A 10x multiple on a shrinking business is expensive. A 20x multiple on a business compounding free cash flow at 12% a year can be cheap. Cheap and expensive are about what you get for the price, so the quality of the business has to come first.
And before any of that, the dividend has to be safe. If the company is paying out more than it earns or more than it generates in free cash flow, the yield is a warning light, not a gift.
Why buybacks make this even more powerful
There is a second engine working underneath these companies, and most beginners miss it.
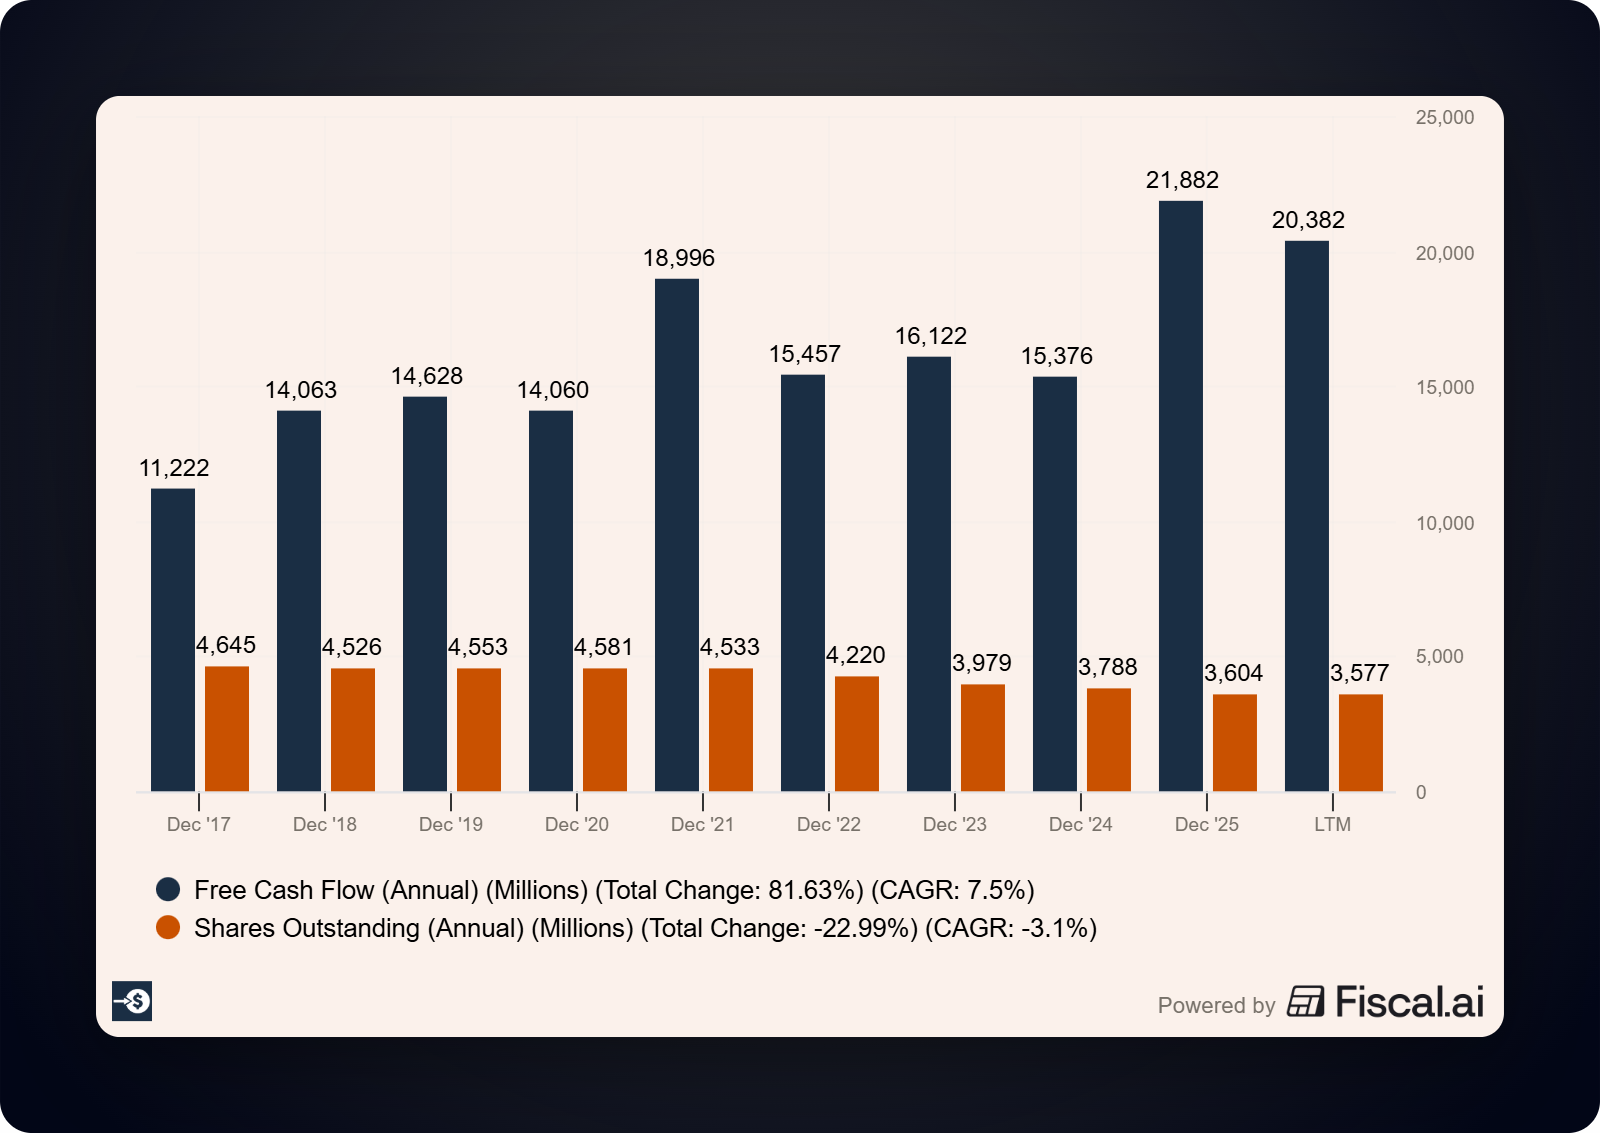
When a business buys back its own shares, every remaining share owns a bigger slice of the company. Free cash flow per share can grow faster than total free cash flow, because the share count keeps shrinking.
Mastercard is the cleanest example you will find. The company can grow total cash flow at a healthy clip, then retire millions of shares on top of that, so the per-share figures compound faster than the headline growth rate. That gap is the buyback engine doing its quiet work.
The catch is that buybacks only create value when shares are repurchased below intrinsic value. A company overpaying for its own stock is destroying value in slow motion. Near a 52-week low, a quality compounder buying back shares is doing exactly what you want it to do.
Now, let’s look at the five.
Mastercard (MA)
Mastercard runs one of the best business models in the world. It sits in the middle of global card payments, takes a small cut of an enormous and growing flow of money, and spends very little capital to do it.
The stock has been sliding, and it recently touched a 52-week low while the broader market held up. Investors worry about consumer spending, cross-border travel, and a payments sector that has seen its multiples compress.
The business has not gotten the memo.
Here is the recent scorecard:
Q1 2026 net revenue: $8.4 billion (+16% year over year)
Q1 2026 adjusted EPS: $4.60 (up roughly 18%)
Operating margin: around 59%
Net revenue path: $18.9 billion (2021) growing to $32.8 billion (2025)
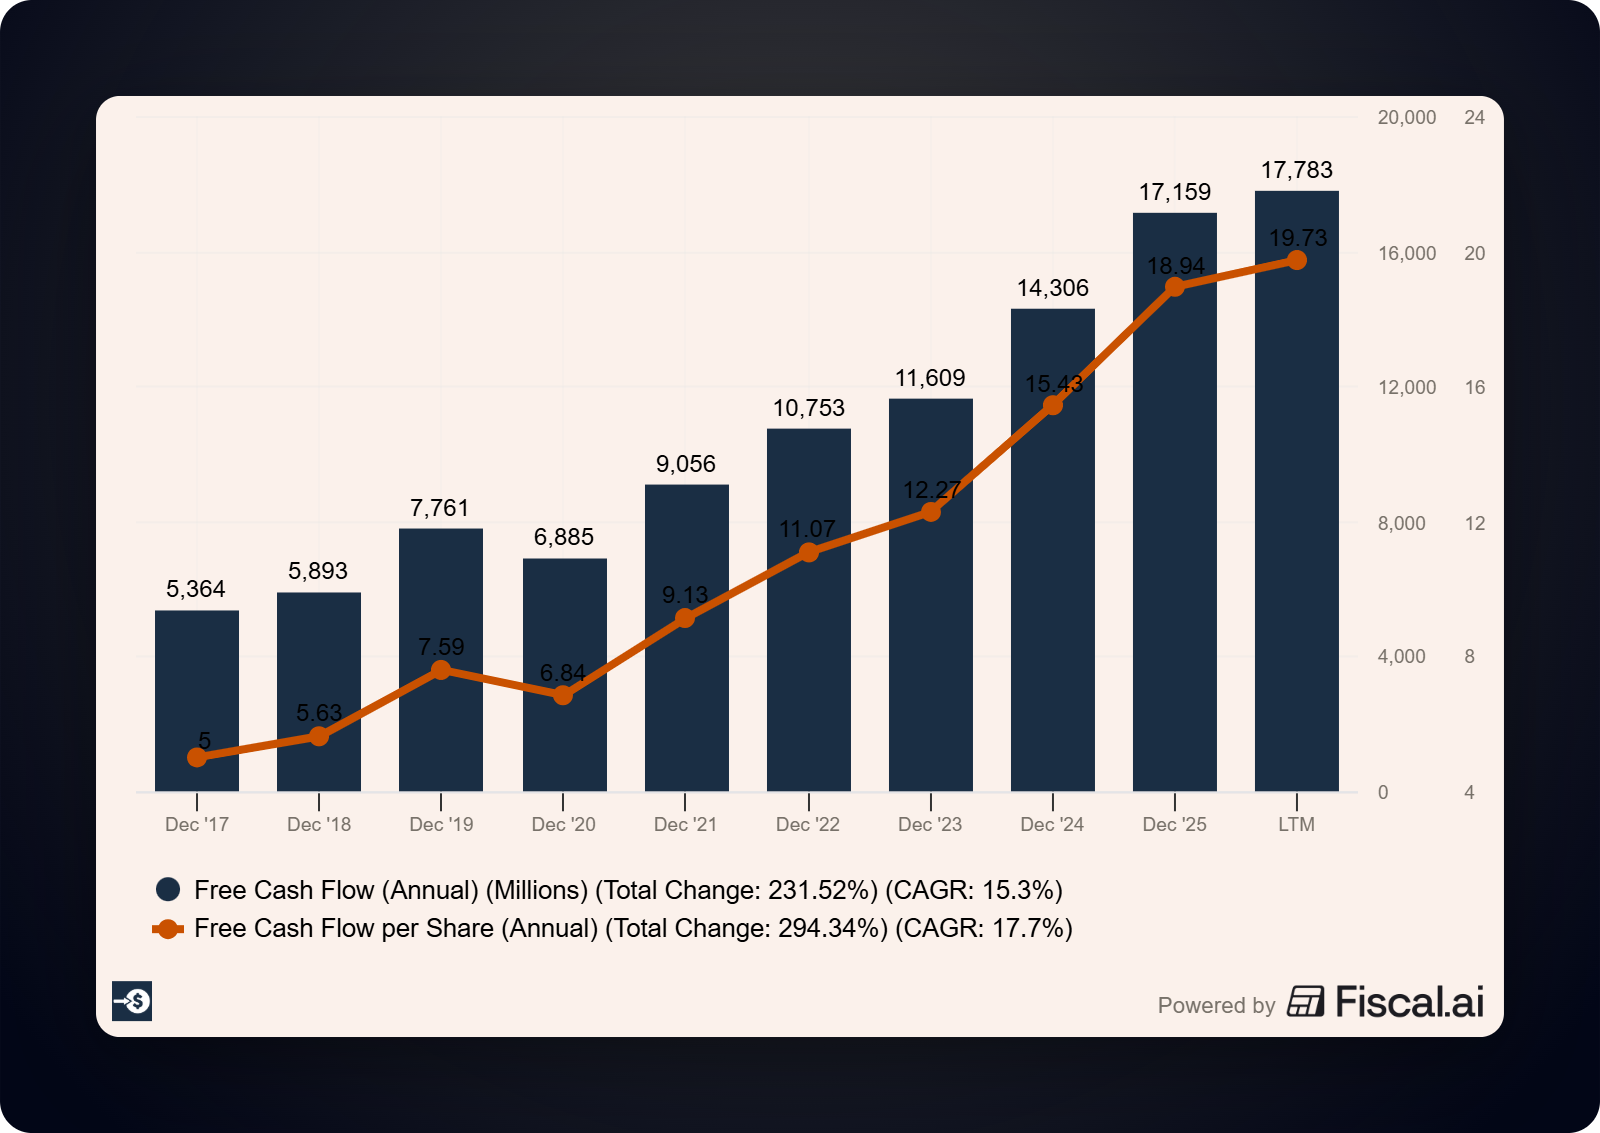
On capital return, this is a machine. According to Mastercard’s FY2025 10-K and its December 2025 board release, the company returned about $14.5 billion to shareholders in 2025, repurchased 21.1 million shares, and grew trailing free cash flow roughly 20% to $16.3 billion. The board then raised the dividend 14% to an annualized $3.04 per share, the 14th straight year of increases, and authorized a fresh $14 billion buyback on top of the existing program.
The valuation case is simple. Mastercard trades near the bottom of its recent multiple range while still compounding revenue and shrinking the share count. Mastercard has grown free cash flow at a 16%+ CAGR over the past ten years, while the market is pricing in 6% growth.
The yield is small, near 0.7%, so this is a total-return story rather than an income story.
The risk: a real recession would slow transaction volumes, and the stock is never statistically “cheap” on a raw multiple. You are paying a fair price for a great business, which is the deal Buffett took on See’s Candies.
Brown & Brown (BRO)
Brown & Brown is an insurance broker, and brokers are wonderful businesses. They earn commissions for placing insurance, hold very little risk on their own books, and have raised their dividend for 32 consecutive years.
The stock fell roughly 50% from its 2025 high, which is what pulled it onto this list.
Three things happened at once. The company made its largest acquisition ever, buying Accession Risk Management for a gross price of $9.825 billion (closed August 1, 2025), and funded part of it with new shares, which diluted existing holders. Organic growth slowed as commercial insurance pricing softened. Then a wave of fear that artificial intelligence could disrupt insurance brokers hit the whole group.
Let’s look at the numbers behind the drop:
Q4 2025 total revenue: $1.6 billion (+35.7%, boosted by the acquisition)
Q4 2025 organic revenue: down 2.8%
Q4 2025 adjusted EPS: $0.93
Trailing net margin: around 23.6%
That margin is the tell. This is still a highly profitable business that bolted on roughly $1.8 billion of annual revenue and 5,500 teammates, and the market is now valuing it well below the 25x-plus earnings it usually commanded.
The valuation case rests on normalized earnings once Accession is fully in the numbers. A rough owner-earnings estimate puts the stock somewhere near 11x to 13x, a level Brown & Brown almost never sees.
The risk: a big acquisition has to grow value per share, not only total revenue. If organic growth stays weak and integration drags, the cheap multiple can stay cheap. This one rewards patience and a close read of the next few quarters.
Want the full picture? I track a watchlist of quality dividend compounders with buy-below prices and dividend-safety grades for paid members. Two of today's five sit at the top of it.
Comcast (CMCSA)
Comcast is the free-cash-flow machine hiding in plain sight. It owns Xfinity broadband, NBCUniversal, Peacock, Sky, and the Universal theme parks, and it generates enormous cash.
The market hates it right now. The stock trades near a 52-week low at a single-digit trailing earnings multiple, because broadband subscriber growth has stalled and traditional video keeps shrinking.
Look at what the cash engine actually did.
According to Comcast’s January 2026 8-K, full-year 2025 free cash flow reached $19.235 billion, up 53% from the prior year. The April 2026 8-K showed $3.9 billion of free cash flow in Q1 2026, with $2.5 billion returned to shareholders in the quarter and 42 million shares retired. The company has lifted its dividend every year since 2008 and currently yields north of 5%, with a special dividend paid in January 2026 on top.
Here is the per-share math that makes this interesting:
2025 free cash flow: $19.2 billion (+53% YoY)
Capital returned to shareholders in 2025: roughly $12 billion
Trailing P/E: around 5, forward near 8
A company throwing off this much cash, shrinking its share count, and paying a 5% dividend does not need much growth to reward you. The valuation already assumes decline.
The risk: that decline could be real. Cord-cutting and broadband competition are genuine headwinds, and the market is betting the cash flow erodes. Your job is to decide whether the price already overpays for the gloom.
PepsiCo (PEP)
PepsiCo is a Dividend King, with 54 consecutive years of dividend increases behind brands like Pepsi, Gatorade, Lay’s, and Doritos.
The stock trades in the lower third of its 52-week range, weighed down by fears that weight-loss drugs will shrink snack demand and by softness in volume in its Frito-Lay business.
Management is responding with a plan you can actually evaluate. It cut prices on core snacks by up to 15% to win back volume and shelf space, a bet that higher volume offsets lower per-unit revenue.
Here is the valuation snapshot:
Forward dividend yield: around 4%
Normalized P/E: roughly 17x
Historical price-to-free-cash-flow: closer to the 25x to 30x range over five years
A Dividend King yielding around 4% and trading well under its own historical multiple is rare. You are getting paid a healthy income while you wait for the volume plan to work.
The risk: if the weight-loss-drug story compresses snack consumption faster than expected, the volume recovery stalls and the cheap multiple is justified. The dividend looks secure either way, which is why this one fits a patient income portfolio.
Medtronic (MDT)
Medtronic makes medical devices, from pacemakers to insulin pumps to surgical tools, and it has raised its dividend for 48 straight years.
The stock sits near a 52-week low after falling more than 20% from its high, caught up in a tough stretch for medical-device names.
The dividend math holds up:
Annual dividend: $2.84 per share
Dividend yield: around 3.6%
Payout ratio: roughly 79%, covered by cash flow
Forward P/E: around 16x, against a depressed trailing figure
Medtronic guided to organic revenue growth near 5.5% for fiscal 2026 and plans to separate its diabetes business by the end of 2026, a move meant to sharpen the focus of the remaining company.
The valuation case is a steady Dividend Aristocrat trading at a forward multiple below its own norm, paying you 3.6% to wait for the spin-off and a return to high-single-digit earnings growth.
The risk is the one I watch most closely here. Medtronic’s return on invested capital has hovered near 8%, close to its cost of capital, so this is a slower compounder than the others on this list. If you have read my work on ROIC, you know that gap between returns and the cost of capital is where real value gets created, and Medtronic’s gap is thin.
How to use this screen in your process
You do not have to take my word on any of these. The point is the screen, so you can run it yourself.
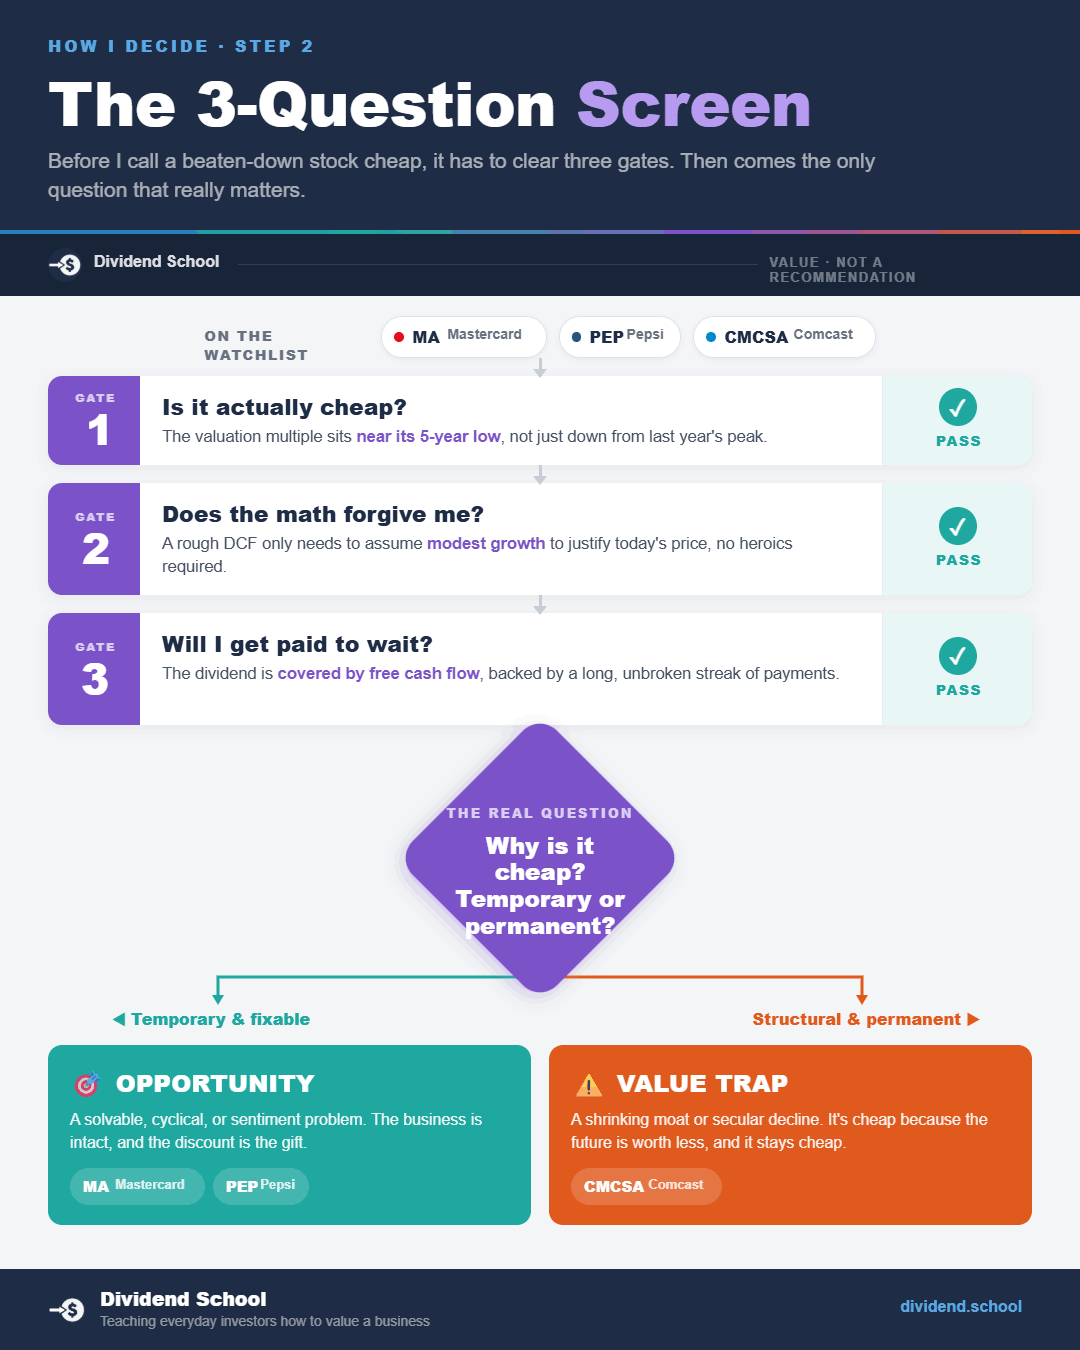
Start with the same three questions every time:
Is the current multiple near the low end of the company’s own five-year range?
Does a rough DCF or owner-earnings estimate suggest the price is asking for modest growth, not heroic growth?
Is the dividend covered by earnings and free cash flow, with a long history of increases?
If a name clears all three, then ask the hardest question of all. Why is it cheap, and is that reason temporary or permanent?
Mastercard and Comcast are cheap on fear about a slowdown that has not shown up in results. Brown & Brown is cheap on dilution and a fixable organic-growth dip. PepsiCo and Medtronic are cheap on slow growth that management is actively working to fix.
Temporary problems create opportunity. Permanent decline creates value traps. Telling them apart is the whole game.
The mistakes that turn a bargain into a trap
Chasing yield is the first and biggest. A dividend that looks too good usually is, and the market is often pricing in a cut. A safe 3% beats a doomed 9% every time.
Ignoring why a stock fell is the second. A low price is only a bargain if the business recovers, so the reason for the drop matters more than the size of the drop.
Trusting a single multiple is the third. A 5x earnings multiple means nothing without the context of whether the business is growing or shrinking, which is why the rough DCF and the quality check sit right next to the multiple.
Forgetting to check dividend coverage is the fourth, and it is why Nike did not make this list. The stock is near its low and looks cheap, yet it is currently paying out more than 100% of earnings and free cash flow, which is a flashing warning light rather than a green one.
One last note. Prices, yields, and multiples move every single day, so confirm the current figures before you act on any of these.
A quality dividend payer trading near its low, with a covered dividend and a temporary problem, is one of the most reliable setups in investing, and your edge is the patience to buy while it still feels uncomfortable.
As always, thank you for taking the time to read this post, and I hope you find something of value on your investing journey.
If I can further assist, please don’t hesitate to reach out.
Until next time, take care and be safe out there,
Dave
P.S. Dividend School exists to make you the investor who runs the 3-question screen yourself, the one who can tell a real bargain from a value trap without waiting on anyone's hot tips. If that's who you want to become, join us below.
Dave, thank you and I want you to know that the people I have adnired most in my long life are those that taught me something important. I like your style, it's easy to digest. Thank you!