

One of the highest-quality landlords in America just hit a 52-week low.
Occupancy is 100%. The average lease runs 39.6 years. Management has raised guidance twice this year, and the yield now sits at 7%.
So what does the market see that we don’t? Mostly its own reflection. The stock trades like a bond; rates drifted up, and everybody sold. Nobody checked whether the rent was still coming in.
It is.
That name is below the wall, along with two others. First, the setup.
Every month we screen the Dividend Universe of 30 companies for the five names trading furthest below their Buy Below prices, then tell each story straight from the filings. Every number in this issue comes from the latest 10-Ks, 10-Qs, and earnings releases, so feel free to check my work.
In today’s issue, we will cover:
How the Universe Stacks Up Against the S&P 500
Pick 1: Accenture (ACN)
Pick 2: Automatic Data Processing (ADP)
Pick 3
Pick 4
Pick 5
The Full Board
How the Safety Score Works, for New Readers
Okay, let’s dive in and look at the list.
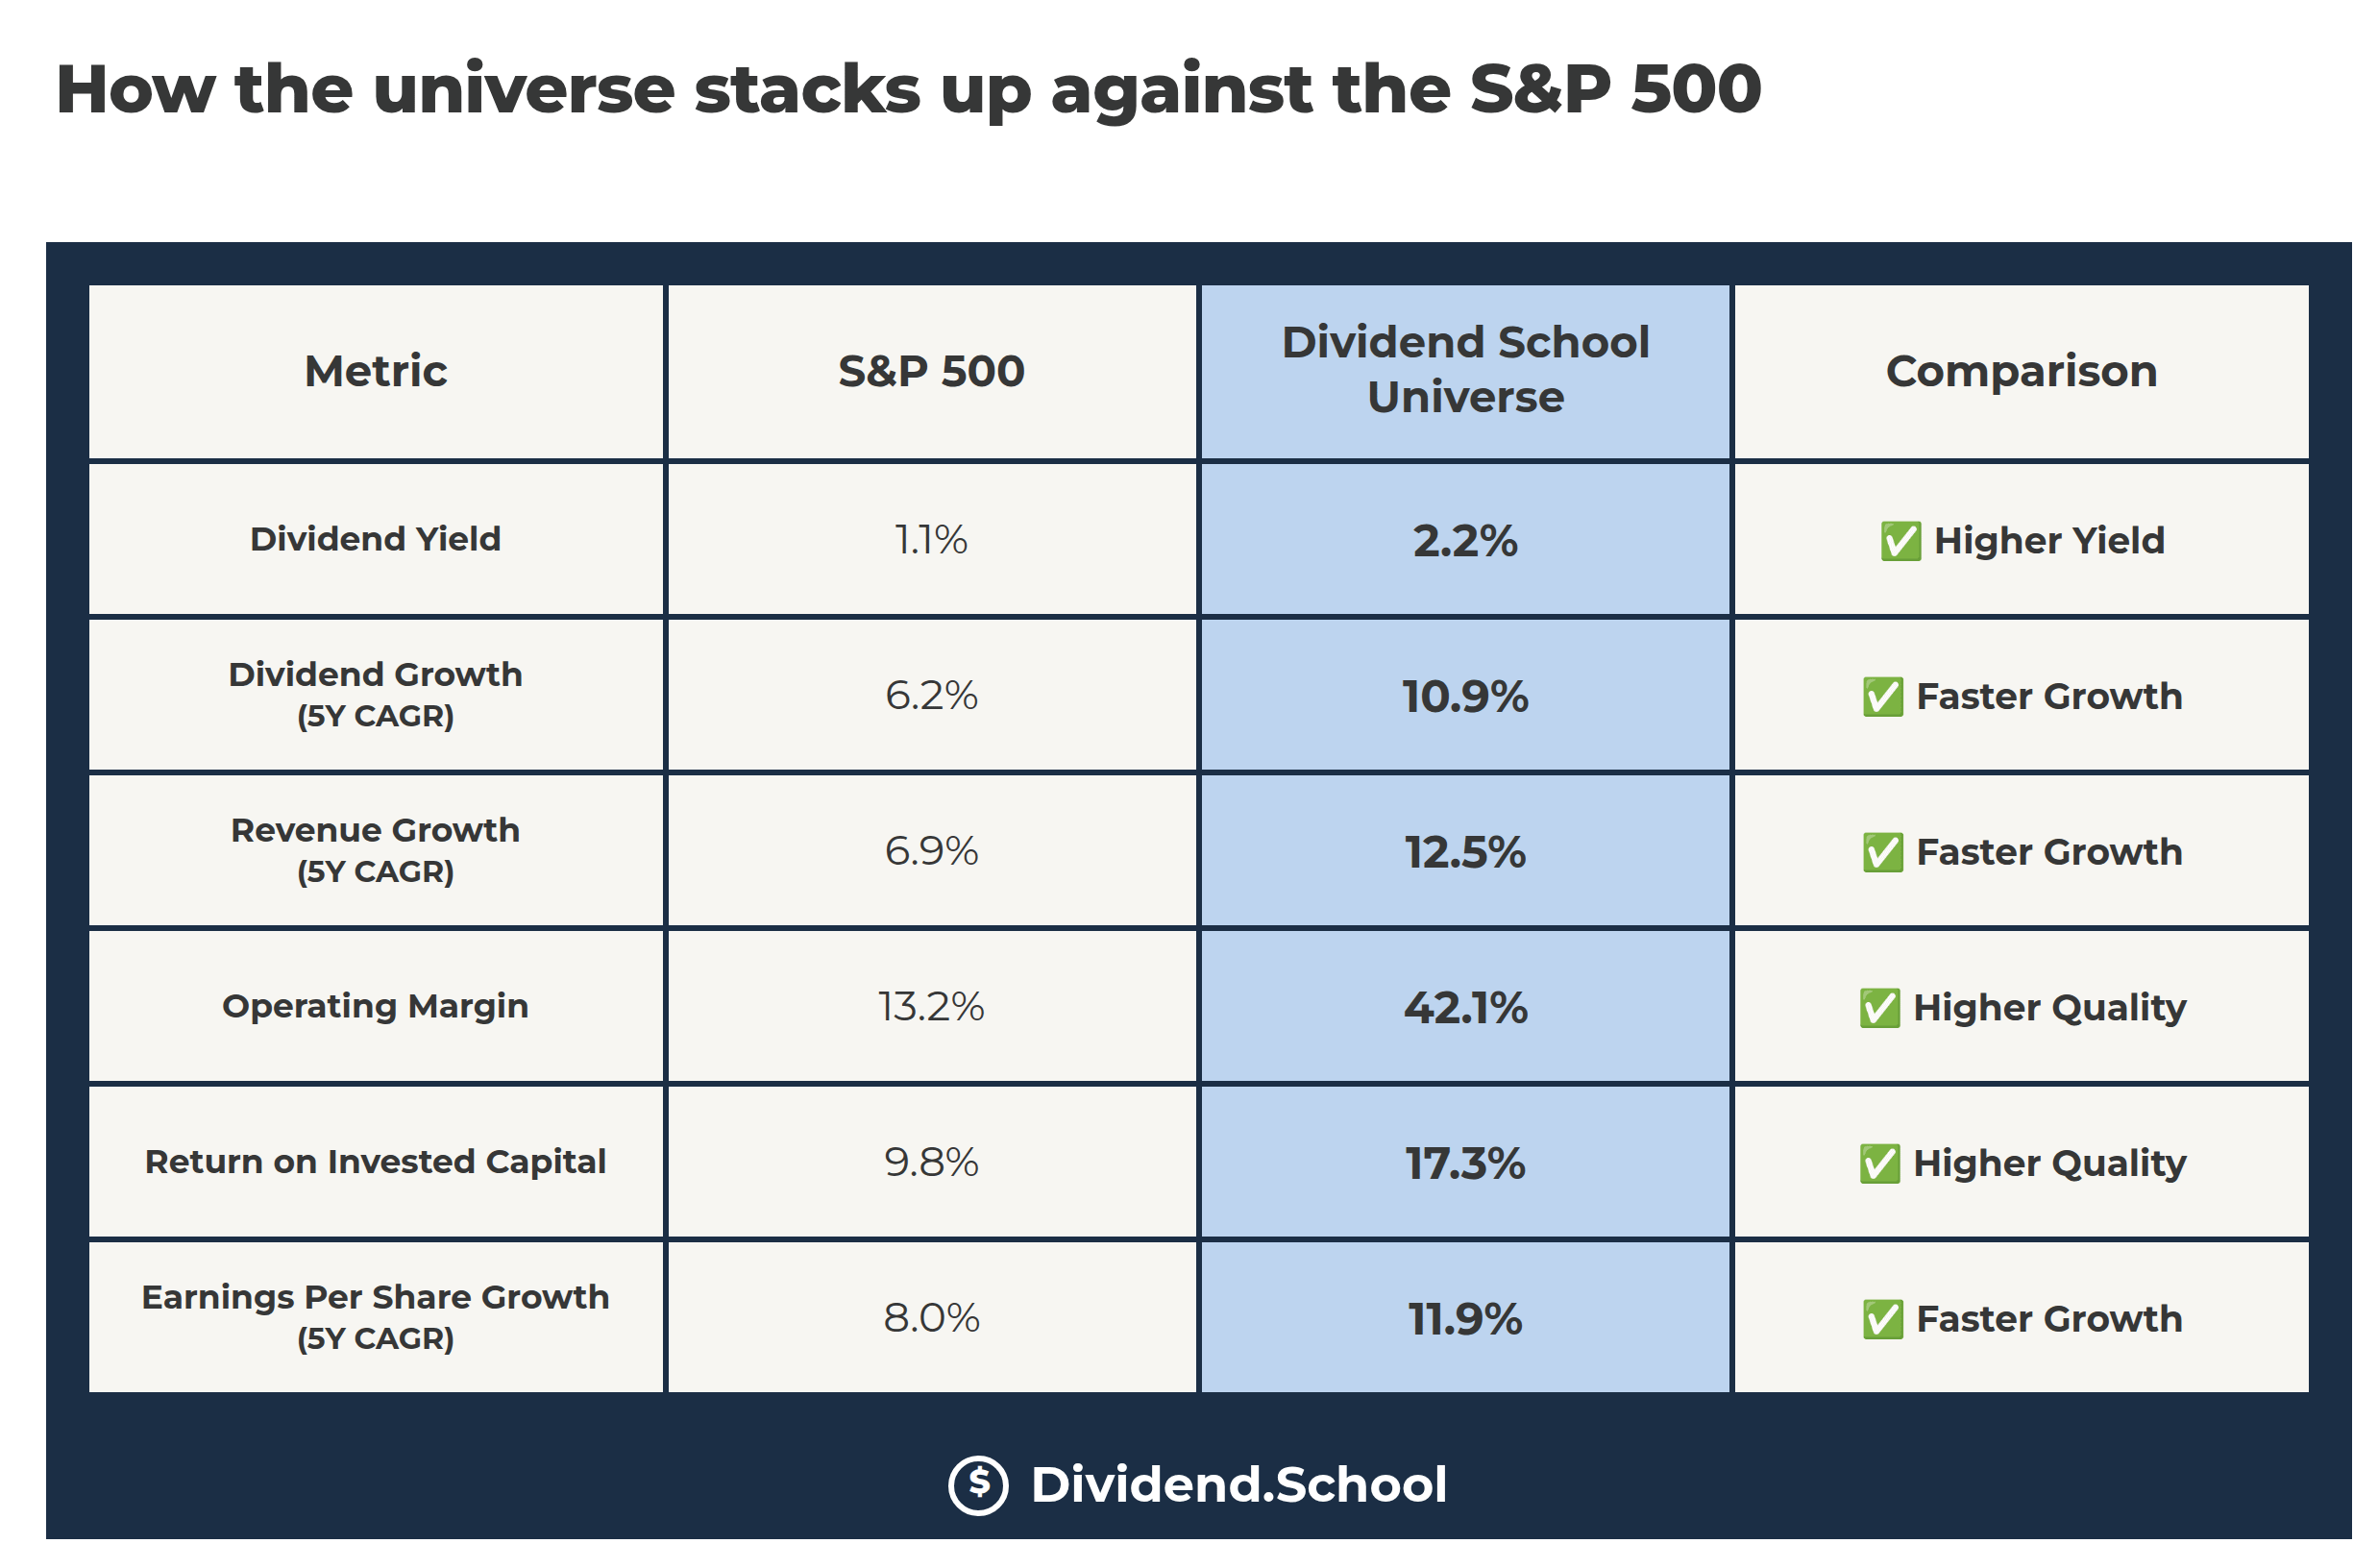
So far, the Universe continues to exhibit higher quality than the S&P 500, but that can always change, which is why we keep analyzing. Remember, the goal isn’t to “outperform” the S&P, but to find great companies that will keep paying us dividends. It’s important to focus on our game.
This month we are adding five names, all Safe, with yields from 0.9% to 7%. That spread is deliberate. This is a portfolio, not a screen.
Pick 1: Accenture (ACN)
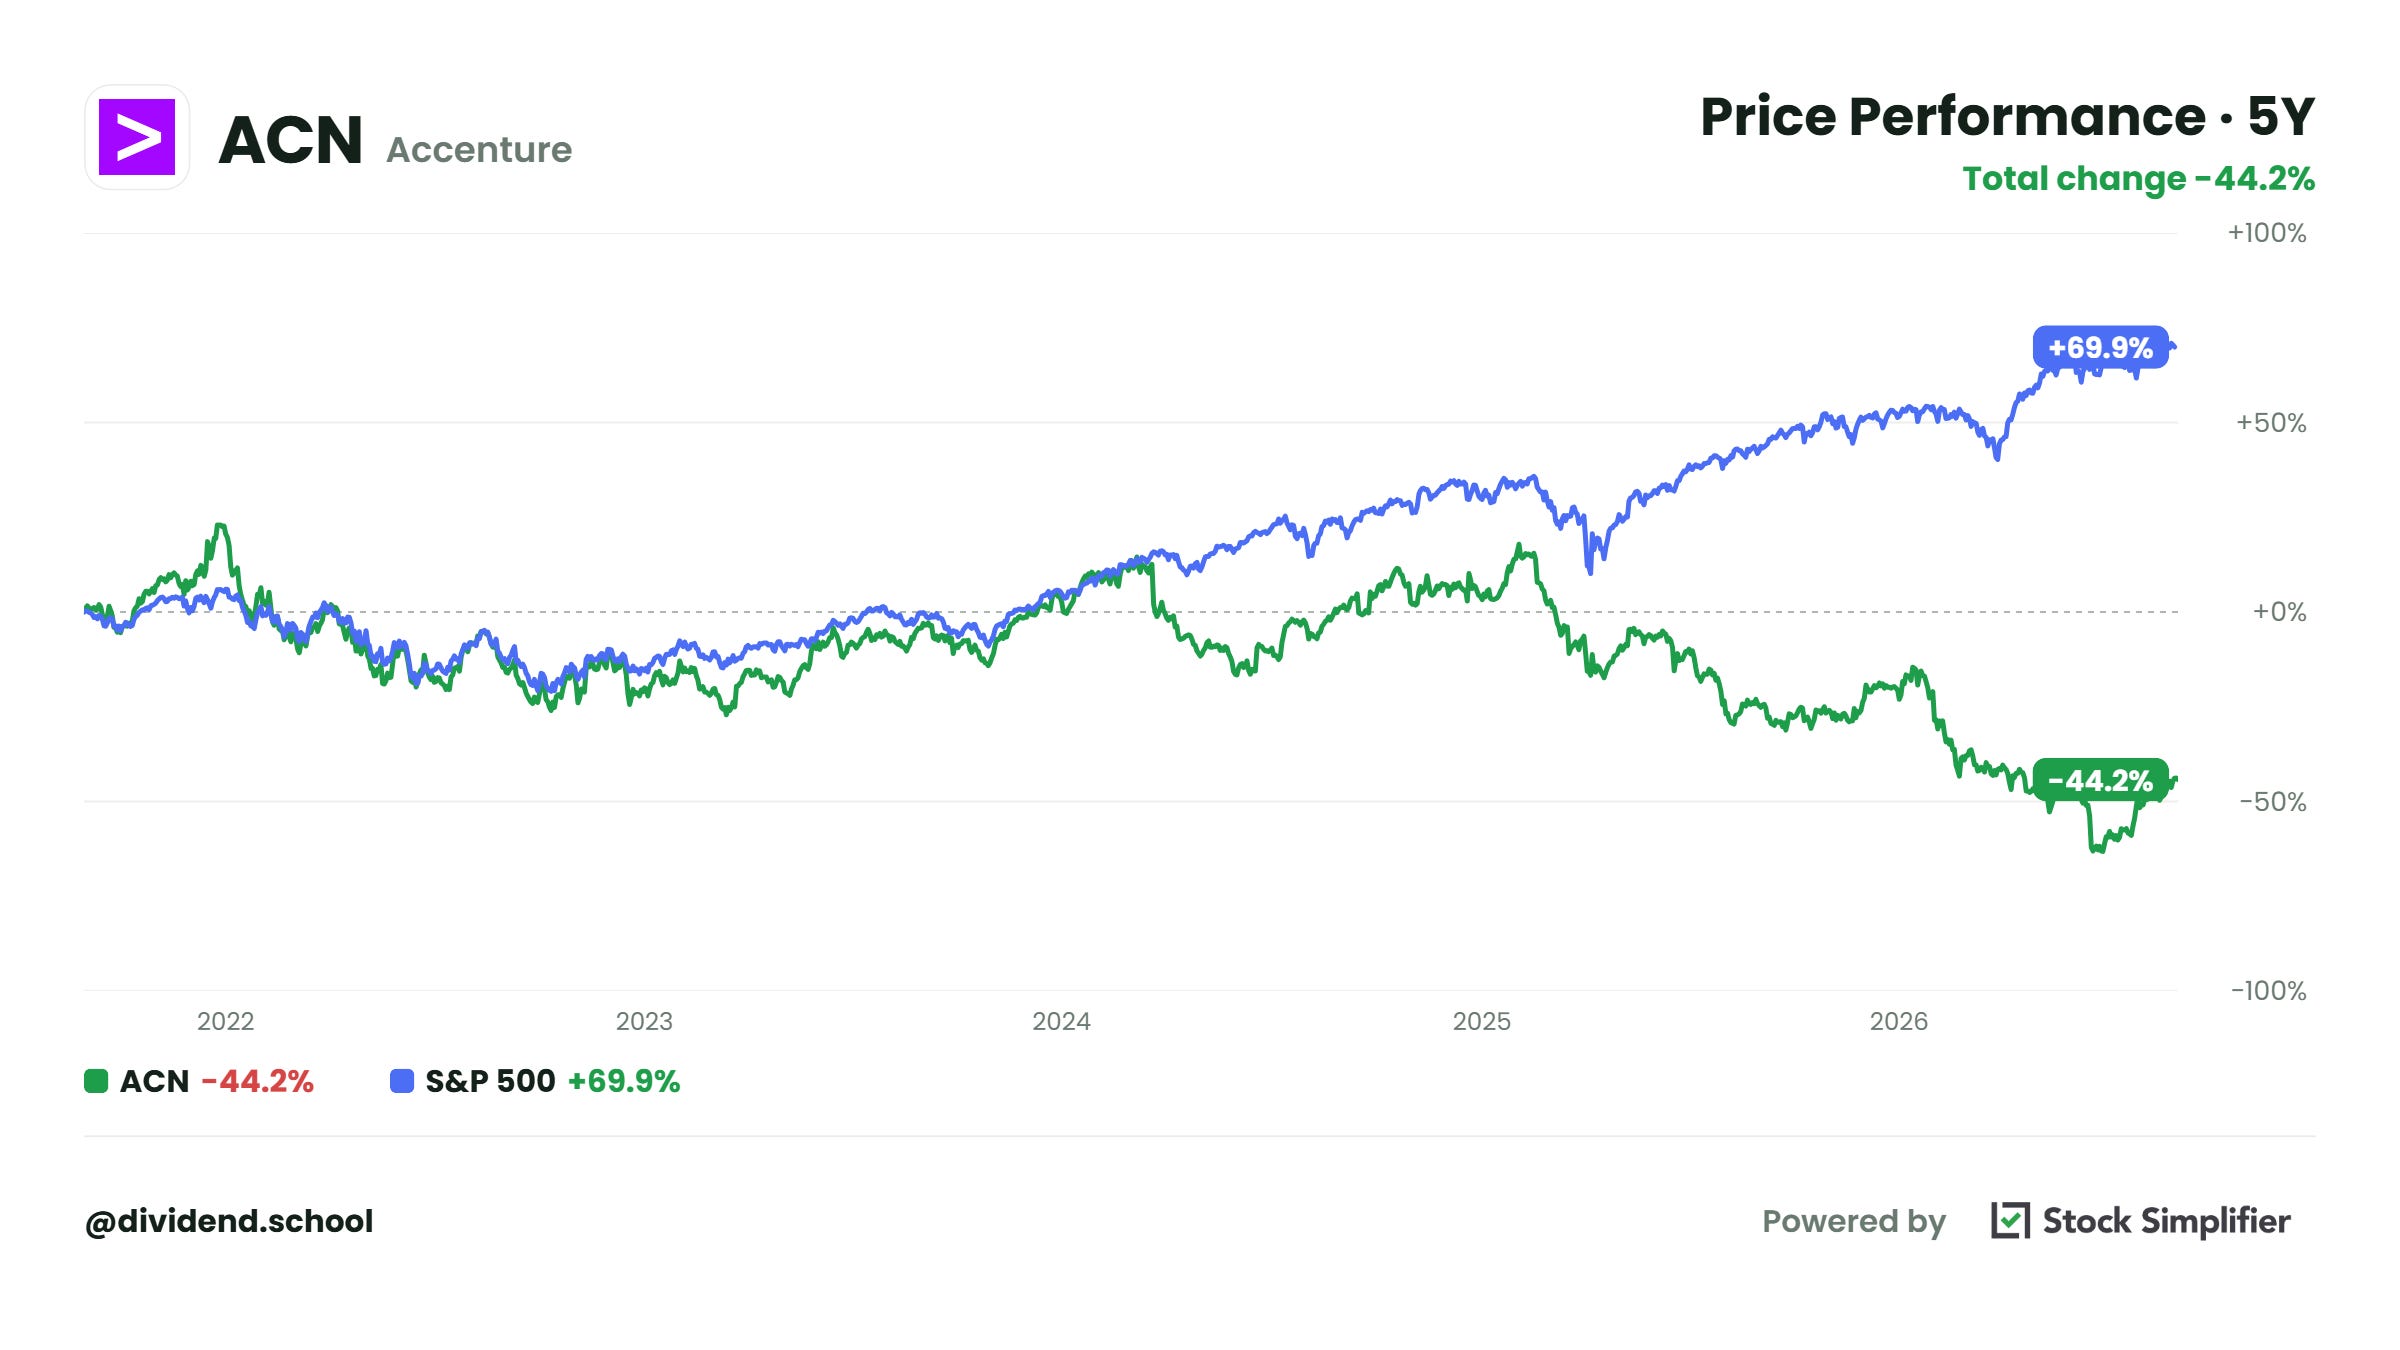
Yes, Accenture again. It was in the August issue, and it’s back, and I’m pounding the table harder this time. The stock kept falling while the cash kept coming in, and that combination is the whole reason this list exists.
Quick Stats
Recent price: $189.10
Buy below: $227.35
Safety score: 4.6 / 5 — Safe
Yield: 3.4%
Dividend: $1.63 per quarter, $6.52 annualized, last raise 10%
Streak: 21 straight annual raises since 2005
Sector: Technology consulting
Why I Like It
Free cash flow of $12.6 billion over the trailing twelve months against $4 billion of dividends paid, a 32% payout (Q3 FY2026 10-Q, filed 6/18/26)
$10.2 billion of cash against $5.1 billion of debt, a net cash balance sheet (Q3 FY2026 10-Q, filed 6/18/26)
Operating margin expanded to 17% in Q3, up 20 basis points, in the middle of a restructuring (Q3 FY2026 earnings release, 6/18/26)
$5.2 billion of buybacks in nine months, with the share count down 1.5% year over year (Q3 FY2026 earnings release, 6/18/26)
Advanced AI revenue tripled to $2.7 billion in FY2025, with $5.9 billion of GenAI bookings (Q4 FY2025 earnings release, 9/25/25)
The Thesis
So what happened to Accenture?
AI happened, or at least the fear of it. On June 18, the company reported a quarter with revenue up 6%, EPS up 9%, and expanding margins, but the stock had its worst single-day decline on record because new bookings fell 2%. The market has decided that AI will do to consultants what the internet did to travel agents.
I think the market has the story backward. When 799,000 employees serve the biggest companies on earth, and those companies all need to figure out AI at the same time, somebody has to do the figuring. Accenture booked $80.6 billion of new work last year. The clients are not leaving; they’re renegotiating what the work looks like.
Is there real softness in the numbers? Yes, and we’ll get to it in the red flags. But a business throwing off $12.6 billion of free cash while the market prices it for decline is my kind of argument.
Love this setup, frankly.
Dividend Safety
The score is 4.6 out of 5, Safe, and the math explains why:
Dividends paid: $6.52 x 615.6M shares = $4 billion a year
Trailing free cash flow: $12.6 billion
Payout on free cash flow: 32% ($4B / $12.6B)
Payout on FY2026 guided EPS: 47% ($6.52 / $13.84 midpoint)
One caveat up front: the dividend’s future pace depends on bookings recovering. A 32% payout means the current dividend is in no danger at all, but the 10% annual raises we’ve gotten used to need earnings growth behind them. Watch the September raise announcement. Anything below 5% tells us management sees a longer slowdown.
Valuation: Buy Below $227.35
First, some housekeeping. As my understanding and analysis of Accenture has grown, my view on the valuation has changed as well.
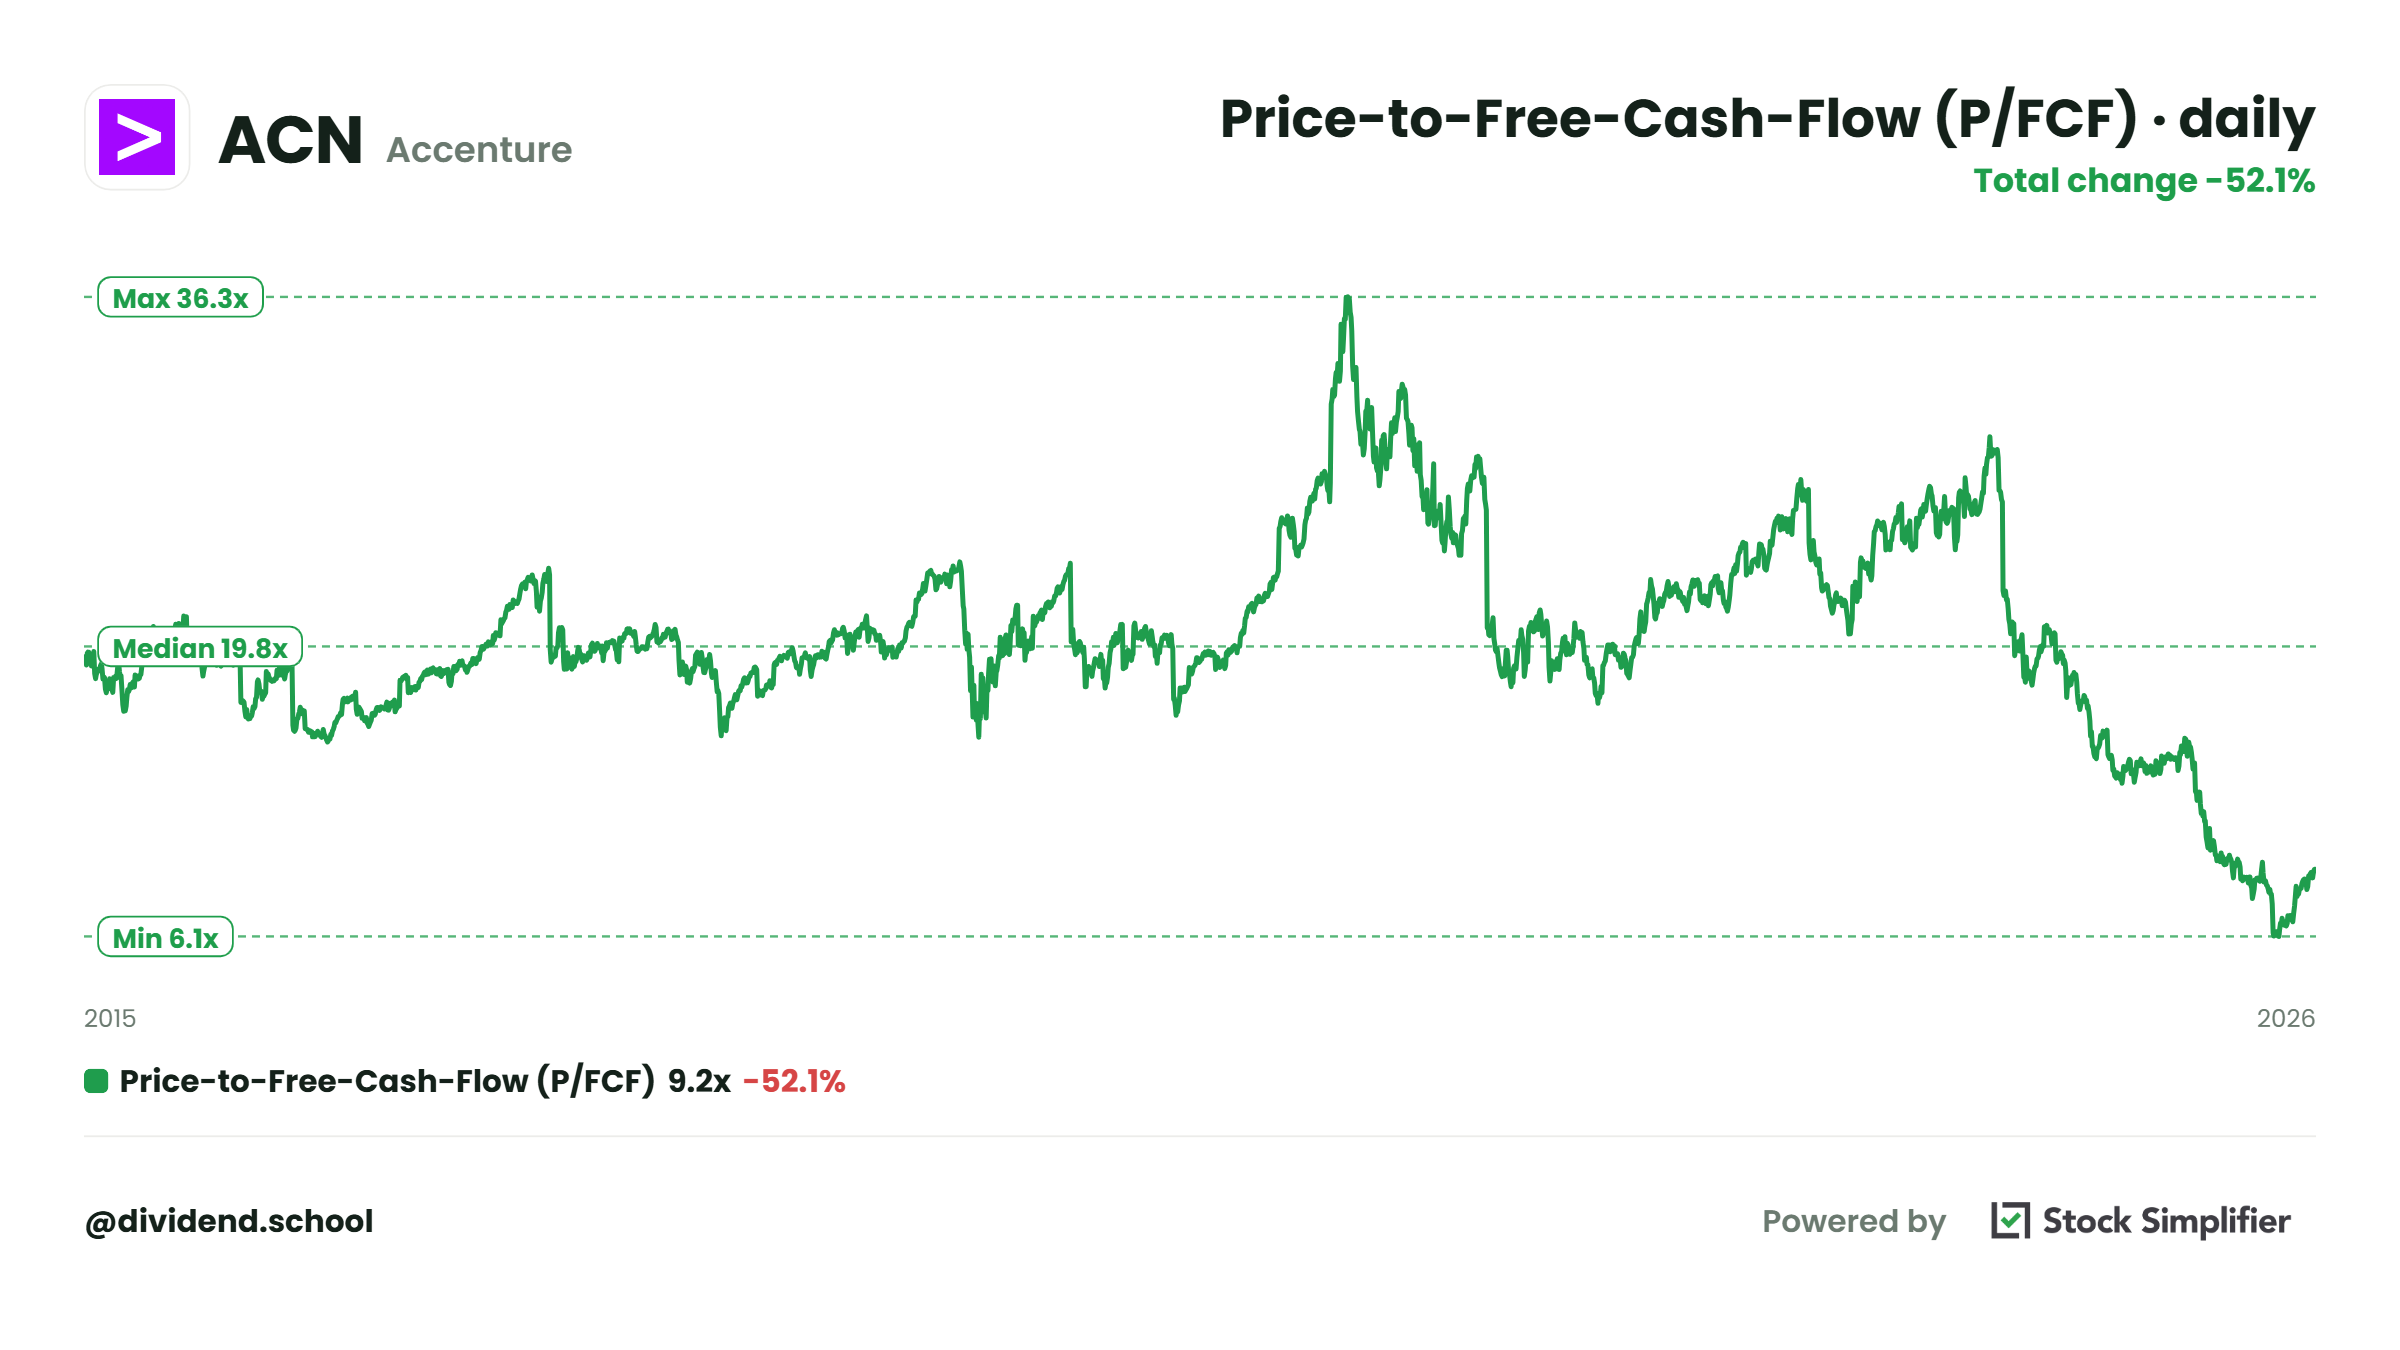
At $189.10, the market values Accenture at $116 billion (615.6M shares x $189.10). Against $12.6 billion of trailing free cash flow, that’s 9.2 times free cash flow ($116B / $12.6B). For most of the past five years, the market paid north of 20x for this same business, as we can see from above.
The discounted cash flow model puts fair value at $522. That’s too optimistic, or drinking the Kool-Aid. A ten-year projection for a consulting firm in the middle of the AI transition deserves a heavy haircut, and I gave it one, cutting the buy below to $227.35.
Here’s the part that settles it for me. Run the model backward, and today’s price implies free cash flow shrinking 4.7% a year, every year, for a decade. The market isn’t pricing in slower growth. It’s pricing in permanent decline for a company whose cash flow grew 26% last year.
Even against my haircut number, the stock trades 16.8% below the Buy Below.
Green Flags
Net cash balance sheet: $10.2 billion of cash against $5.1 billion of debt
21 straight raises, with the last one at 10%
FY2026 capital return commitment of $9.5 billion or more, between dividends and buybacks
Attrition down to 14% from 16%, so the talent is staying
AI revenue is tripling while the market says AI is the problem
Red Flags
New bookings fell 2% in Q3 and 1% for FY2025. Two soft years in a row would trip my alarm, and Q4 reports October 1. We will know soon.
The US federal business is cutting 1-1.5 points off revenue growth as government spending tightens.
$307.5 million of severance charges in nine months. Restructurings this size don’t always go cleanly.
Pick 2: ADP (ADP)
Quick Stats
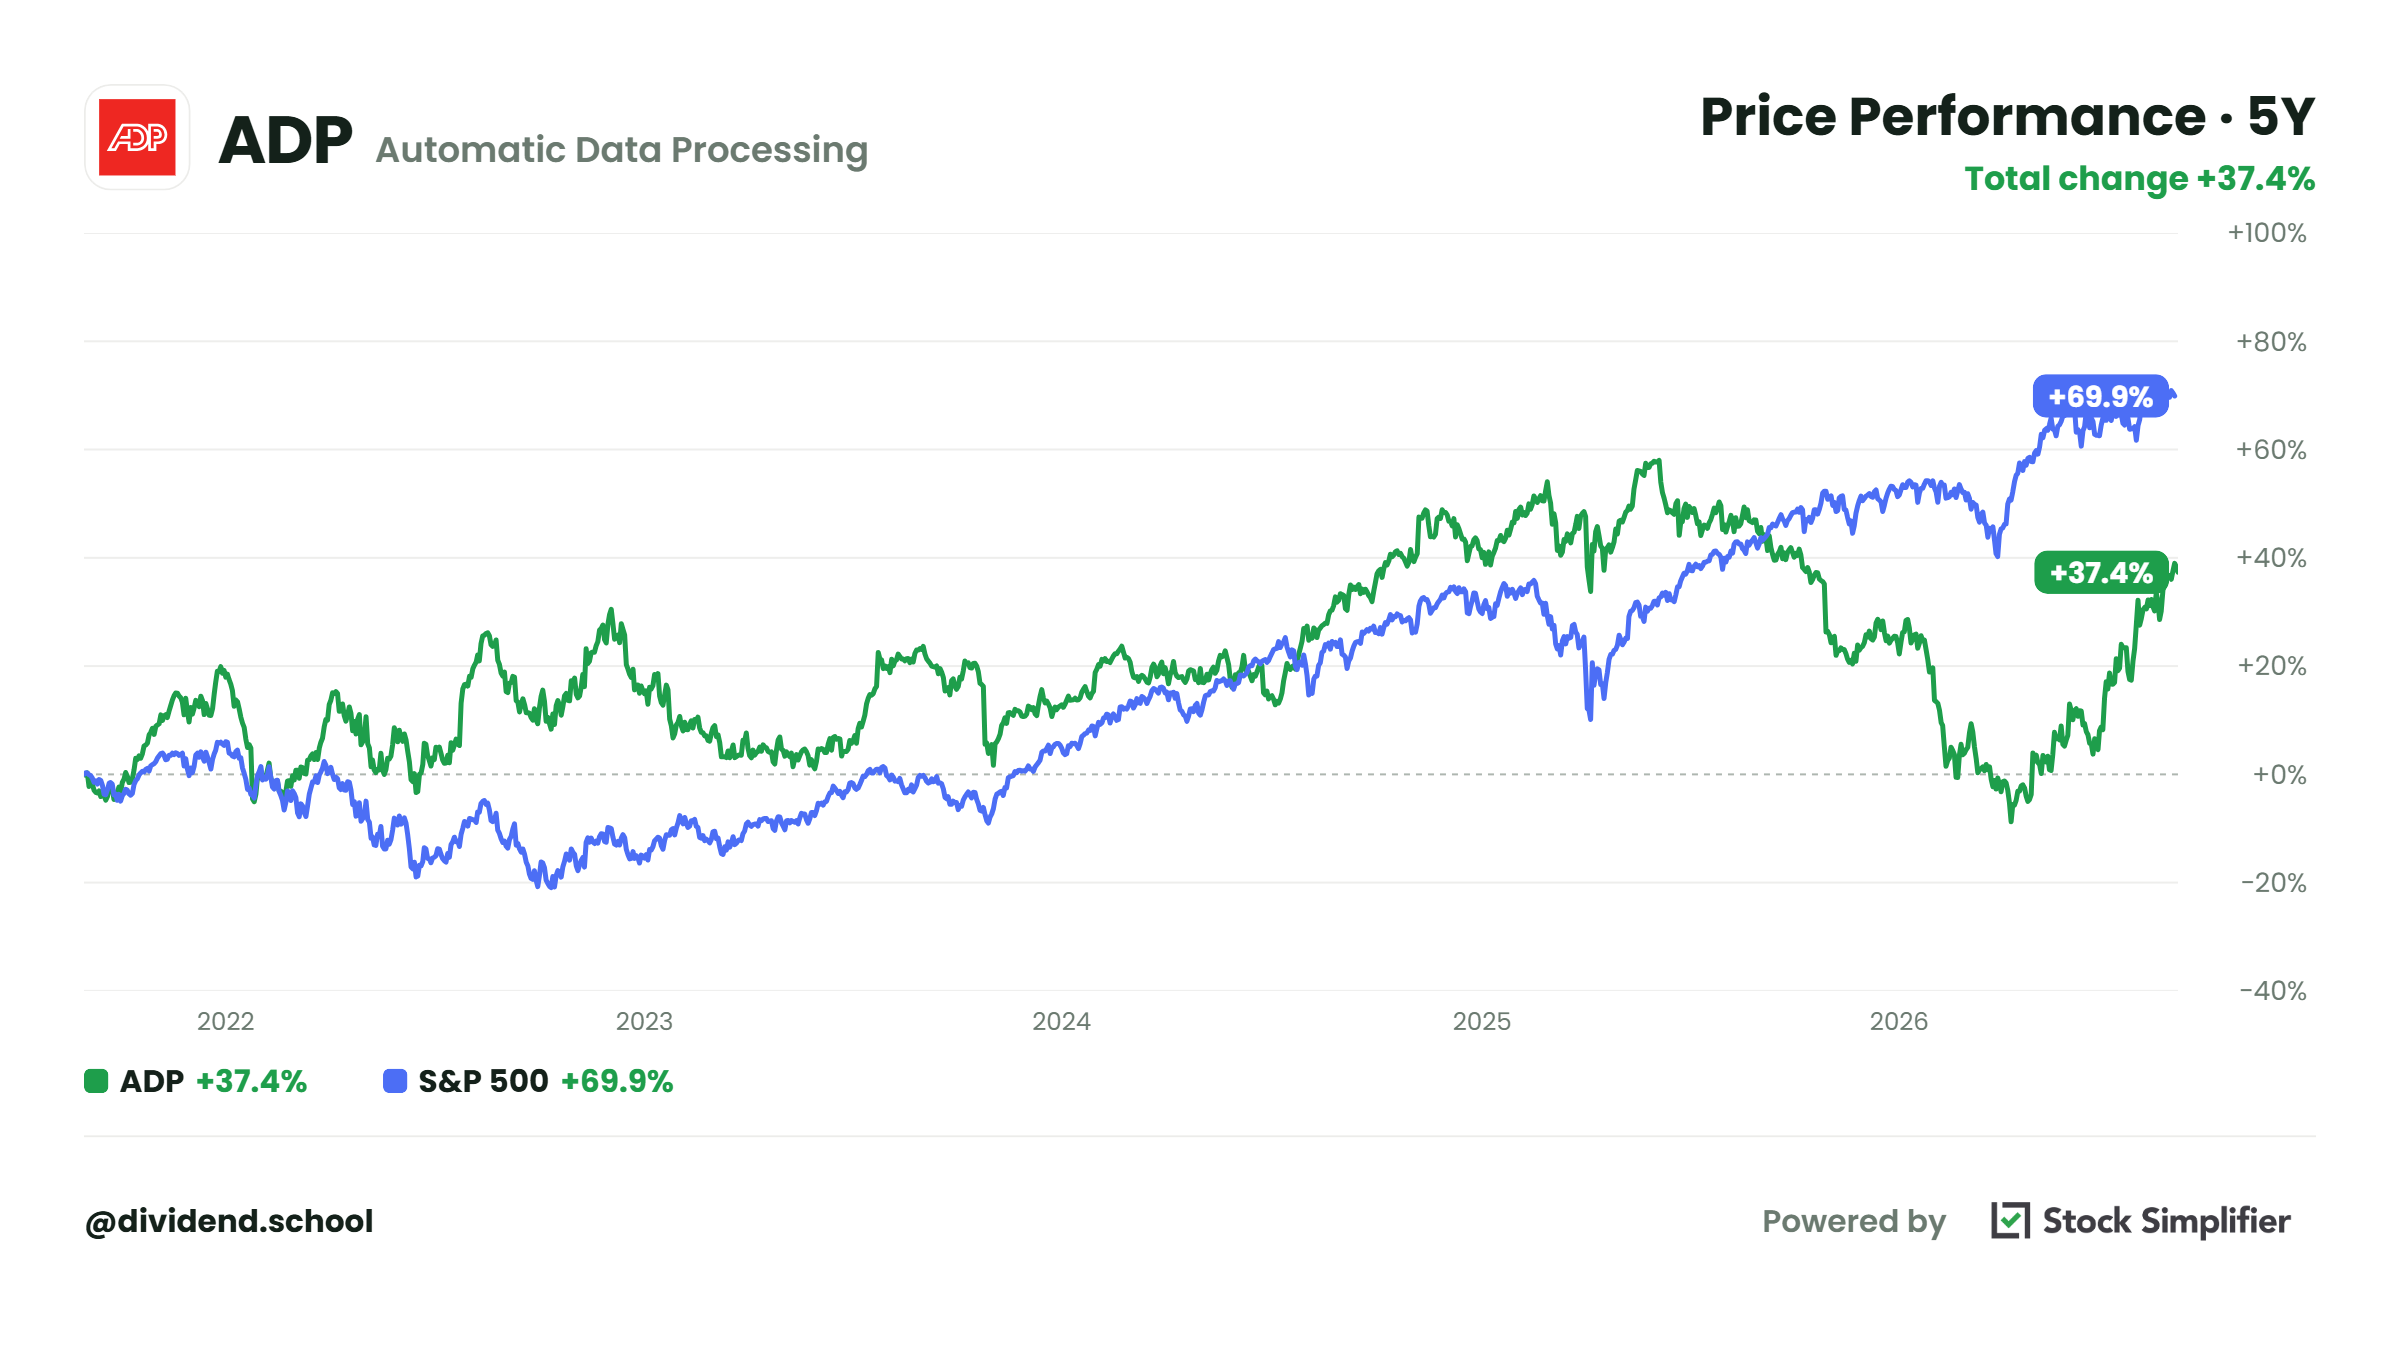
Recent price: $287.30
Buy below: $333.81
Safety score: 4.2 / 5 — Safe
Yield: 2.4%
Dividend: $1.70 per quarter, $6.80 annualized, last raise 10%
Streak: 51 straight annual raises — a Dividend King
Sector: Payroll and HR services
Why I Like It
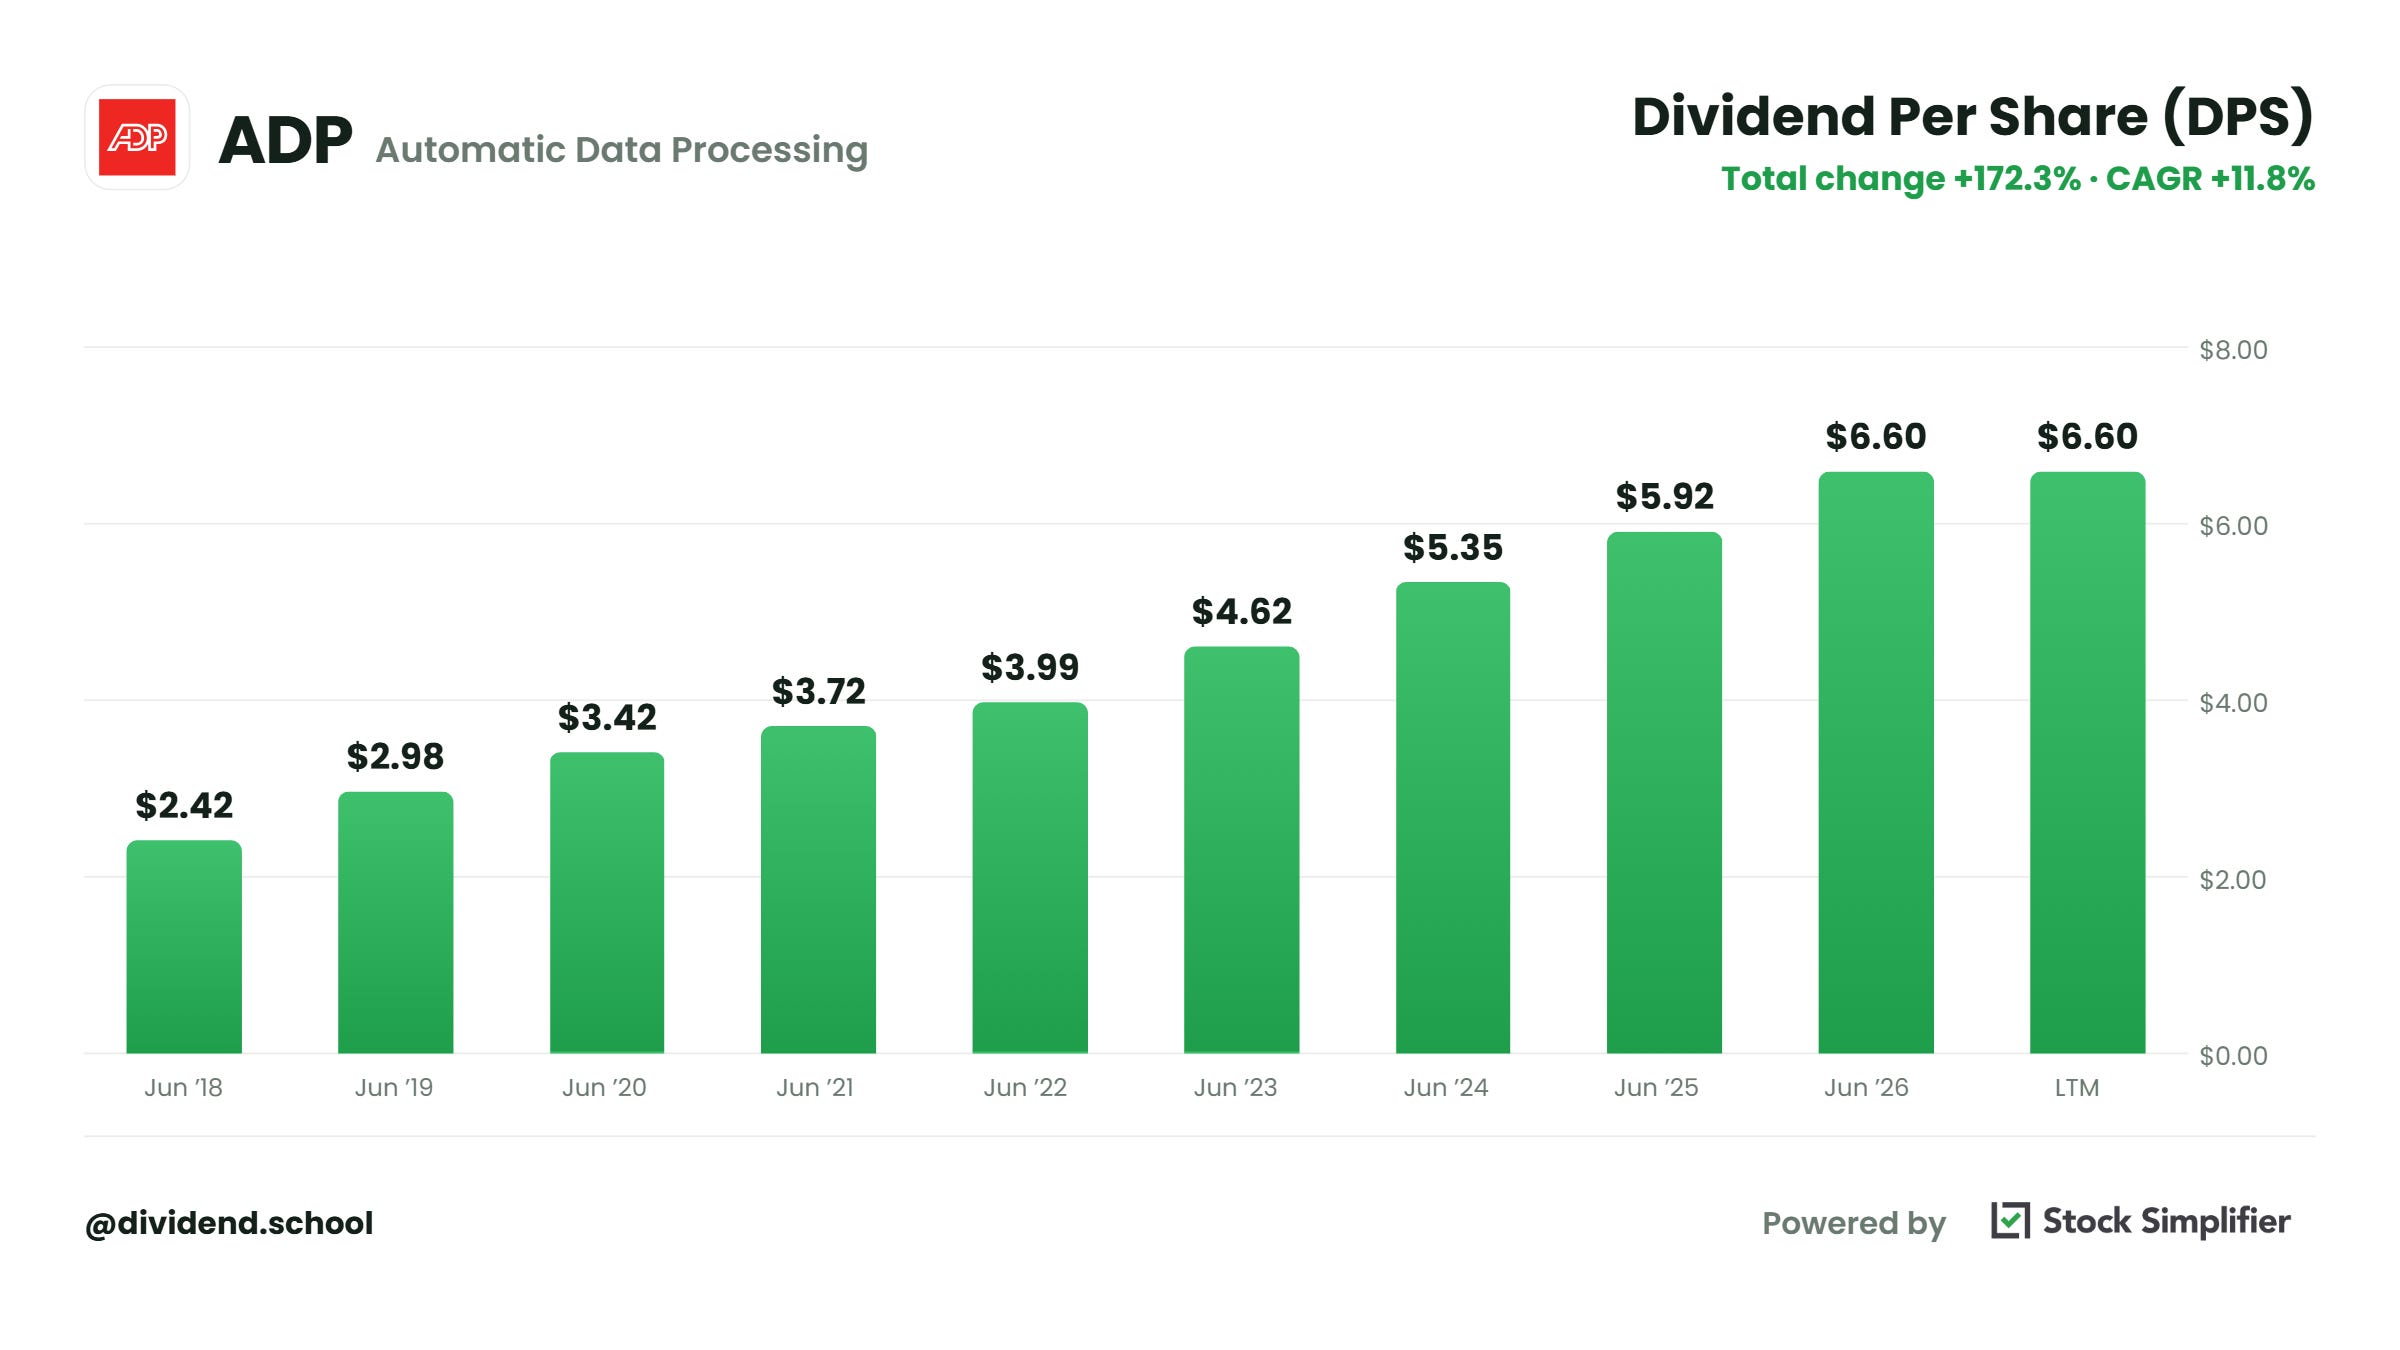
51 consecutive annual dividend increases, with the 52nd due in November (dividend announcement, 11/12/25)
FY2026 revenue of $21.9 billion, up 7%, with adjusted EPS up 11% (Q4 FY2026 earnings release, 7/29/26)
Free cash flow of $4.8 billion, up 8.7%, covering the dividend twice over (FY2026 10-K, filed 8/5/26)
Client funds interest revenue up 14% to $1.36 billion, guided to $1.54-1.56 billion next year (Q4 FY2026 earnings release, 7/29/26)
Adjusted EBIT margin up 80 basis points to 26.8%, with another 70-90 guided for FY2027 (Q4 FY2026 earnings release, 7/29/26)
The Thesis
What does ADP do?
It pays one in six American private-sector workers. Every payroll run, every tax filing, every benefits deduction flows through its systems, and ripping out a payroll provider is the kind of project no HR department volunteers for. Retention runs at 92.1%.
The quiet kicker is the float. ADP holds $40.4 billion of client money in the gap between when employers fund payroll and when workers get paid, and it earns interest on every dollar. That threw off $1.36 billion last year, up 14%, for doing nothing but holding the money carefully. And you know I’m a sucker for a business that gets paid twice for the same work.
A Dividend King below its Buy Below doesn’t happen often. Fifty-one years of raises mean this company raised its dividend through the oil shocks, the dot-com bust, 2008, and a pandemic.
Slow and steady like a turtle. That’s ADP. And that’s why we like it.
Dividend Safety
The score is 4.2 out of 5, Safe, the lowest of the five this month, and the reason is worth understanding:
Payout on EPS: 62% ($6.80 / $10.94)
Payout on free cash flow: 57% ($6.80 / $12.02 of FCF per share)
Free cash flow: $4.8 billion, up 8.7%
That 62% sits at the high end of ADP’s historical comfort zone, and that’s the caveat here. Nothing about it threatens the dividend, but it means future raises will track earnings growth rather than run ahead of it. With EPS guided up 11-13% next year, that’s still a double-digit raise engine.
Valuation: Buy Below $333.81
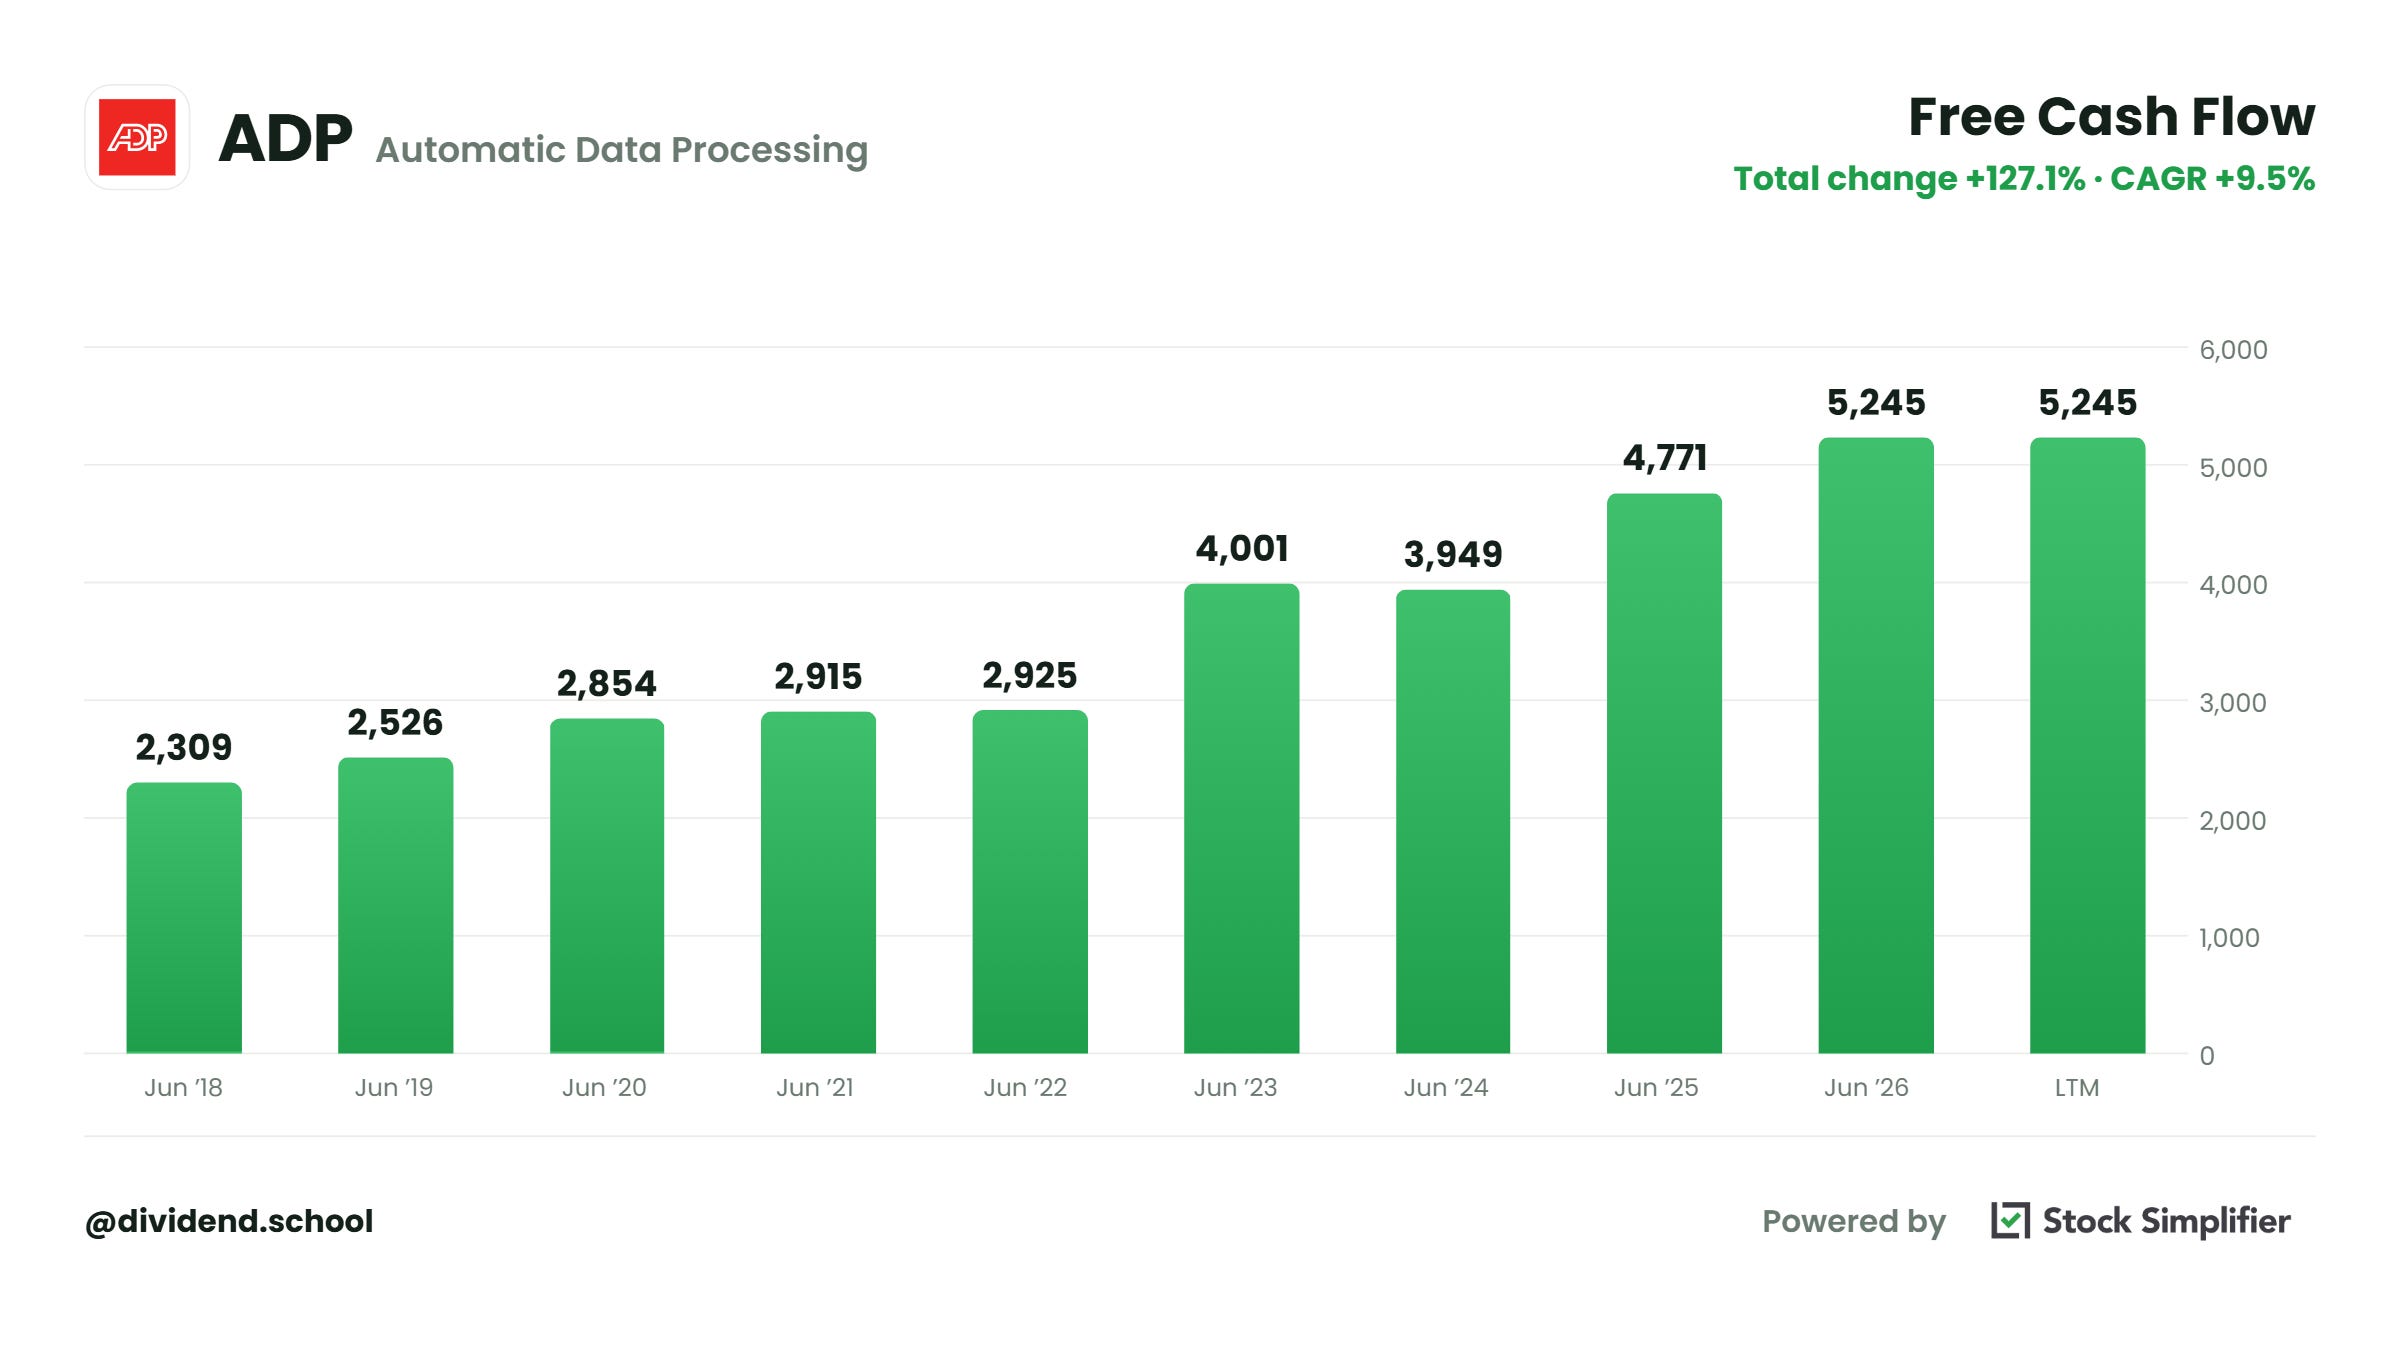
At $287.30, the market values ADP at $114 billion (397.3M shares x $287.30). Against $4.8 billion of free cash flow, that’s 23.9 times free cash flow ($114B / $4.8B), which sounds rich until we look at what ADP has historically commanded.
The DCF puts fair value at $437.
The reverse DCF is what makes this one easy. Today’s price implies 3.5% free cash flow growth over the next decade for a company that just grew it by 8.7% and guides revenue up 5-6% while margins expand. The market is pricing a Dividend King like a utility.
At 13.9% below the Buy Below, we’re being offered a wonderful company at a fair price. I’ll take that trade every time.
Green Flags
51 straight raises, and the streak has survived everything since 1975
Employer Services bookings up 6%, broad-based across small business, enterprise, and international
Client funds interest guided up 14% again next year
Buybacks up 63% to $2.1 billion, on top of the dividend
Retirement services crossed $1 billion of annual revenue for the first time
Red Flags
Retention is guided down 10 to 30 basis points for FY2027. Small numbers, but this metric never moves fast, so any drift matters.
Pays per control grew 1% and is guided to 0-1%. Employment growth at ADP’s clients has nearly stalled, and ADP grows when its clients hire.
PEO margin fell 110 basis points, with more compression expected.
That’s two complete workups, free: the full thesis, the safety math, the Buy Below price, and the flags on each.
Below the paywall, members get:
A landlord yielding 7% at a 52-week low. 100% occupancy, leases averaging 39.6 years, guidance raised twice this year, and the Buy Below we rebuilt from scratch on Saturday.
The toll booth on America’s data traffic, paying out 65% of real cash flow while every screener on the internet says 98%. The gap between those numbers is a lesson worth the subscription by itself.
An insurance broker with 32 straight raises paying out 15% of earnings, and the honest reason its organic growth just went negative.
The Full Board: all 30 Universe names, tiered, each against its Buy Below.
Every number is pulled from the latest 10-Ks, 10-Qs, and earnings releases, with filing dates noted so you can check my work.
Membership comes with a 7-day free trial and a 30-day money-back guarantee.