

A company that has raised its dividend 51 years in a row, through every recession since 1975, got 8.9% cheaper in the last month.
It now trades 21.6% below our Buy Below and at 21.8 times free cash flow, against a five-year average of 26.7. The business didn’t get worse. It raised its outlook twice last year and landed at the top of the range.
The market is worried AI will replace it. I’m pounding the table.
That name is below the wall, along with a second Dividend King and a toll booth that pays us twice a year. First, the setup.
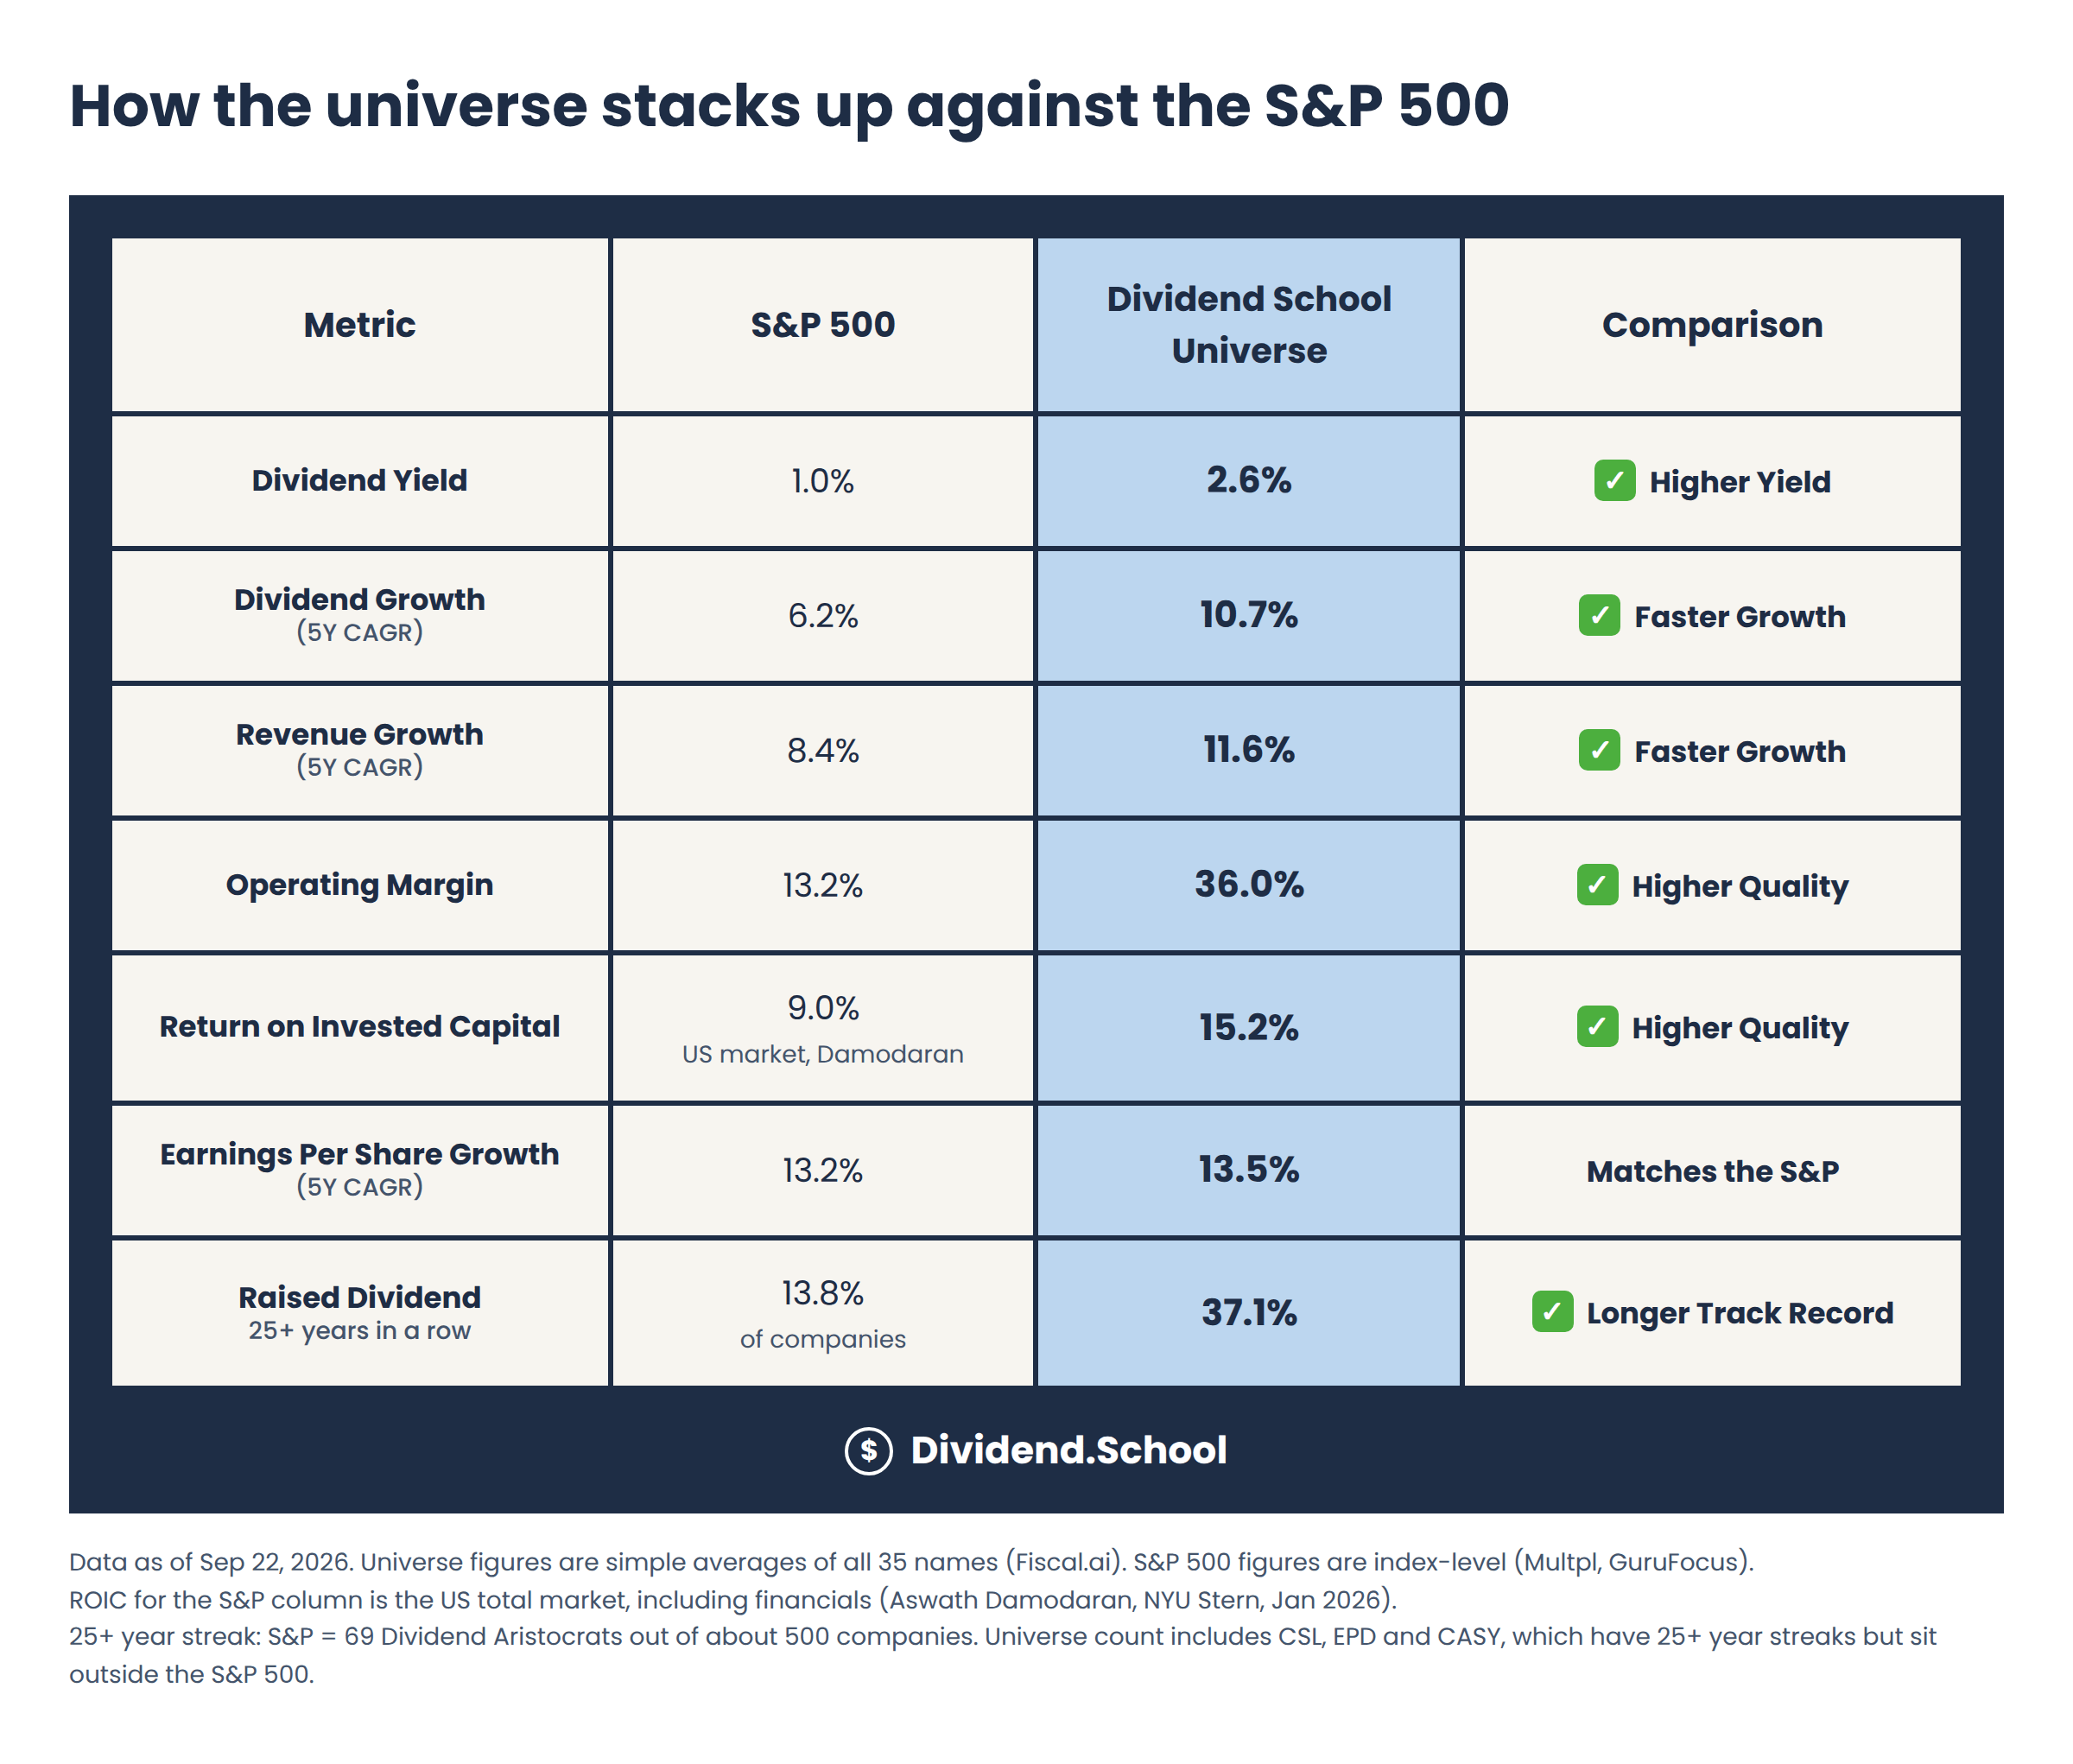
Every month we pick five names from the Dividend Universe trading below their Buy Below prices, the five I’d put new money into first, then tell each story straight from the filings. This week I re-ran the valuation on all 35 Universe names, so every Buy Below here is fresh. Every number comes from the latest 10-Ks, 10-Qs, and earnings releases, so feel free to check my work.
In today’s issue, we will cover:
The October glance table
Pick 1: WM (WM)
Pick 2: Realty Income (O)
Pick 3
Pick 4
Pick 5
The full board
How the safety score works, for new readers
Okay, let’s dive in and look at the list.
Pick 1: Waste Management (WM)
Quick stats
Recent price: $206.44
Buy below: $213.16
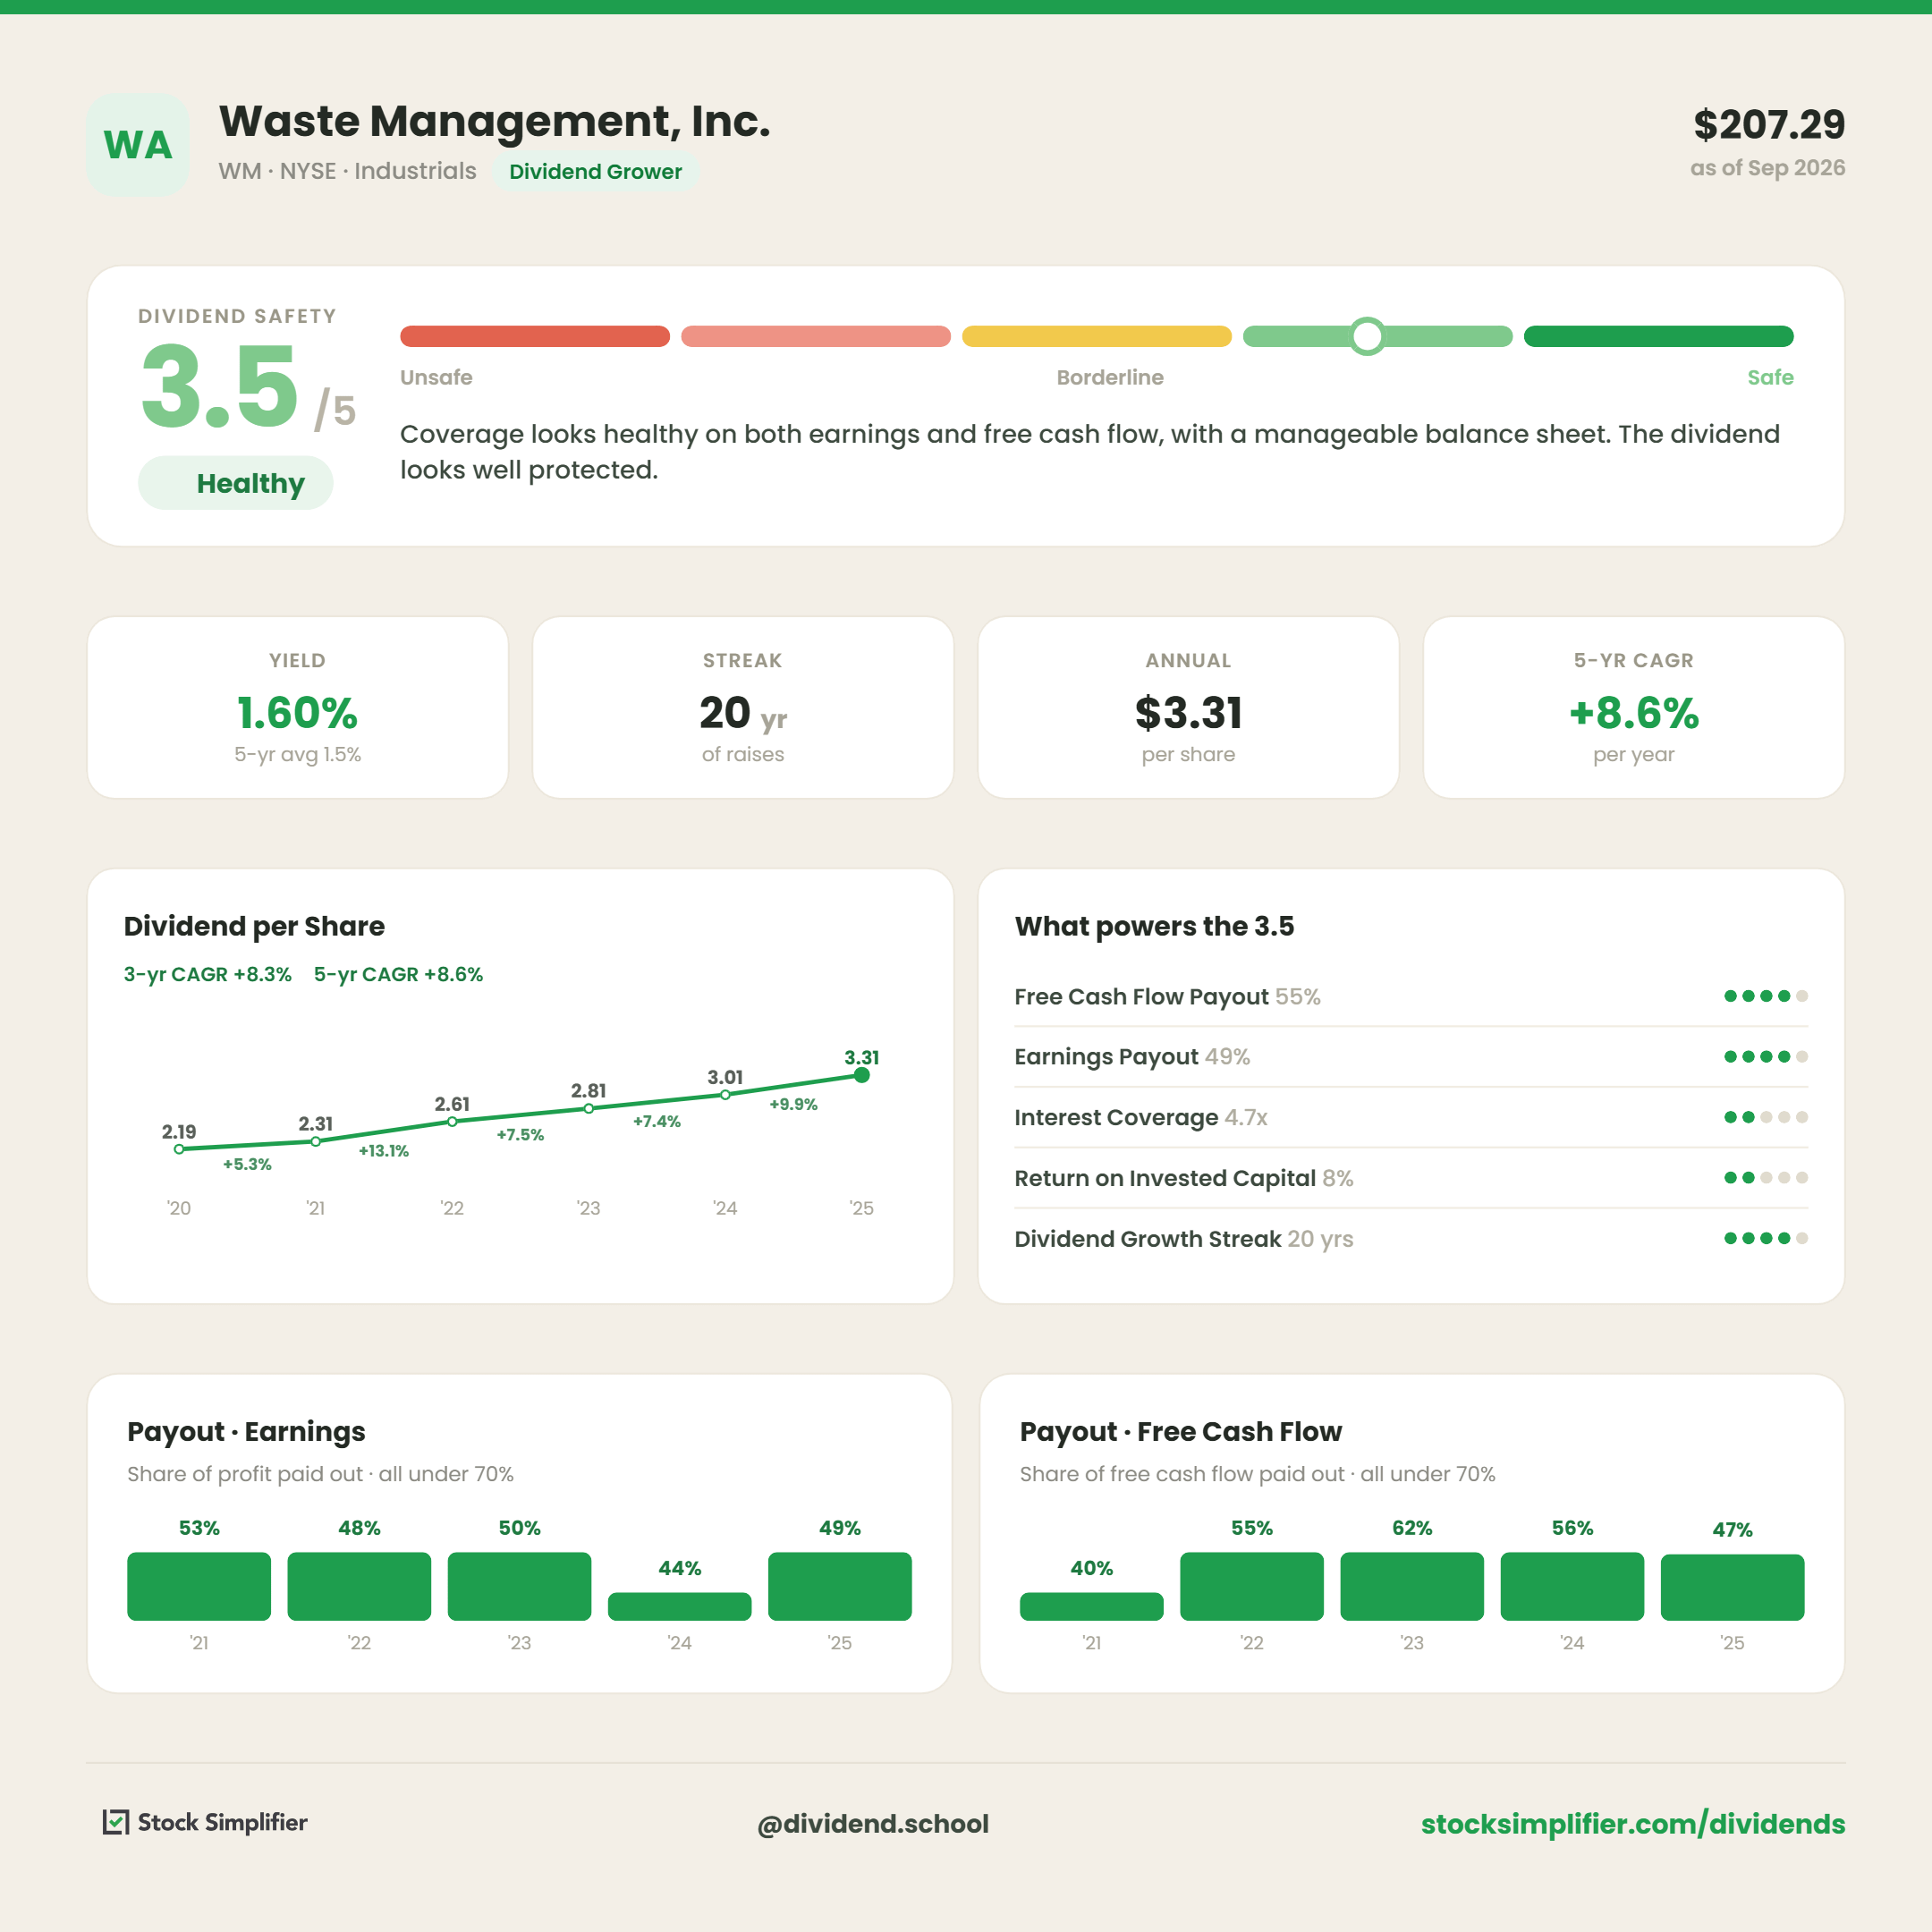
Safety score: 3.7 / 5, Healthy
Yield: 1.83%
Dividend: $0.945 per quarter, $3.78 annualized, last raise 14.5%
Streak: 23 straight years of raises
Sector: Waste collection and disposal
Why I like it
Free cash flow of $2.02 billion in the first half of 2026, up 57% from $1.29 billion a year earlier
Core price up 5.7% on collection and disposal in Q2, while volume fell
Full-year free cash flow guidance of $3.75 to $3.85 billion held, and the margin guide raised to 31.0% to 31.2%
253 solid waste landfills and four hazardous waste landfills owned or operated
Dividend raised 14.5% for 2026, the 23rd straight year, with $1 billion of buybacks in the first half
The thesis
So what does WM do?
It hauls away the trash from our homes and businesses, then charges again to bury it in a landfill it owns. That second part is the moat. Try getting a permit for a new landfill anywhere near a town, and you’ll see how few the country is going to get. One man’s trash is another man’s treasure, and WM owns the treasure.
What else do we get?
Pricing power while volumes shrink, which we don’t see often. Collection and disposal volume fell 1.8% in Q2, and WM still raised core price 5.7%. Customers don’t shop around for their trash hauler. Many times, we don’t have options. For example, when my wife and I moved to North Carolina, WM was our only option.
Why is free cash flow jumping?
Two reasons. WM spent heavily on renewable natural gas plants and recycling automation from 2022 through 2025, with $633 million of that growth spending in 2025 alone. That program is winding down, guided to $200 million this year, so more of the operating cash flow drops to free cash flow. The second reason is Stericycle, the medical waste business WM bought for $6.9 billion in November 2024. It’s now called WM Healthcare Solutions, and its adjusted margin reached 19% in Q2.
Boring business, beautiful cash flow.
Dividend safety
We score it 3.7 out of 5, Healthy. The dividend itself is well covered. The balance sheet is what holds the score down:
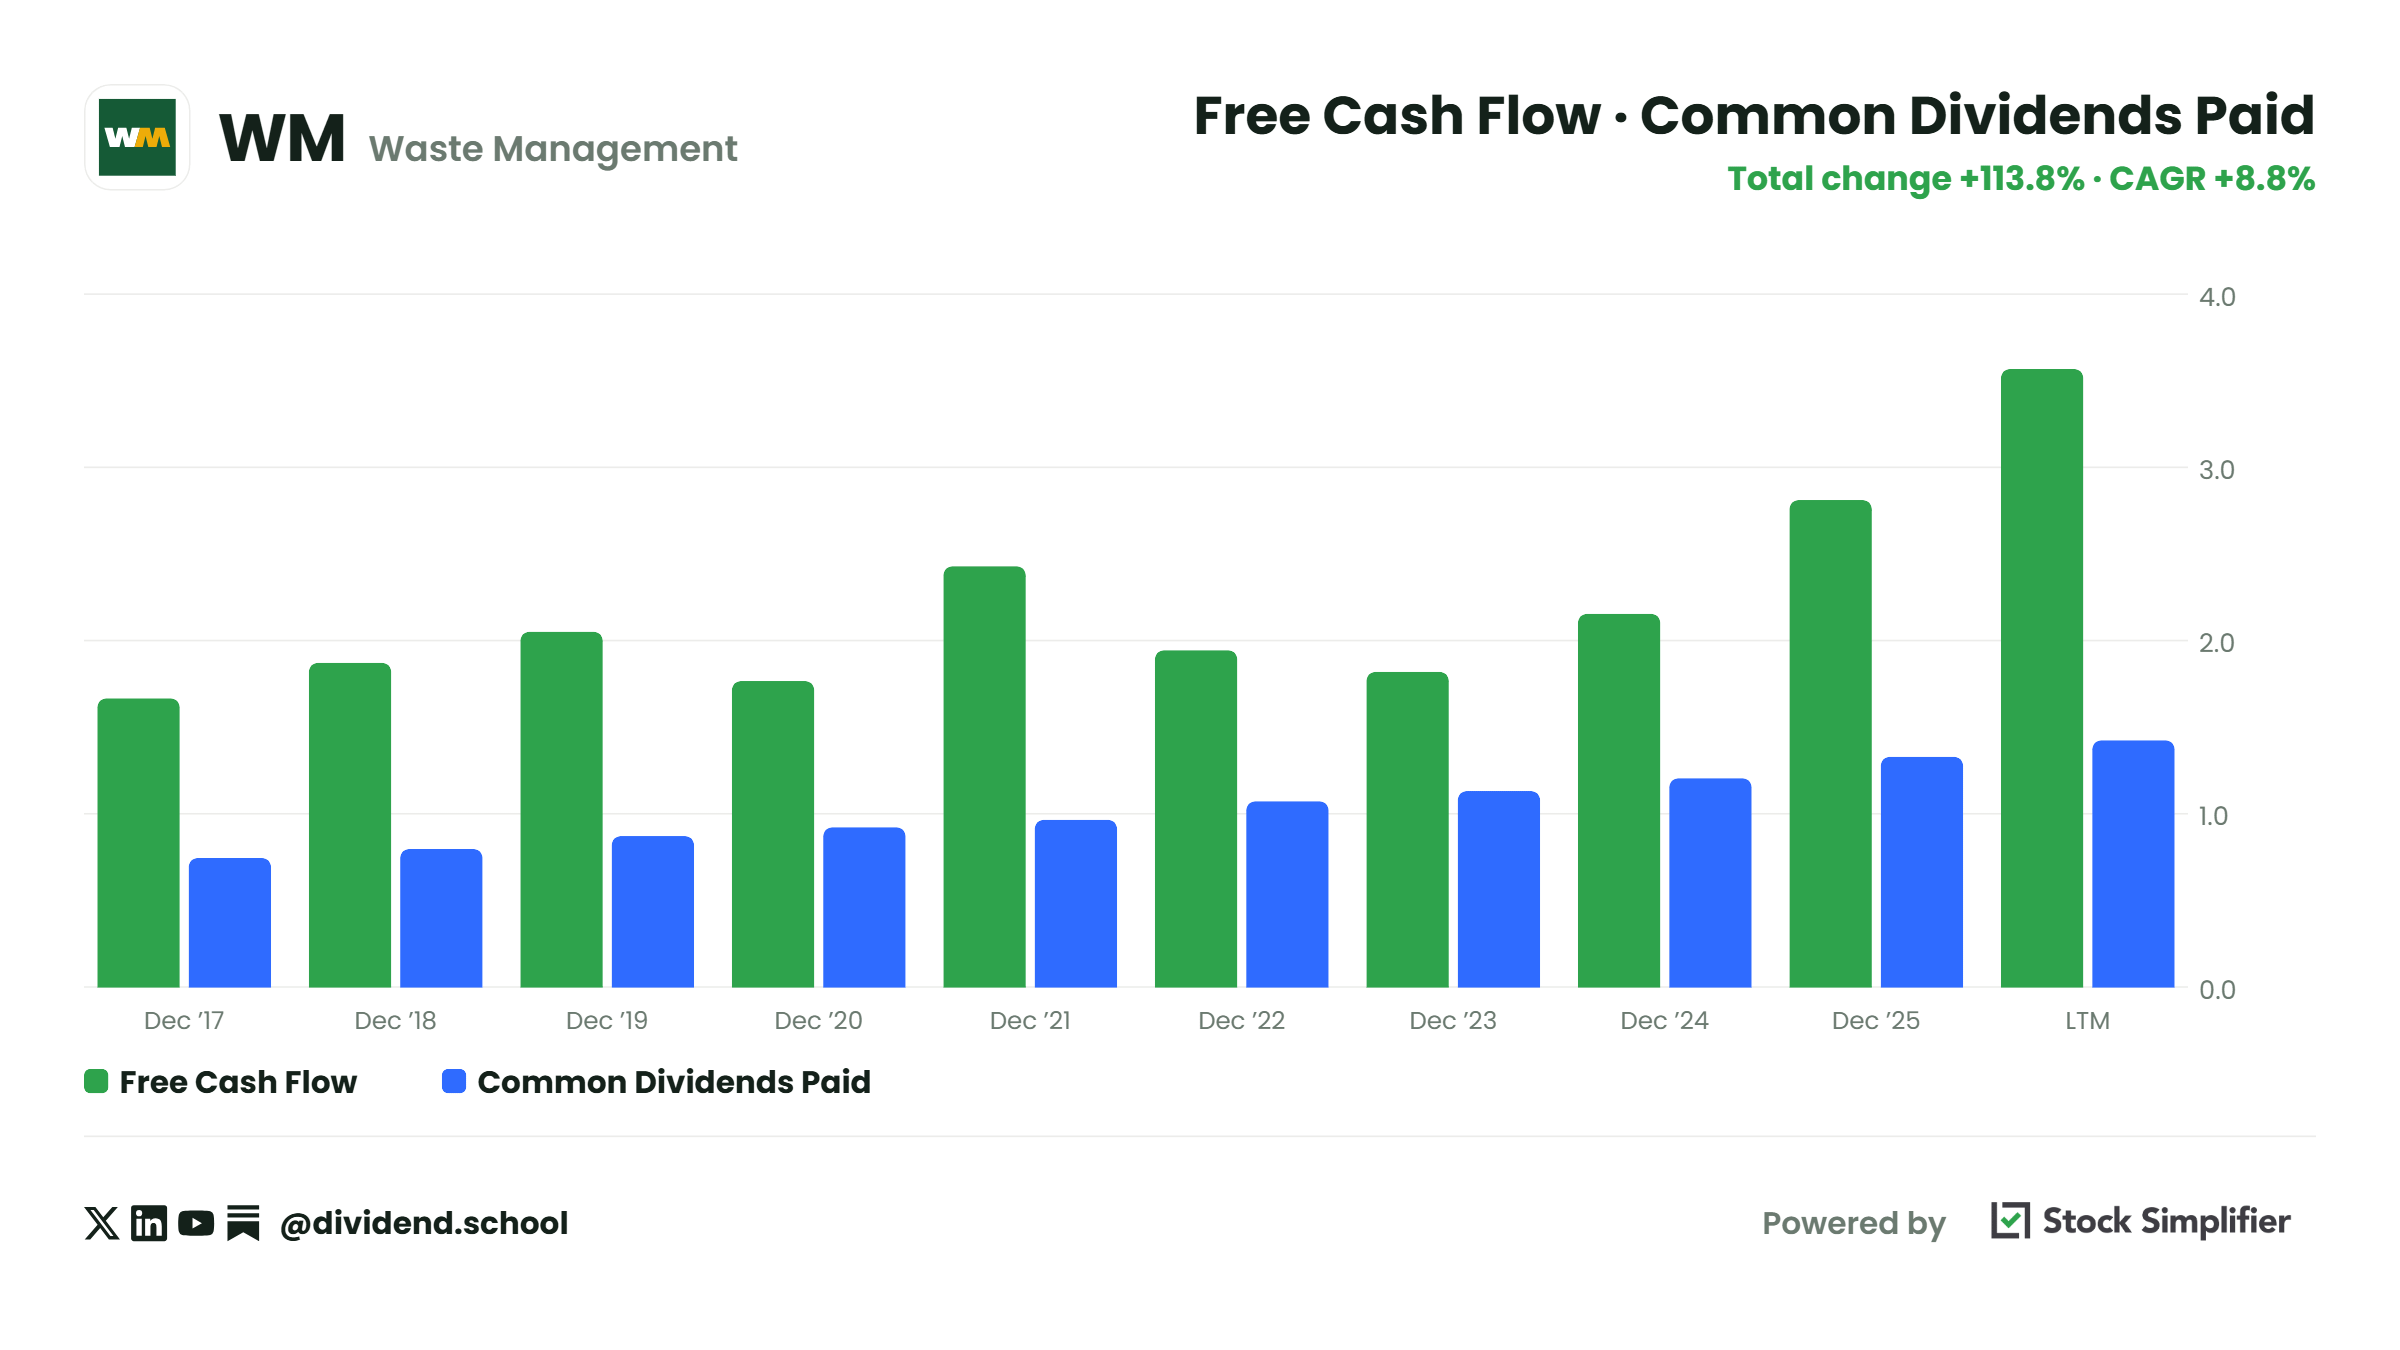
Dividends paid, trailing twelve months: $1.43 billion
Free cash flow, trailing twelve months: $3.67 billion
Payout on free cash flow: 39%
Payout on earnings: 50%
Net debt to EBITDA: 2.9 times
Interest coverage: 5 times
So why only Healthy?
The two weakest inputs in our score are leverage and interest coverage, and both trace back to the Stericycle debt. Interest expense rose from $598 million in 2024 to $912 million in 2025. WM says leverage is back inside its 2.5 to 3 times target, and a 39% payout gives the dividend plenty of room. A Healthy score here encourages you to watch the debt, not the dividend.
Valuation: buy below $213.16
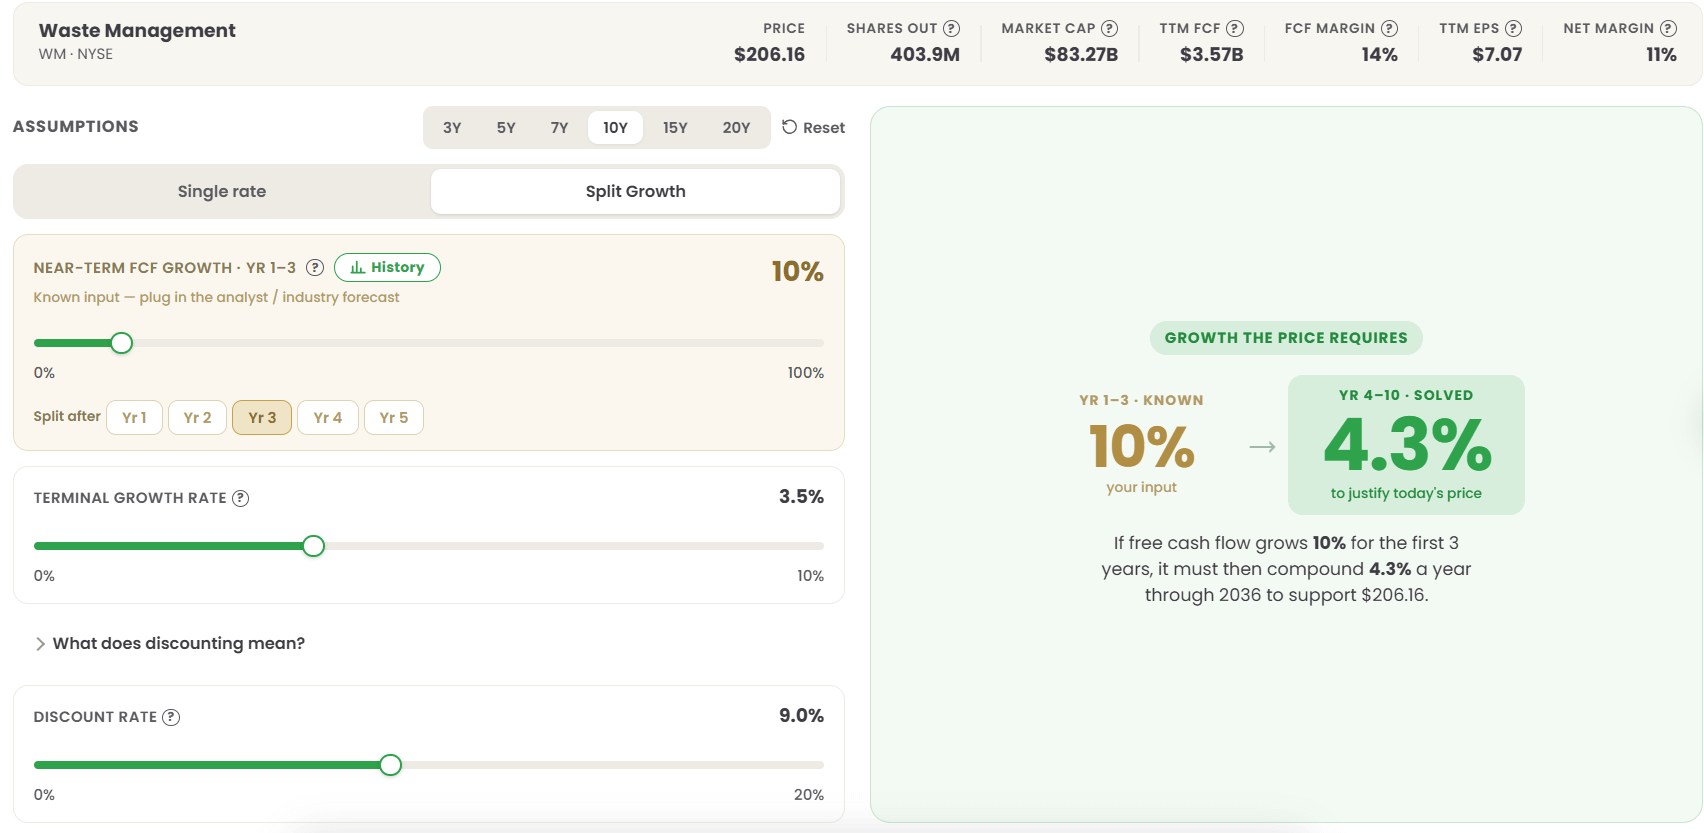
At $206.44, we’re paying $82.5 billion for the whole company (399.7M shares x $206.44). Against $3.67 billion of trailing free cash flow, that’s 22.5 times free cash flow.
Over the past five years, investors paid an average of 32.6 times for this business, so we’re buying well below the usual price. Big caveat here: part of that gap comes from free cash flow recovering as the green-energy spending rolls off, not only from the price falling. We shouldn’t count that whole discount as a bargain.
Our discounted cash flow model puts fair value at $274. Run our model backward, and today’s price implies 10% free cash flow growth for the next three years, and then 4.3% for the rest of the decade. Hint: this is all well below historical performance.
Is a 3.2% discount to the Buy Below enough?
For me, yes. The Buy Below already builds in our margin of safety, and the stock trades 20% below my fair value estimate. We have a cushion.
Green flags
First-half free cash flow up 57%, and full-year guidance held even after revenue guidance was trimmed
Core price up 5.7% in Q2, 6.3% in Q1
Adjusted margin guidance raised 20 basis points, to 31.0% to 31.2%
The Stericycle business went from a 1% reported margin in 2024 to 13.5% in 2025
WM plans to return 90% of 2026 free cash flow to shareholders, dividends plus $2 billion of buybacks
Red flags
Volume is shrinking. Collection and disposal volume fell 1.5% in Q1 and 1.8% in Q2, and WM cut its 2026 revenue guidance to $26.275 to $26.475 billion.
$23.4 billion of debt, and interest expense that rose from $598 million in 2024 to $912 million in 2025. This is the input that keeps the score at Healthy.
Legacy baggage from Stericycle and the landfills. Stericycle paid $56.9 million and signed a one-year deferred prosecution agreement with the DOJ in May over controlled-substance reporting from 2015 to 2020. The EPA also issued an order on the San Jacinto River Superfund site in April, where WM has $100 million recorded. On top of that, CEO Jim Fish retires in January, handing the job to President John Morris. Q3 results land October 27.
Pick 2: Realty Income (O)
Quick stats
Recent price: $55.35
Buy below: $64.25
Safety score: 4.3 / 5, Safe
Yield: 5.89%
Dividend: $0.2715 per month, $3.258 annualized, last raise 0.2% (September 8)
Streak: 136 increases since 1994, 675 monthly dividends in a row
Sector: Net-lease REIT
Why I like it
2026 AFFO guidance raised twice, to $4.44 to $4.45 per share from $4.38 to $4.42
98.8% occupancy across 15,588 properties and 1,798 clients
Net debt of 5.4 times adjusted EBITDAre, rated A3 by Moody’s and A- by S&P
Fitch assigned an A rating in August, the first net-lease REIT with an A-category rating
Q2 acquisitions at a 7.3% initial cash yield, with investment guidance raised to $10 billion
The thesis
Realty Income was in our Buy tier in September, and it moves up this month for two reasons: the price fell, and I cut the Buy Below.
The stock went from $63.17 on August 20 to $55.35 on September 28, down 12.4% in five weeks. Nothing happened to the rent. Occupancy is 98.8%, and management raised AFFO guidance in August.
So why did it fall?
Rates. REITs trade like bonds when rates move, and rates moved up in September. When Treasurys pay more, a 5.9% yield looks less special, and investors sell first and read the filings later.
What does Realty Income do?
It owns buildings and leases them to 1,798 tenants, mostly on long-term net leases. A net lease means the tenant pays property taxes, insurance, and maintenance. Realty Income collects the rent and mails most of it to us every month. Grocery stores, convenience stores, dollar stores, home improvement, a Vegas casino, and now data centers. Diversification at its finest.
I love a monthly paycheck, frankly.
Dividend safety
We score it 4.3 out of 5, Safe. But as REIT investors, we have to understand how the metrics are different. REIT’s speak a different language; FFO and AFFO are our earnings and cash flows.
Dividends paid, trailing twelve months: $3.24 per share
GAAP net income, trailing twelve months: $1.37 per share
Payout on net income: 236%
AFFO, trailing twelve months: $4.38 per share
Payout on AFFO: 74%
Same dividend, two very different answers. Which one do we trust?
AFFO. It’s the REIT equivalent of free cash flow for a “normal” business, and the AFFO payout ratio is the REIT version of the dividend payout ratio we already know. Net income subtracts depreciation on 15,588 properties, which is an accounting charge, not cash leaving the building. Well-located real estate doesn’t wear out on the accountants' schedule. AFFO adds that back and subtracts the real cash costs, so it tells us what’s left to pay the dividend. Seventy-four cents of every dollar is a comfortable place for a REIT.
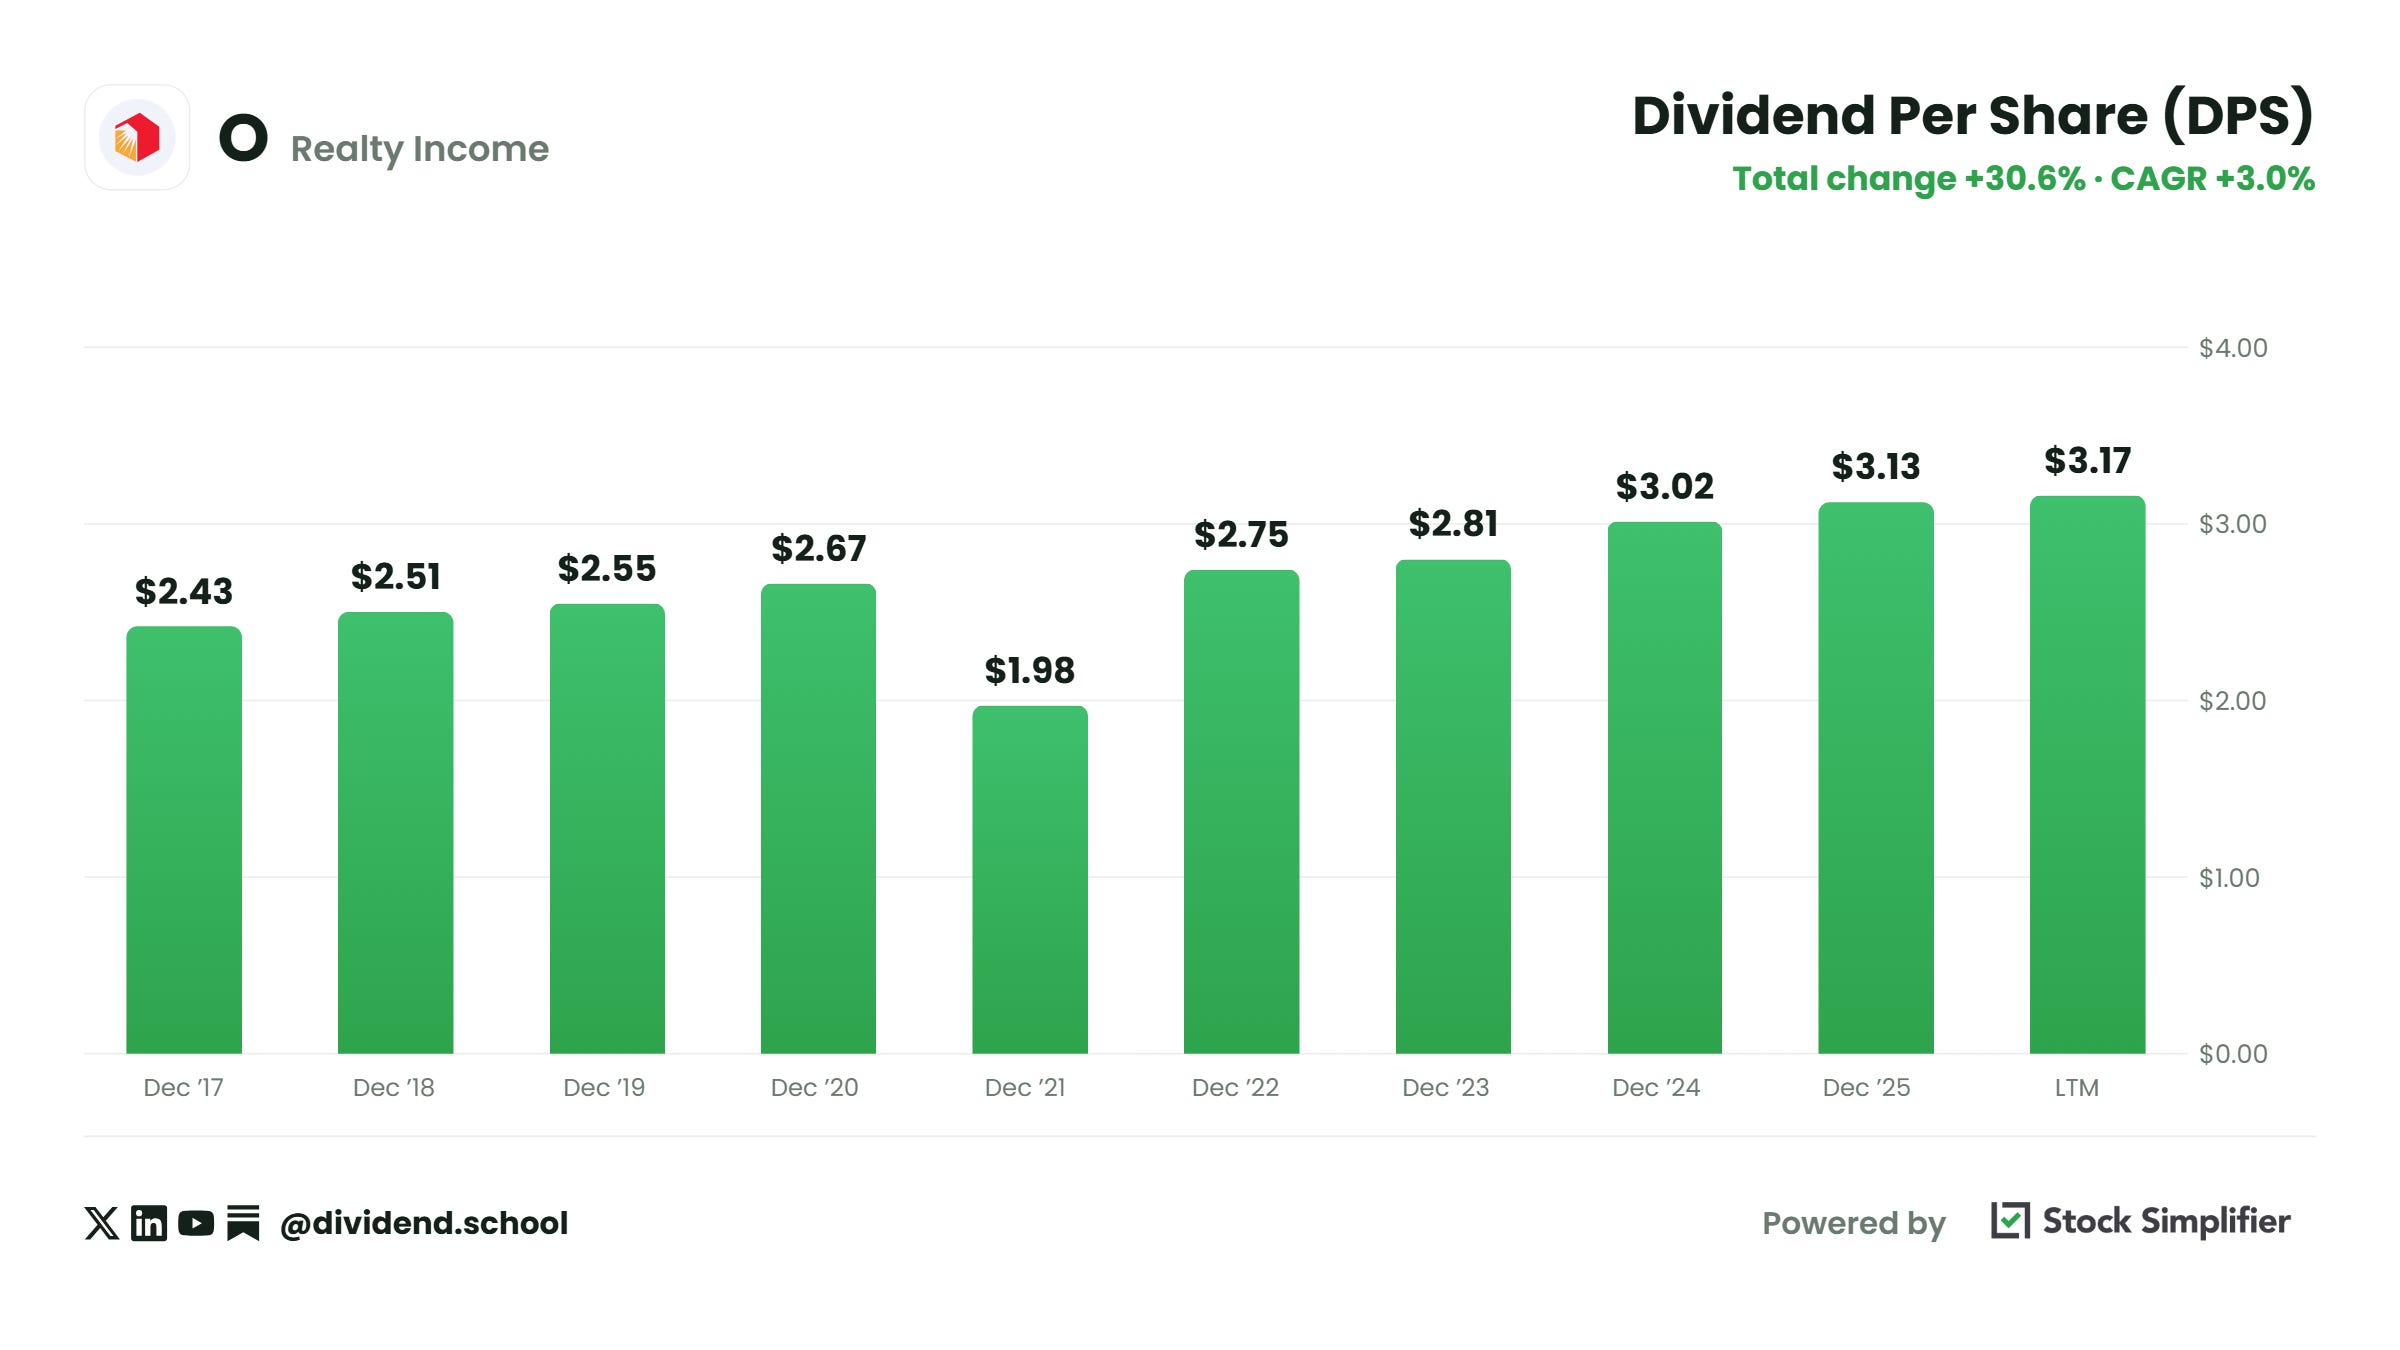
The caveat: this dividend barely grows anymore. The September raise was $0.0005 a month, 0.18%, and for the last 10 years, we have seen 3.0% growth.
Realty Income is an income anchor, not a dividend grower, and slow dividend growth is one of the two inputs holding the score below the top of the range. Leverage at 5.4 times EBITDAre is the other.
Valuation: buy below $64.25
At $55.35, we’re paying 12.5 times AFFO ($55.35 / $4.445 guidance midpoint). Over the past five years, the average was 15.3 times.
Is that cheap?
Cheaper than usual, with one asterisk. That average includes 2021 at 19.9 times, when rates sat near zero. Leave 2021 out and the four-year average is 14.1 times, so the discount is smaller than it first looks, but it’s still there.
Flip the multiple over and we get an AFFO yield of 8%. We collect 5.9% in cash and the company keeps the rest to buy more buildings.
Our discounted cash flow model using AFFO (FCF doesn’t work for REITs) puts fair value at $69. Our reverse DCF says today’s price implies 4.0% for the next three years, and 0.9% for the rest of the decade. I have more faith in management than that.
At 13.9% below the Buy Below, I’m happy to collect 5.9% while we wait for rates to settle down.
Green flags
AFFO guidance raised in May and again in August
Fitch’s A rating, on top of A3 and A- from Moody’s and S&P
Investment guidance raised from $8 billion to $10 billion for the year
Private capital is growing. KKR agreed in September to pay €528 million for 49% of a European portfolio, with Realty Income keeping the management fees.
Re-leased properties at 102.7% of the old rent in Q2
Red flags
Tenant credit. Walgreens, 3% of rent, was taken private in 2025 and no longer carries a credit rating. Family Dollar, 2.6% of rent, closed 350 stores in ten months under its new owner. Neither tenant has filed for bankruptcy, and neither shows up as a problem in Realty Income’s own filings. We watch them anyway.
Dilution. The share count went from 591 million at the end of 2021 to 946 million in June, up 60%, while AFFO per share grew 4.5% a year. In August, it added $1 billion of convertible notes that can turn into shares at $83.55.
Refinancing. $3.9 billion of debt comes due in 2027 at an average rate of 2.93%, and replacing it will cost more. The stock also trades below the $58.34 price of the shares it already sold forward, which makes new equity harder to use.
That’s two complete workups, free: the full thesis, the safety math, the Buy Below price, and the flags on each.
Below the paywall, members get:
A Dividend King that just raised its dividend 14% for the 50th straight year, pays out 21% of its free cash flow, and has cut its share count by a quarter since 2020. Plus the $10 billion rumor hanging over it.
The exchange behind the world’s interest rate, oil, and stock index futures: a 65% operating margin, two dividends that added up to 4.31% last year, and a Borderline 2.2 safety score that isn’t what it looks like.
The Dividend King from the top of this issue: 51 straight raises, 21.6% below its Buy Below, and 8.9% cheaper than when we featured it in September.
The full board: all 35 Universe names, tiered, each against its Buy Below.
Every number is pulled from the latest 10-Ks, 10-Qs, and earnings releases, with filing dates noted so you can check my work.
Membership is $369 a year or $35 a month, with a 7-day free trial and a 30-day money-back guarantee.