

One of the best franchise businesses in the world trades at 16.8 times free cash flow. In its own history, the market has never paid less than 22.9 times for a full year, and the median is 30.5.
At $313.32, where we re-ran it in late October, the market assumed free cash flow grows 1% a year for the next five years. Meanwhile, the company raised its dividend 14.4% this year, its 13th straight raise, and the dividend takes 40 cents of every dollar of free cash flow.
Wall Street is worried about a slow year and a new CEO. I own it.
That name opens the list, and a 7.5% payer comes right after it. Our number one pick, the company whose indexes sit behind $2.9 trillion of ETFs, closes it. First, the setup.
Every month we pick five names from the Dividend Universe trading below their Buy Below prices, the five I’d put new money into first, then tell each story straight from the filings. In late October, I re-ran the valuation on the Universe with third-quarter numbers, so every Buy Below here is fresh.
In today’s issue, we will cover:
The November glance table
Pick 5: Domino’s (DPZ)
Pick 4: VICI Properties (VICI)
Pick 3
Pick 2
Pick 1
The full board
How the safety score works, for new readers
Okay, let’s dive in and look at the list.
Paid Dividend School Pro subscribers get all five workups, the full board, and a deep dive every month. Seven days free.
Pick 5: Domino’s (DPZ)
Quick stats
Recent price: $323.16
Buy below: $422.11
Safety score: 3.9 / 5, Healthy
Yield: 2.46%
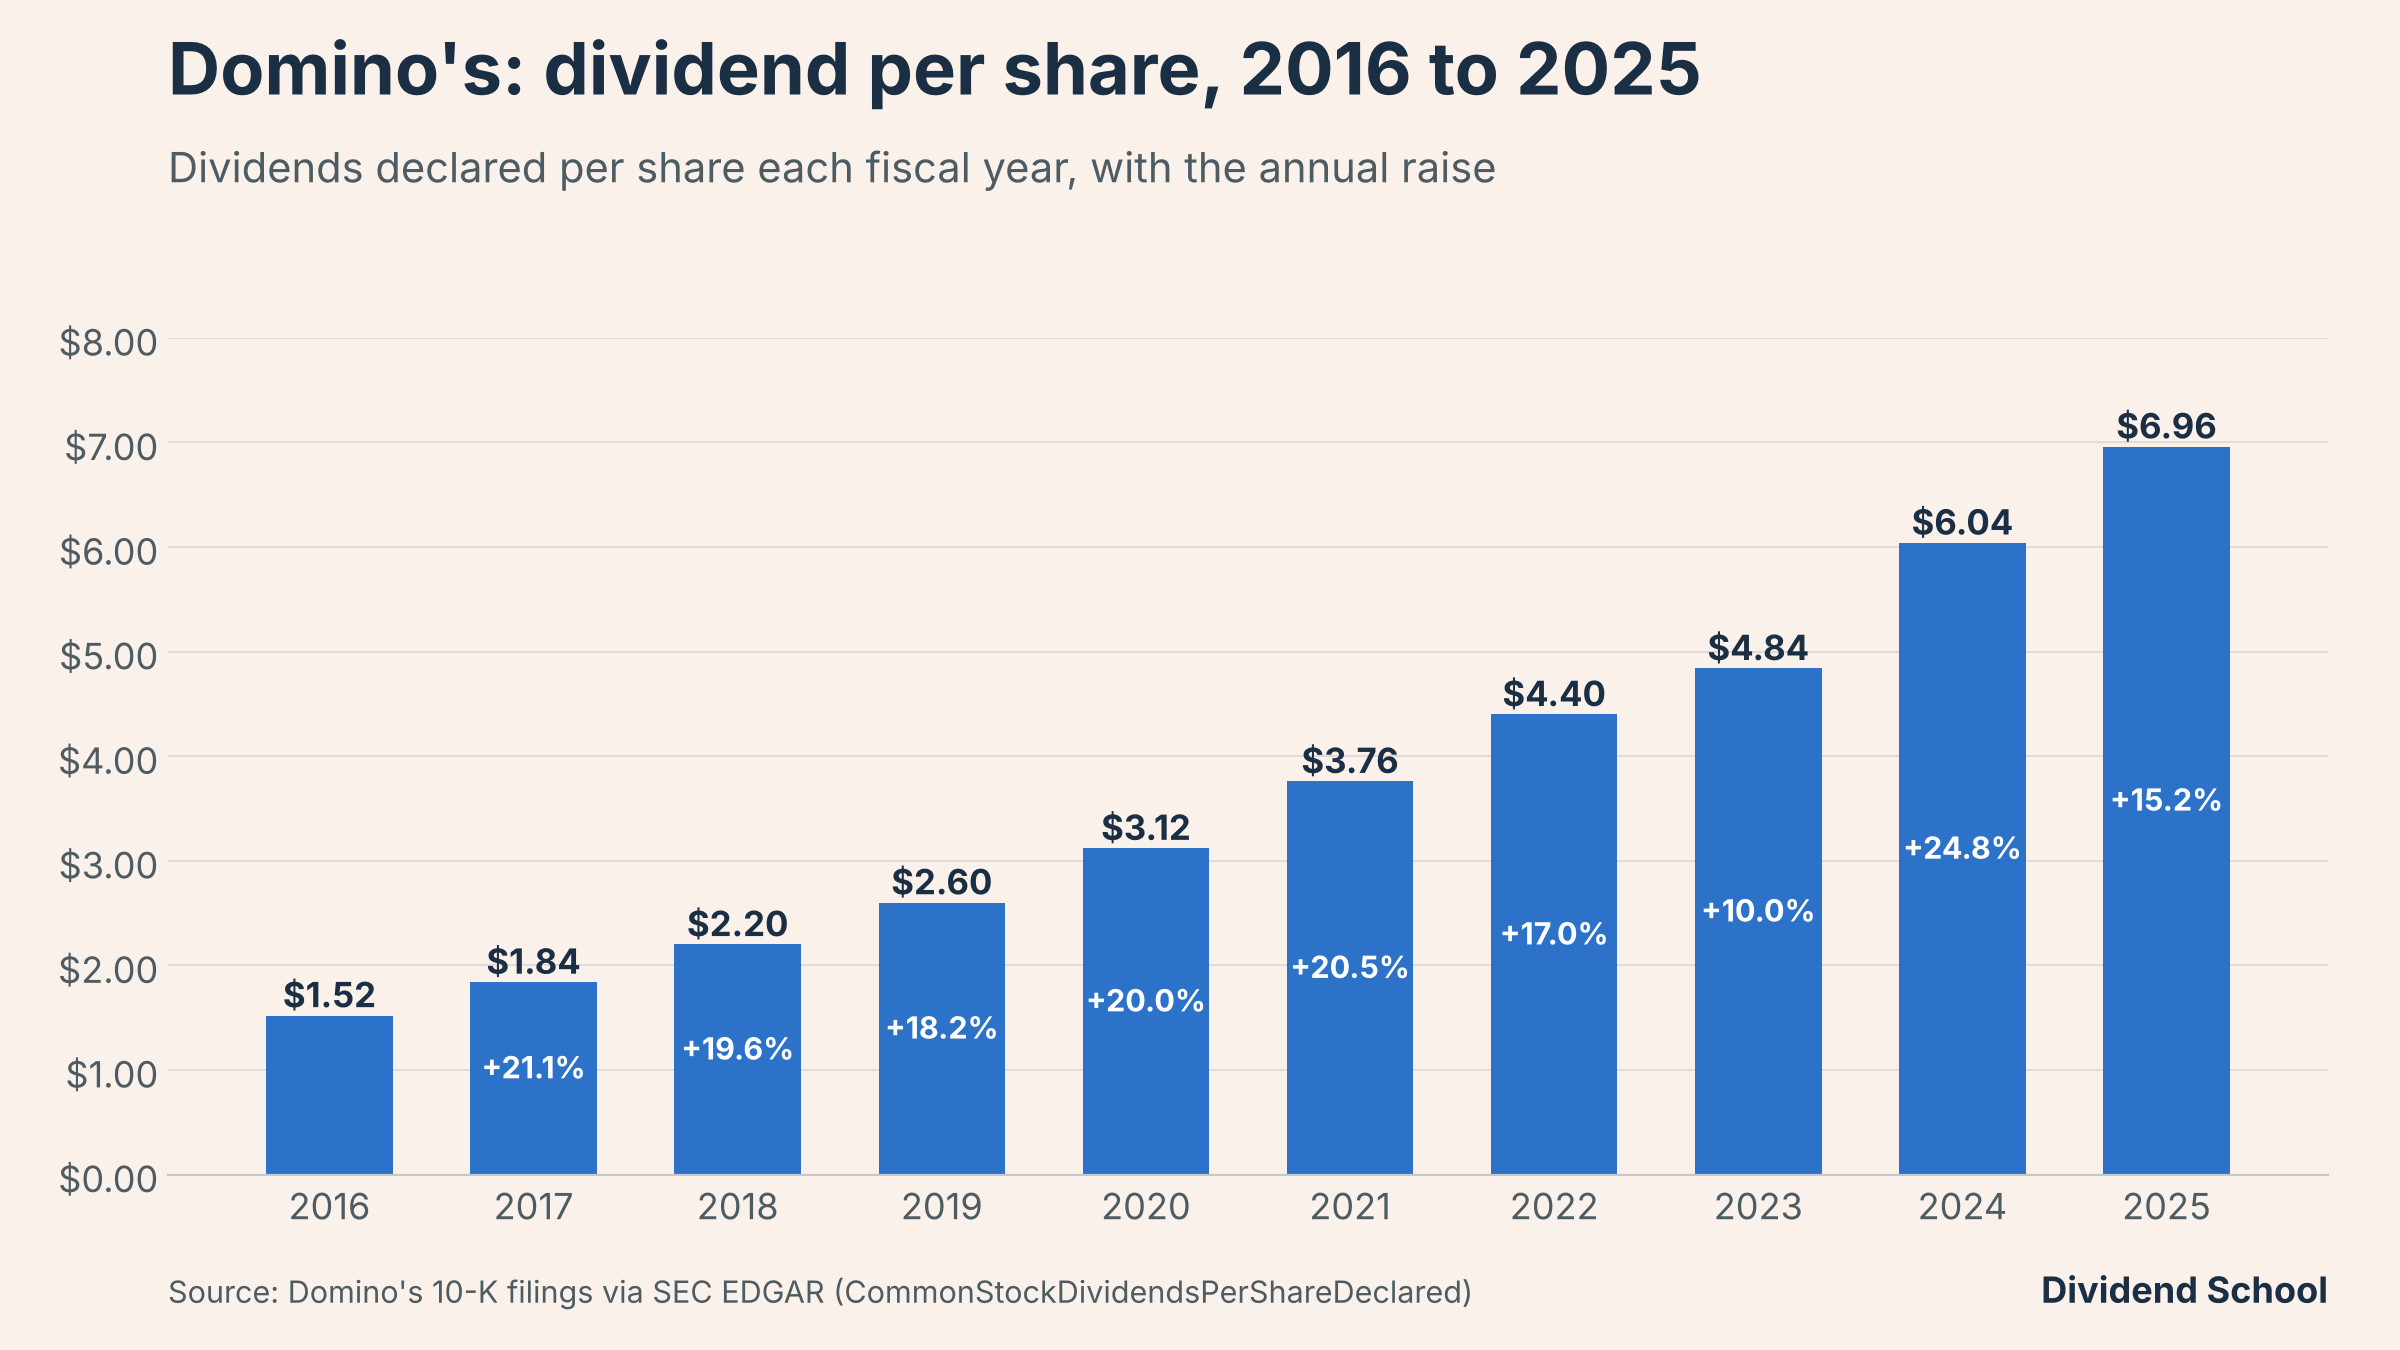
Dividend: $1.99 per quarter, $7.96 annualized, last raise 14.4%
Streak: 13 straight annual raises since the first dividend in 2013
Sector: Pizza delivery and carryout franchisor
Why I like it
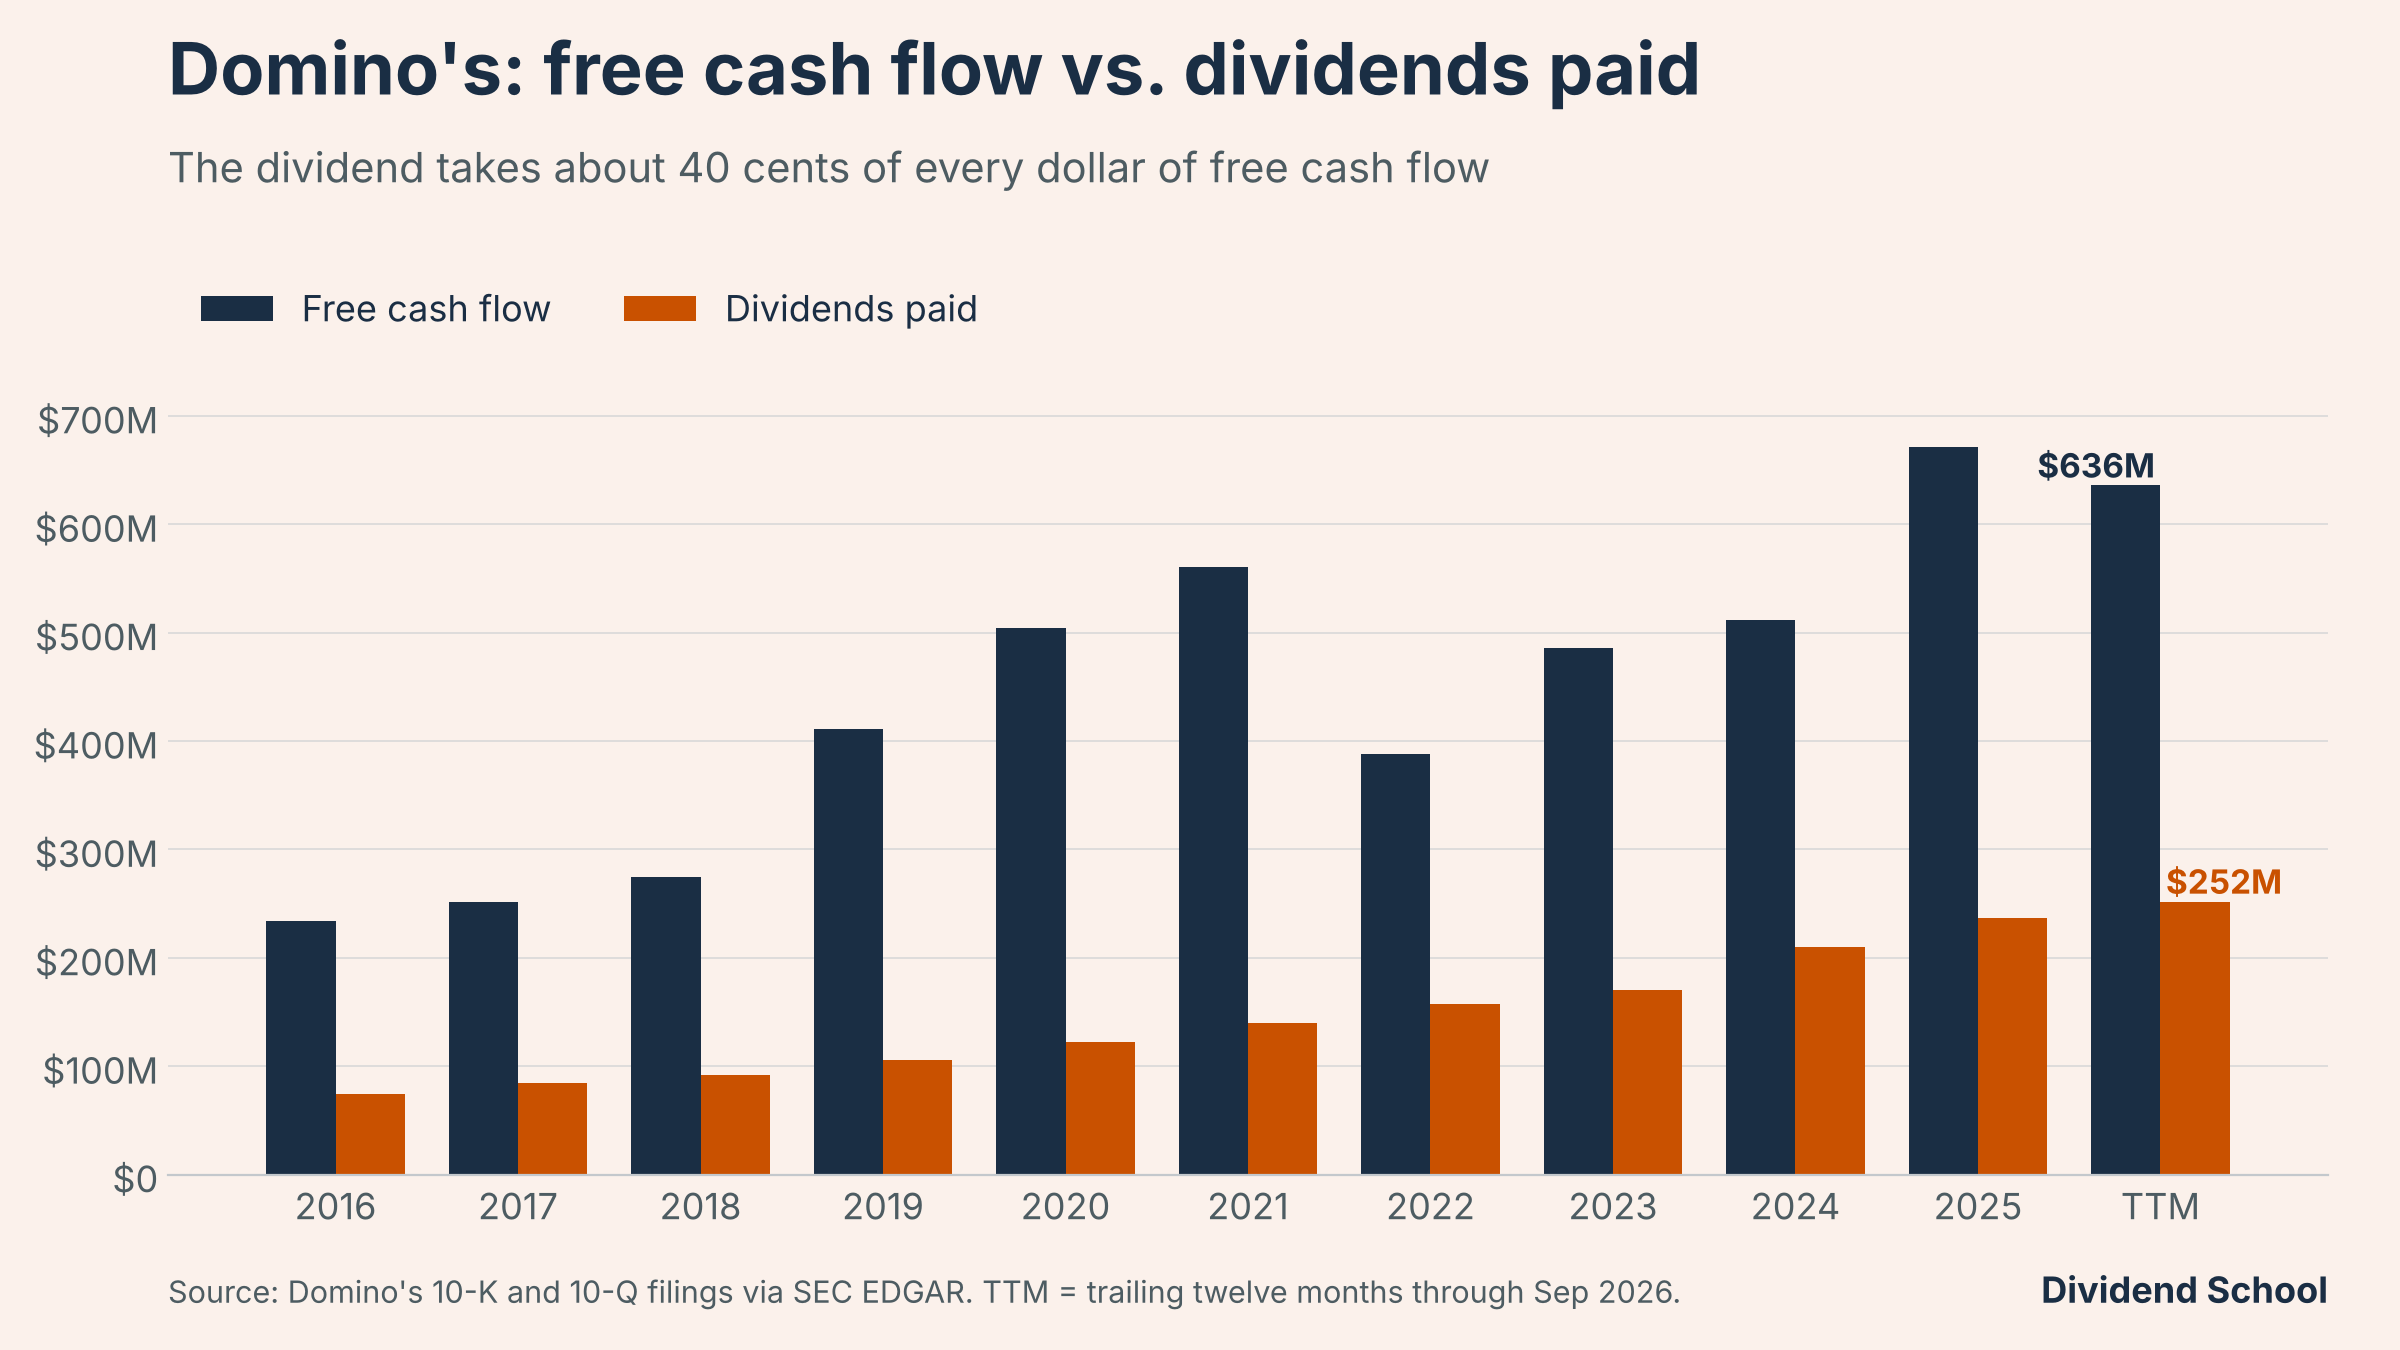
Dividends took 39.6% of free cash flow over the trailing twelve months
Q3 operating income up 8.3% to $241.8 million and earnings per share up 12.7% to $4.60, on US same-store sales up 0.3%
956 net new stores over the last four quarters, 22,706 in all, 99% of them franchised
Leverage ratio down to 4.2 times from 4.5 times a year ago, near the bottom of its usual 4 to 6 times range
Dividend raised 14.4% to $1.99 a quarter in February, the 13th straight raise
The thesis
I own Domino’s, and we did a full deep dive on it in September. This is the follow-up with third-quarter numbers.
So what does Domino’s do?
It franchises pizza stores, 22,706 of them, and owns almost none. Franchisees pay Domino’s a royalty on every pizza, and most of them also buy their dough, cheese, and boxes from Domino’s supply chain. That makes Domino’s a royalty stream with a food distribution business attached.
The moat is density. More stores in a town means shorter delivery times, hotter pizza, and lower cost per order, which brings more orders, which pays for more stores. Domino’s has been running that loop for decades, and now it’s adding DoorDash and Uber Eats on top.
Why is it so cheap?
A rough year on growth. US same-store sales rose 0.3% in Q3, against 5.2% a year earlier, and international same-store sales are flat for the year. On the October call, management cut its 2026 targets again: US net new stores to 125 to 150, from 175, and operating income growth to mid-single digits. Franchisee profits are down from a year ago, and new stores depend on franchisees making money. On top of that, Joe Jordan took over as CEO on October 1.
The business still grew. Operating income rose 8.3% in the quarter, and fewer shares pushed earnings per share up 12.7%. Pizza at a bargain-bin price.
Dividend safety
We score it 3.9 out of 5, Healthy:
Payout on earnings: 43.9%
Payout on free cash flow: 39.6%
Net debt to EBITDA: 4.3 times
Interest coverage: 5 times
Shareholders’ equity: negative $3.96 billion
Negative equity? Should that scare us?
Not by itself. Domino’s borrows against its royalty stream in a structure called a securitization and has used the money for buybacks for years, so the equity line went negative on purpose. What matters for us is the dividend, and free cash flow covers it two and a half times.
The caveat is the refinancing, and it’s the input holding the score at Healthy. $1.32 billion of notes reach their repayment date in July 2027, and Domino’s says it expects to refinance them “at higher interest rates.” If it missed that date, an extra 5% a year of interest would kick in and the cash flow would go to paying down the debt. That’s not the base case, but it’s why the date matters.
The other weak input is free cash flow, which fell 7.2% over the first nine months. Dividends plus buybacks took 100.7% of trailing free cash flow.
Valuation: buy below $422.11
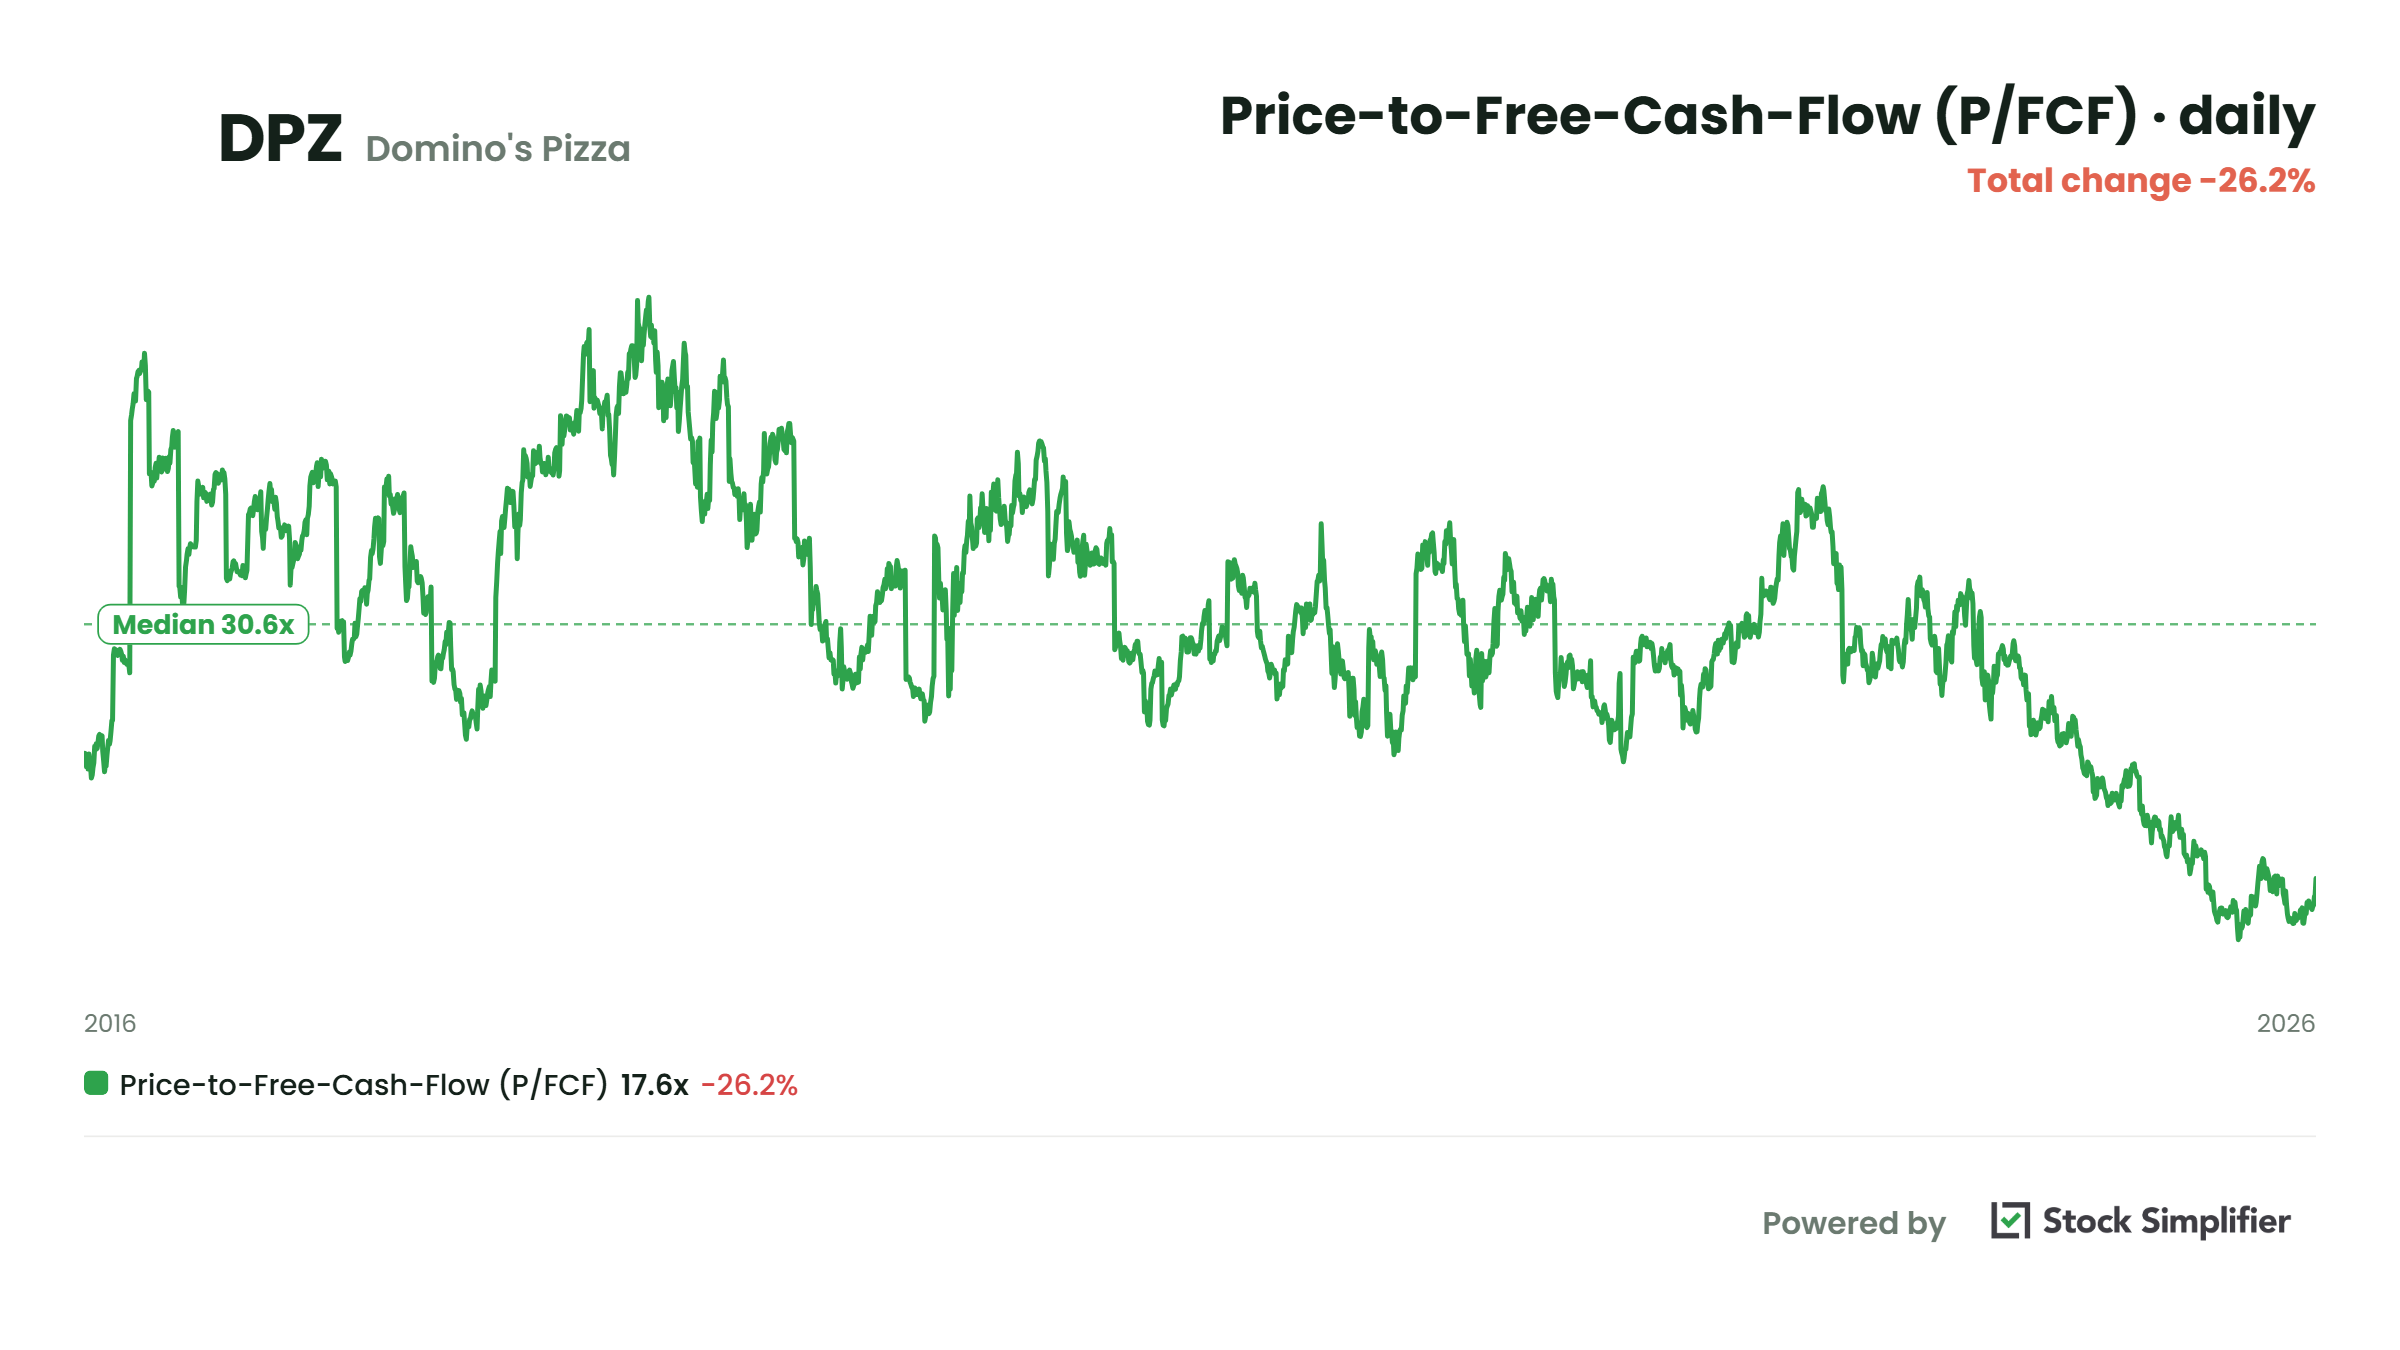
At $323.16, we’re paying 16.8 times free cash flow.
Is that cheap?
Very. In its own history, the market paid between 22.9 and 40.8 times free cash flow, with a median of 30.5. We’re buying well below the cheapest year in that history. The price-to-earnings ratio is 17.8 times.
Our discounted cash flow model puts fair value at $496.60, using the 9.1% a year Domino’s grew free cash flow per share over the last five years and a 9% discount rate, a notch above the 8.5% we use for our top-tier names. When we re-ran it in late October, at $313.32, the market was pricing in 1% a year growth for five years.
What does that tell us?
That the price assumes Domino’s barely grows again. For a company still adding nearly a thousand net new stores a year, that’s too pessimistic.
At 23.4% below the Buy Below, the biggest discount on the list, I’m happy to keep owning it.
Green flags
Earnings per share up 12.7% in Q3, helped by a 3% lower share count
Supply chain margin up 0.9 points to 12.2%
The dividend is covered 2.5 times by free cash flow
Interest coverage up to 5 times from 4.9 times in 2025
$1.15 billion left on the buyback authorization, about 10.8% of the company at today’s price
Red flags
Growth targets cut a third time this year. US net new stores went to 125 to 150 from 175, international same-store sales to flat, and operating income growth to mid-single digits.
Franchisee profits are down from a year ago, and they drive new store openings. International same-store sales are down 0.1% through nine months, putting a 32-year growth streak at risk.
$1.32 billion of notes come due for refinancing in July 2027 at higher rates, and free cash flow fell 7.2% through nine months.
Pick 4: VICI Properties (VICI)
Quick stats
Recent price: $24.54
Buy below: $29.43
Safety score: 4.3 / 5, Safe
Yield: 7.5%
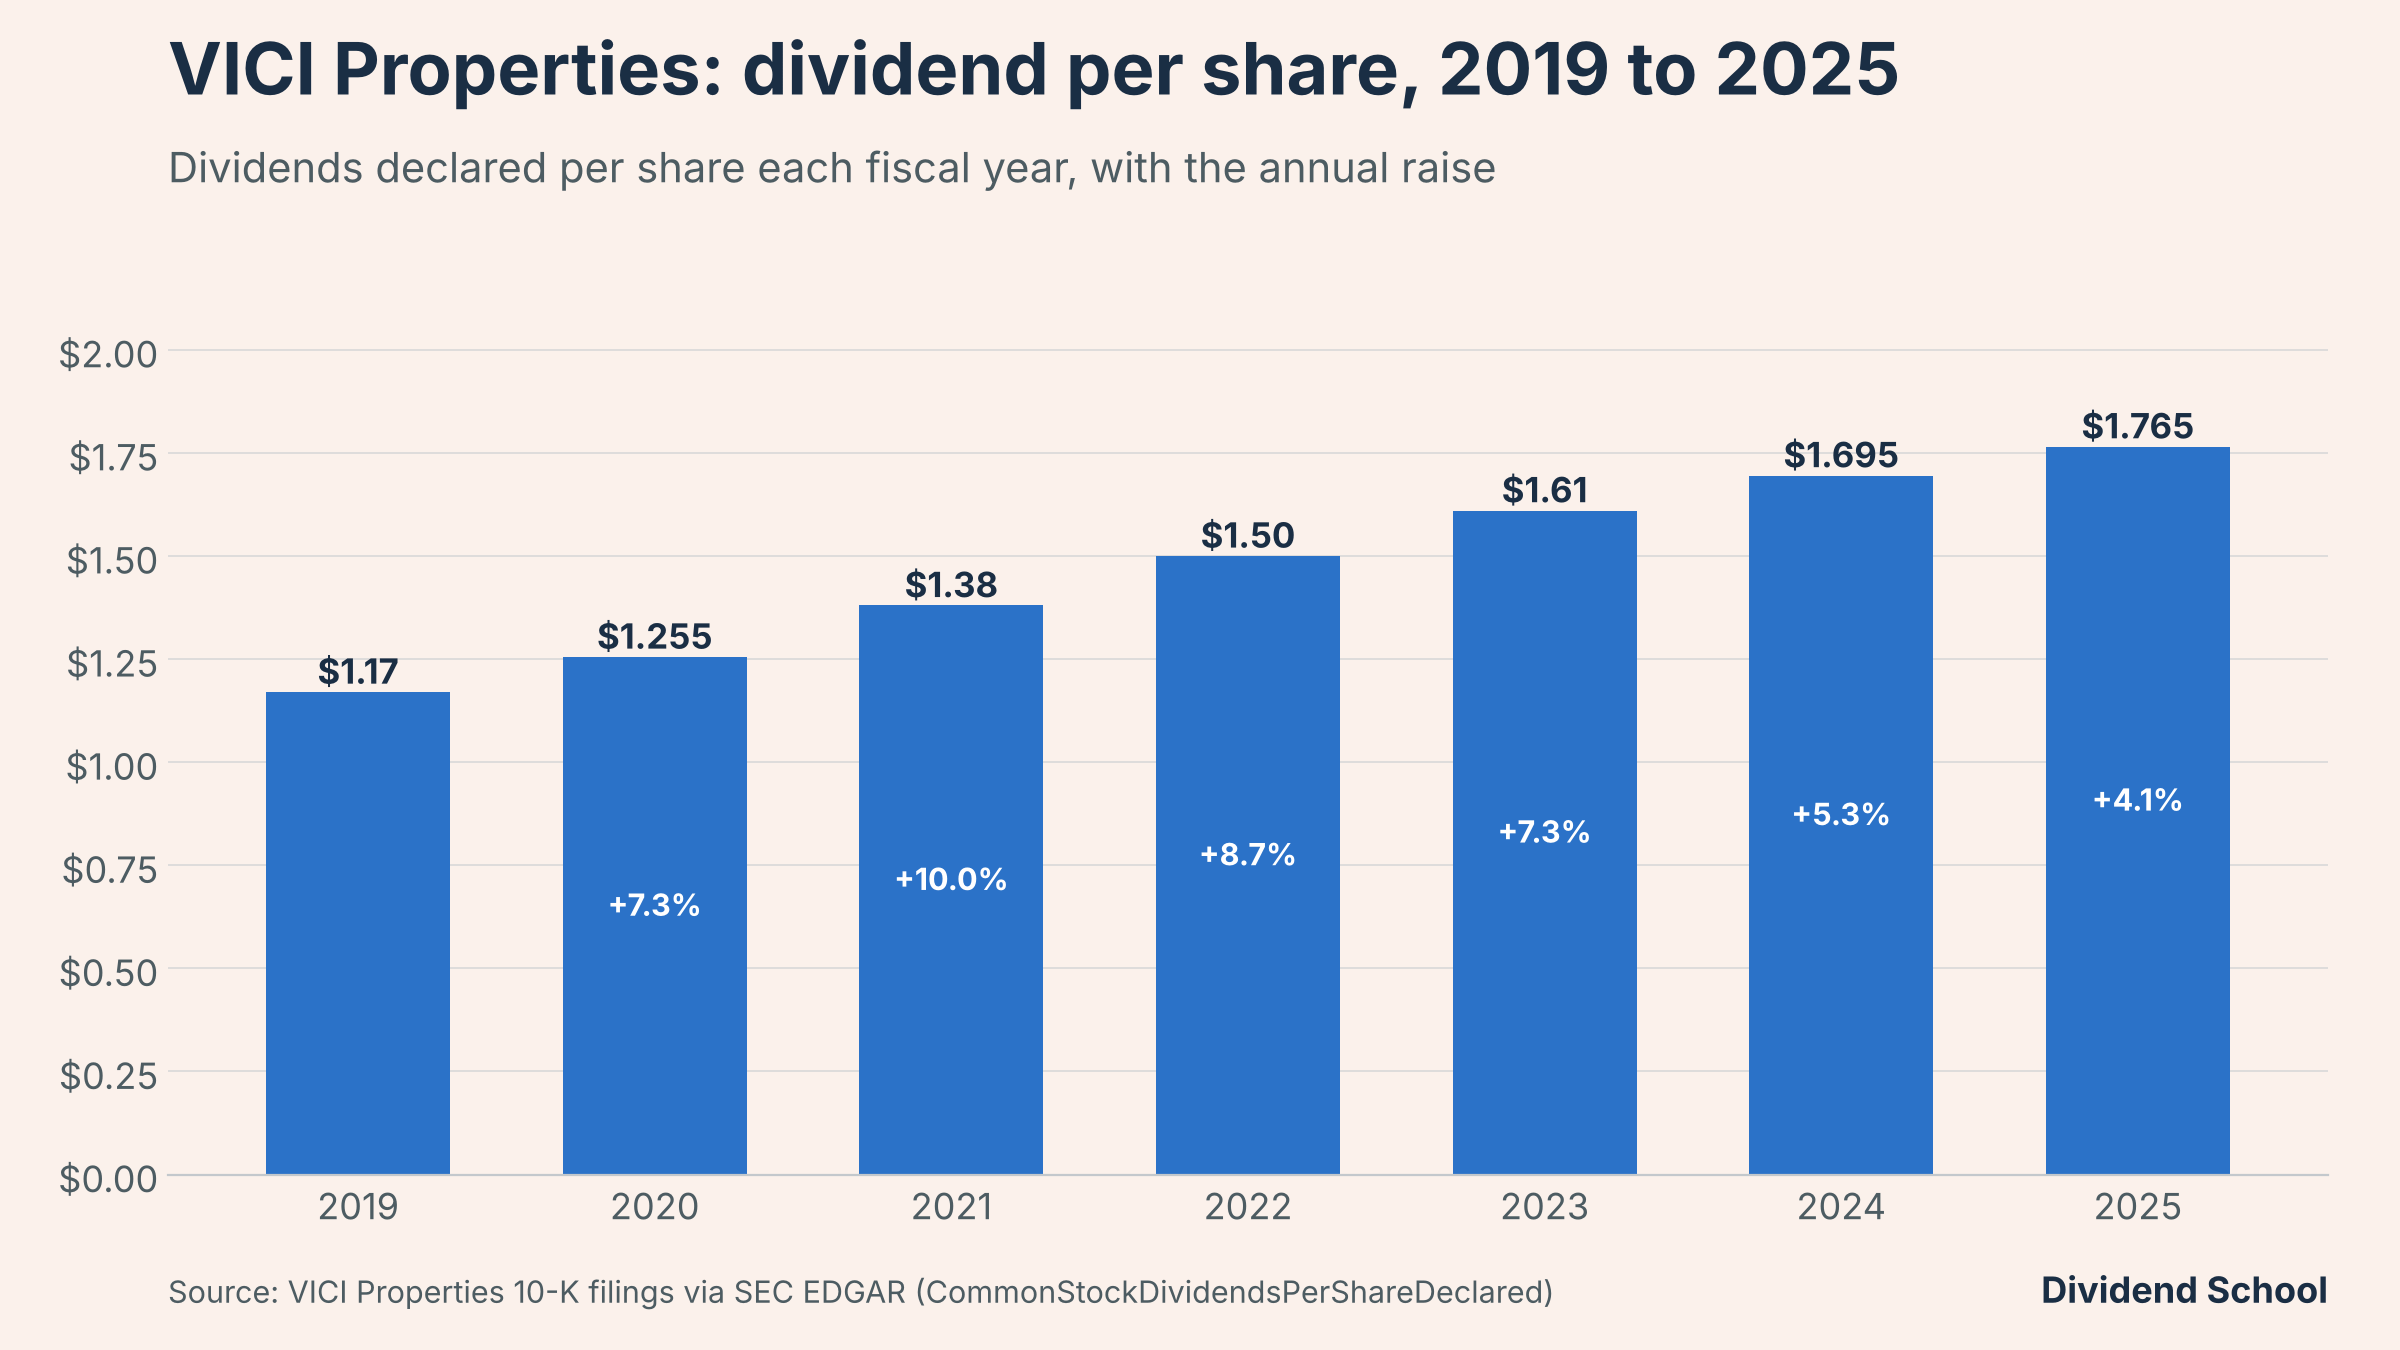
Dividend: $0.46 per quarter, $1.84 annualized, last raise 2.2%
Streak: 9 straight annual raises, every year since the 2018 IPO
Sector: Casino and experiential REIT
Why I like it
2026 AFFO guidance raised for the third time this year, to $2.47 to $2.48 per share from $2.45 to $2.47
AFFO of $0.62 a share in Q3, up 4.3%, on revenue up 5.8%
100% leased across 103 properties, with a 39.4-year weighted average lease term including extensions
98.4% of debt at fixed rates, with every 2026 maturity already refinanced
A new $2 billion buyback, 7.4% of the company at today’s price
The thesis
VICI was Pick 3 in September at $25.65. It’s 4.3% cheaper now, and before anything else, I owe you a correction.
Frankly, I missed the biggest story in my September writeup. On May 27, Caesars Entertainment, VICI’s largest tenant at 38% of its rent, agreed to be bought by Fertitta Entertainment for $31 a share, $17.6 billion including $11.9 billion of Caesars debt the buyer takes on. I blamed the bond market for VICI’s slide in September. The bond market played a part. The Caesars deal is the bigger reason.
So what does a buyout of the tenant mean for the rent?
Nothing yet, and that’s the honest answer. Caesars still pays its rent in full, VICI has recorded no charge-offs this year, and the leases run to 2035 with four five-year renewals after that. But a buyout loads the tenant with more debt. A rating agency has already downgraded Caesars’ secured debt, and in the third quarter VICI added $313.2 million to its credit-loss reserve for Caesars alone. VICI’s own explanation points at the regional lease renewals starting in 2035, and at “estimated market rent at the time of renewal.” On the call, CEO Ed Pitoniak said VICI is “analyzing every dollar” of its Caesars regional lease income.
Where does the deal stand?
Caesars shareholders approved it on September 22. The FTC asked for more information on September 14, which pushes the timeline out, and the deal can run as late as November 2027. VICI holds consent rights over a change of control under its Caesars leases, so it has a seat at the table.
Why own it anyway?
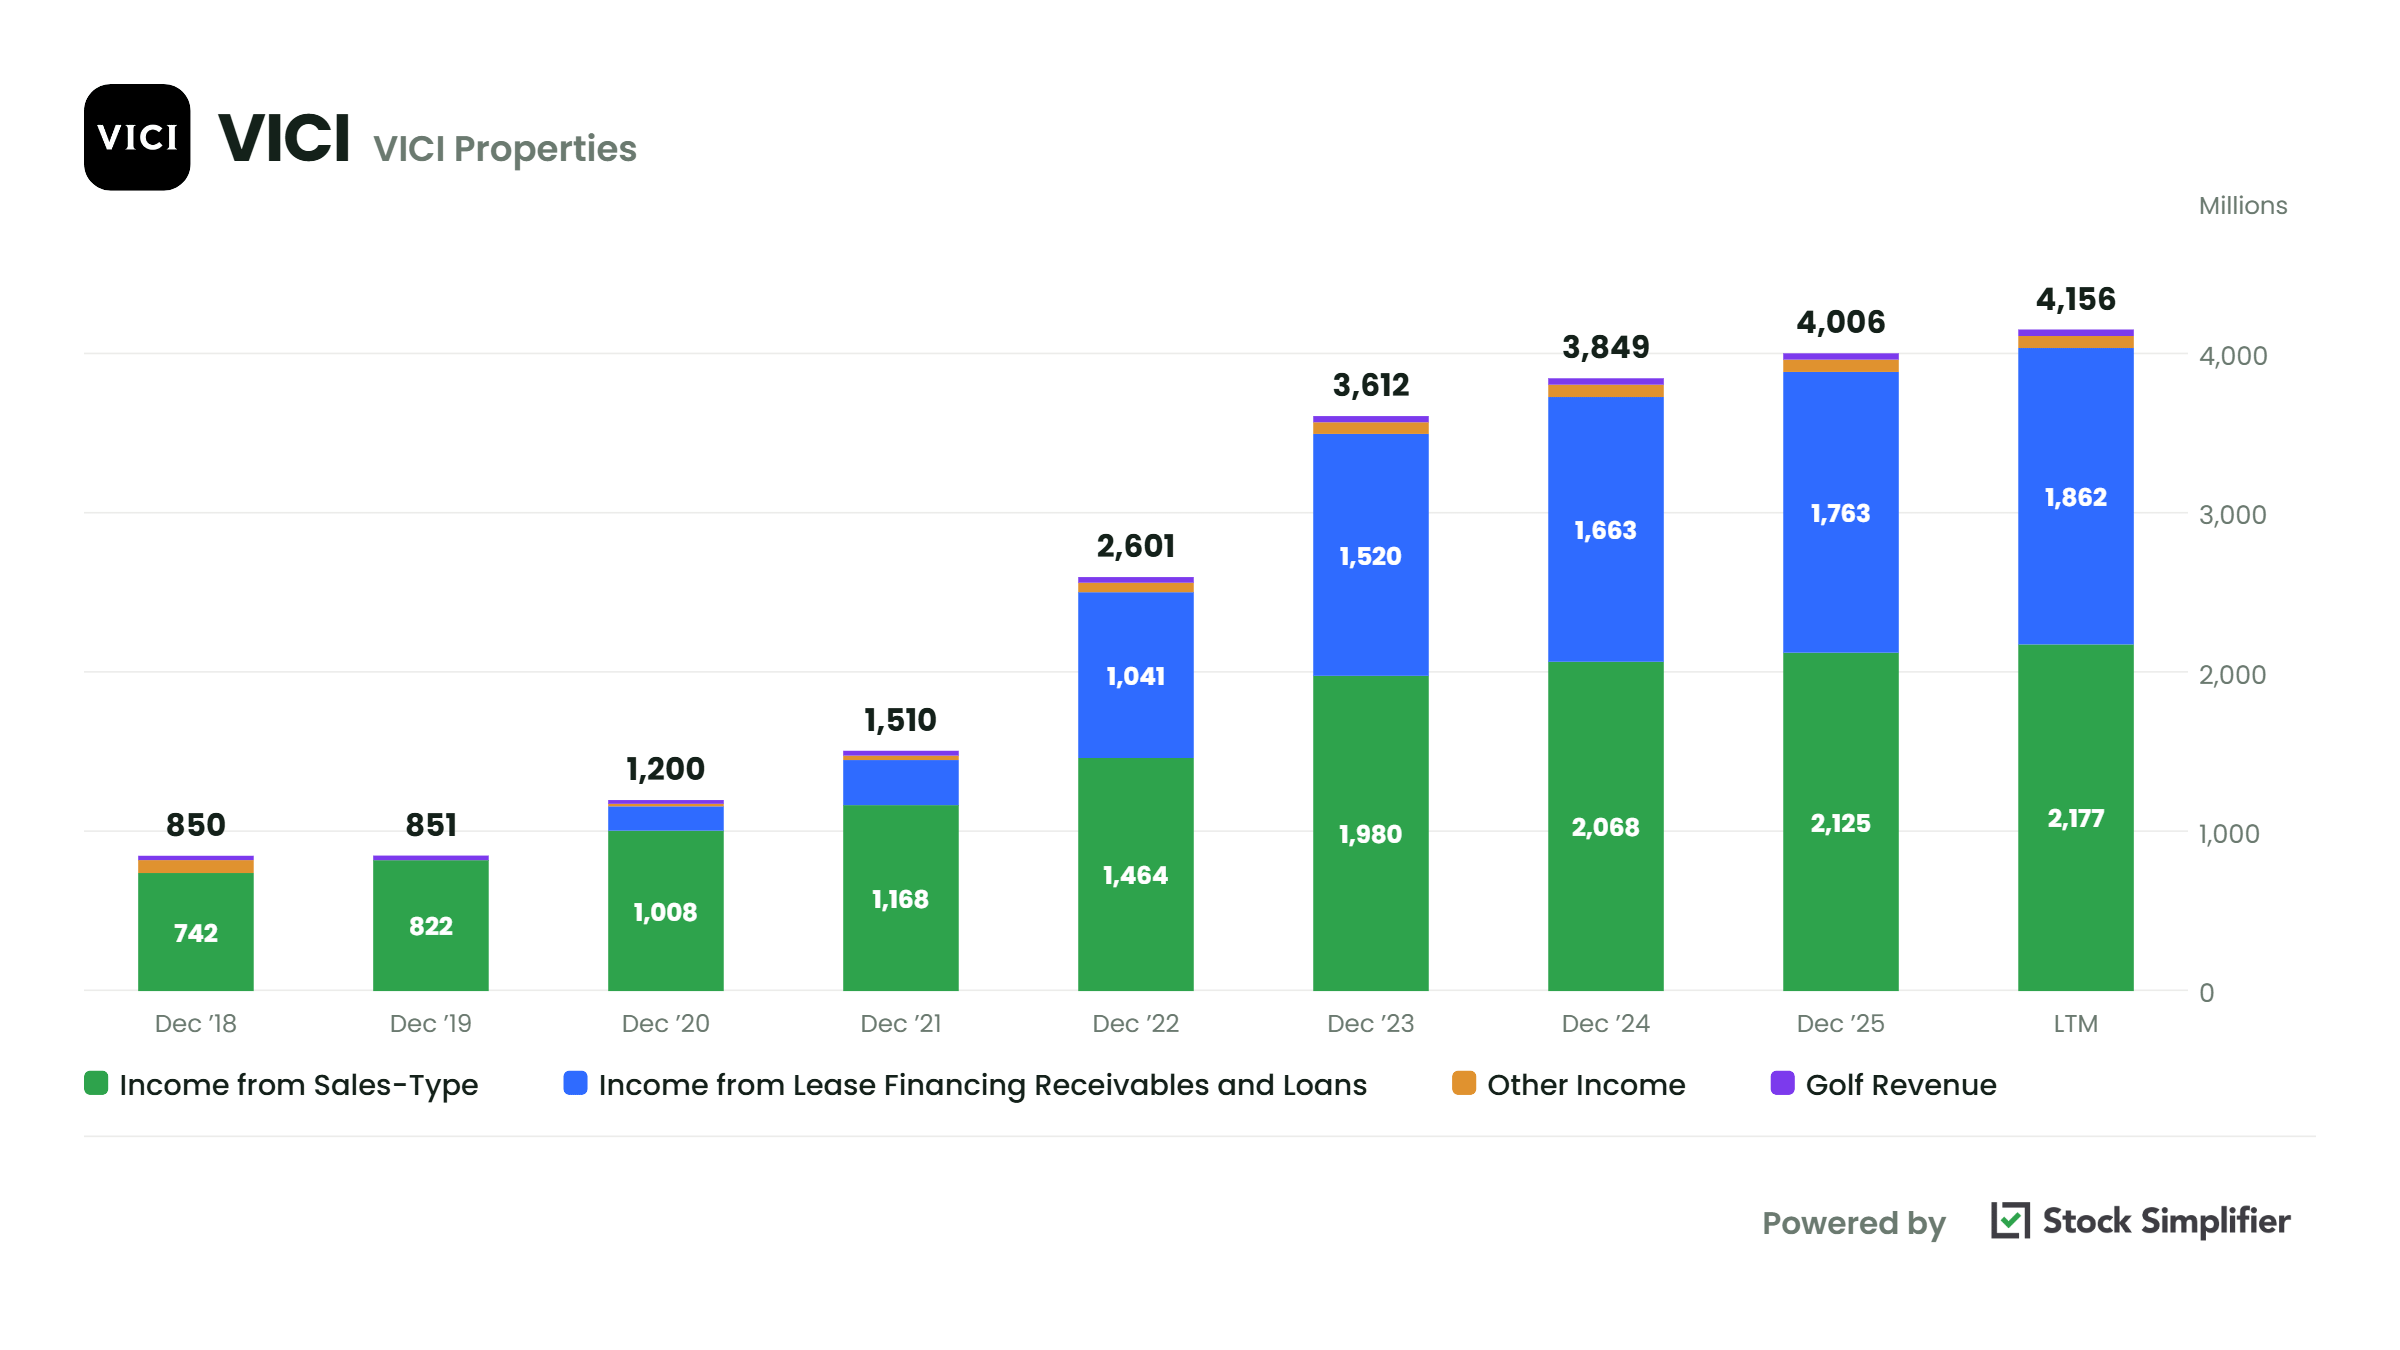
Because we get paid 7.5% to wait, and the rest of the business keeps growing. VICI owns the buildings under Caesars Palace, the MGM Grand, and dozens of regional casinos, plus newer bets in Canada, golf, and resorts. It added seven Nevada casinos from Golden Entertainment in April for $87 million a year of rent. AFFO guidance went up three times this year.
Casino landlords aren’t boring this year.
Dividend safety
We score it 4.3 out of 5, Safe. Plug VICI into a free screener this quarter and the earnings payout will look ugly:
Dividend: $1.84 a share
GAAP earnings per share, trailing twelve months: $2.16
Payout on earnings: 85%
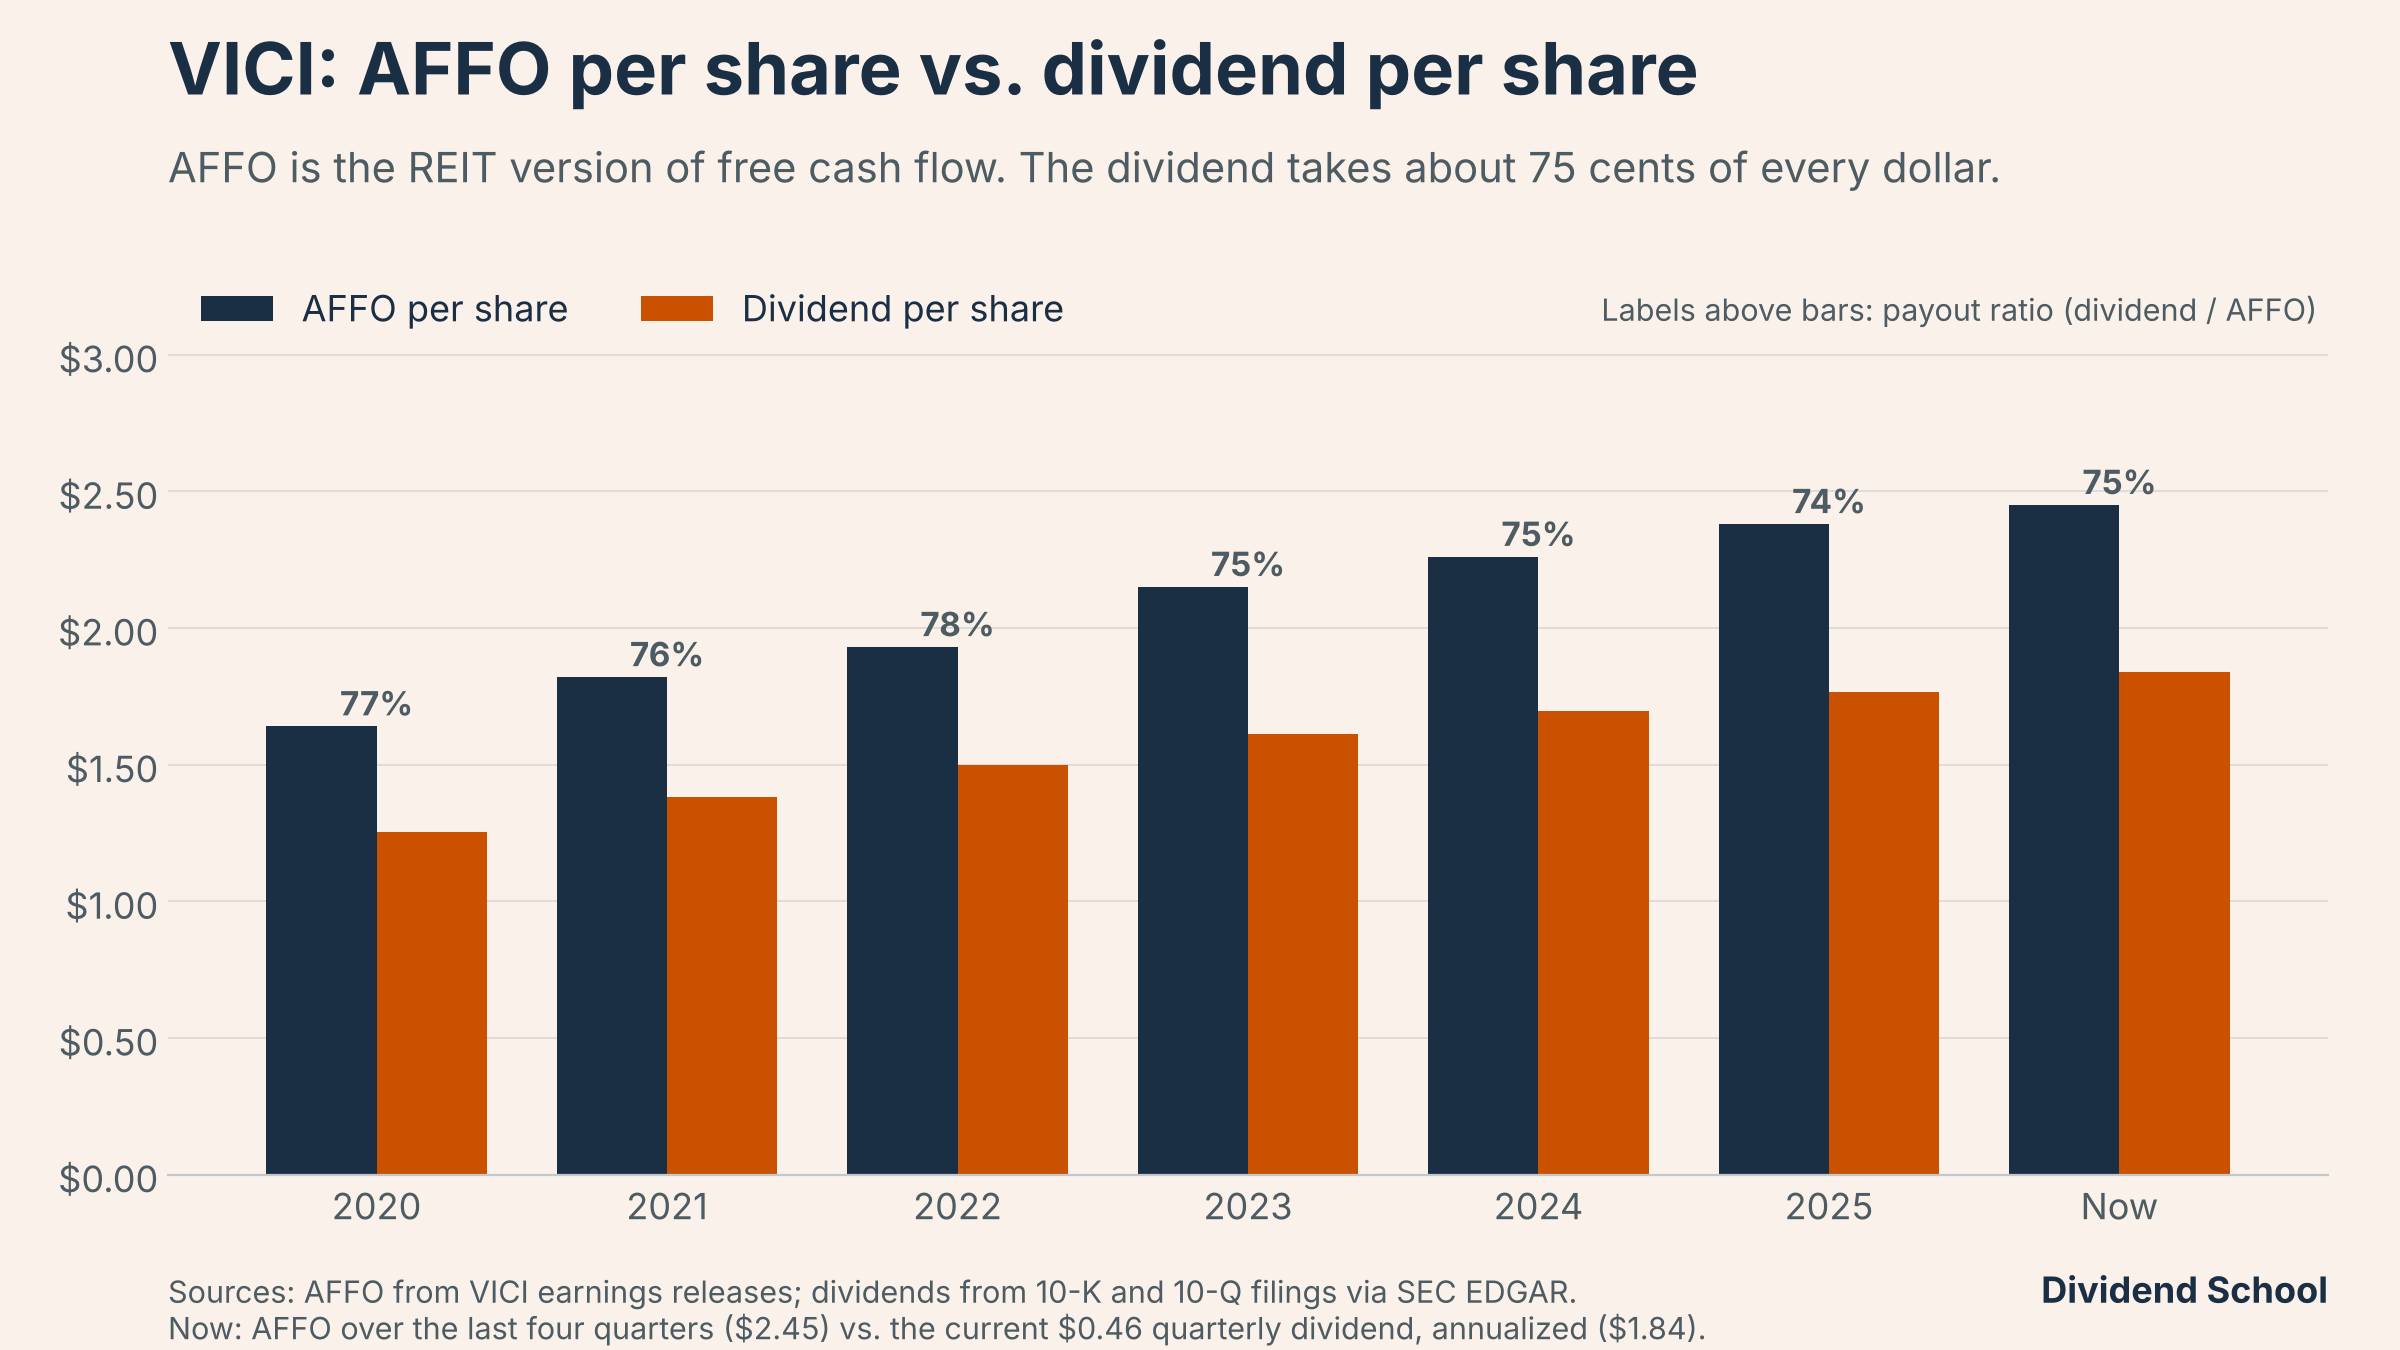
AFFO per share, trailing twelve months: $2.45
Payout on AFFO: 75%
Which one do we trust?
AFFO. It’s the REIT equivalent of free cash flow for a “normal” business, and the AFFO payout ratio is the REIT version of the payout ratio we already know. GAAP earnings took a $458 million hit in the third quarter from the credit-loss reserve, which is an accounting estimate, not cash. No rent went unpaid. Seventy-five cents of every dollar of AFFO is a normal place for a REIT.
The caveat: the two weakest inputs in our score are dividend growth and leverage. September’s raise was 2.2%, the smallest since the IPO, and the raises have shrunk six years running, from 9.1% in 2021. Net debt sits at 4.8 times adjusted EBITDA, and $3.5 billion of debt comes due in 2027 and 2028 against $2.5 billion of cash and credit line.
The score describes today: rent paid in full, a 75% payout, investment-grade ratings. Caesars is tomorrow’s question, and the score doesn’t pretend to know the answer.
Valuation: buy below $29.43
At $24.54, we’re paying 10.0 times AFFO. Over 2020 to 2025, the yearly average ran between 13.2 and 16.2 times, with a median of 14.1.
Flip it over and we get an AFFO yield of 10%. We collect 7.5% in cash and VICI keeps the rest.
How did we set the Buy Below?
With a dividend discount model, the right tool for a REIT that pays out most of its cash. I raised the return we demand to 9% for the Caesars risk and assumed 3.5% dividend growth forever. That gives a fair value of $34.63 ($1.904 / (9% - 3.5%)), and a 15% margin of safety takes the Buy Below to $29.43.
What is the market pricing in?
Run it backwards at today’s price with the same 3.5% growth, and investors are demanding an 11.3% return ($1.904 / $24.54 + 3.5%). That’s a big risk premium for a landlord whose rent is still paid in full.
At 16.6% below the Buy Below, I’m happy to collect 7.5% while the Caesars deal plays out. With 38% of the rent tied to one tenant in a buyout, I’d keep the position smaller than usual.
Green flags
AFFO per share flat or up four quarters running: $0.60, $0.61, $0.62, $0.62
No charge-offs this year, and every property 100% leased
Caesars’ rent coverage across the company is 2.6 times ($2.67 billion of adjusted EBITDA over nine months / $1.03 billion of cash rent to VICI and GLPI)
New tenants and deals: Golden Entertainment, Clairvest, and a pending Canadian lease
A $2 billion buyback authorization and no new at-the-market stock sales this year
Red flags
Caesars. It’s 38% of the rent, it’s being bought with borrowed money, its secured debt was downgraded, and VICI booked $313.2 million of reserves against it in one quarter. The deal may not close until 2027.
Dividend growth has slowed to 2.2%, down every year since 2021’s 9.1%. The payout on AFFO crept from 73% to 75%.
Refinancing. $1.5 billion comes due in February 2027, including notes at 3.75%, and $2 billion more in 2028. Replacing them will cost more, and VICI’s ratings already sit on the lowest investment-grade rung. Caesars’ Las Vegas EBITDA also fell 9.5% in Q3, ahead of a November 2027 reset on 20% of the Las Vegas rent.
That’s two complete workups, free: the full thesis, the safety math, the Buy Below price, and the flags on each.
Below the paywall, paid Dividend School Pro subscribers get:
An Aaa-rated giant growing revenue 19%, with its cloud business up 48% and $677 billion of signed contracts in the backlog, 10.5% below its Buy Below.
Last month’s Borderline teaching case, now scored 3.5: up 16.1% since October, still 10.1% below its Buy Below, and two dividends that add up to a 3.71% yield.
Our number one pick, the company whose indexes sit behind $2.9 trillion of ETFs: a 77% margin in its biggest segment, 12 straight dividend raises, and one line on the cash flow statement that changes its free cash flow by 8%.
The full board: all 31 Universe names, tiered, each against its Buy Below.
Every number is pulled from the latest 10-Ks, 10-Qs, and earnings releases, with filing dates noted so you can check my work.
Membership is $369 a year or $35 a month, with a 30-day money-back guarantee.
