

When a stock yields 7%, the market is usually telling you something. Sometimes it’s a warning. Sometimes the market is just wrong, and that’s where we make our money.
In today’s post, we will discuss:
- Why high yield and dividend growth rarely show up together
- The one number that separates a safe 7% yield from a trap
- Three stocks yielding 7%+ right now, each with a different structure and a different risk
- How to size these in your own portfolio
Okay, let’s dive in.
Why 7% yields are usually a red flag
All good businesses face the same choice with their cash: reinvest it for growth or hand it to shareholders.
A company yielding 7% is handing most of it back. That usually means the market expects little growth, or worse, it expects a dividend cut and has already marked the stock down. The yield looks juicy because the price collapsed, and the price collapsed for a reason.
So how do we tell the difference between a gift and a trap?
Coverage.
Dividend coverage measures how much cash a company generates against what it pays out. A company producing $1.30 in cash for every $1.00 of dividends has a 1.3x coverage ratio. That 30% cushion absorbs a bad quarter without forcing a cut.
One wrinkle before we look at the stocks. Each of our three companies uses a different structure, and each structure has its own coverage metric:
- Master limited partnerships (MLPs): distributable cash flow (DCF) against distributions
- Business development companies (BDCs): net investment income (NII) against dividends
- Regular corporations: free cash flow against dividends
Get the metric right for the structure and the analysis gets much easier. Let’s look at our three guinea pigs.
Stock 1: MPLX (MPLX), the growth machine
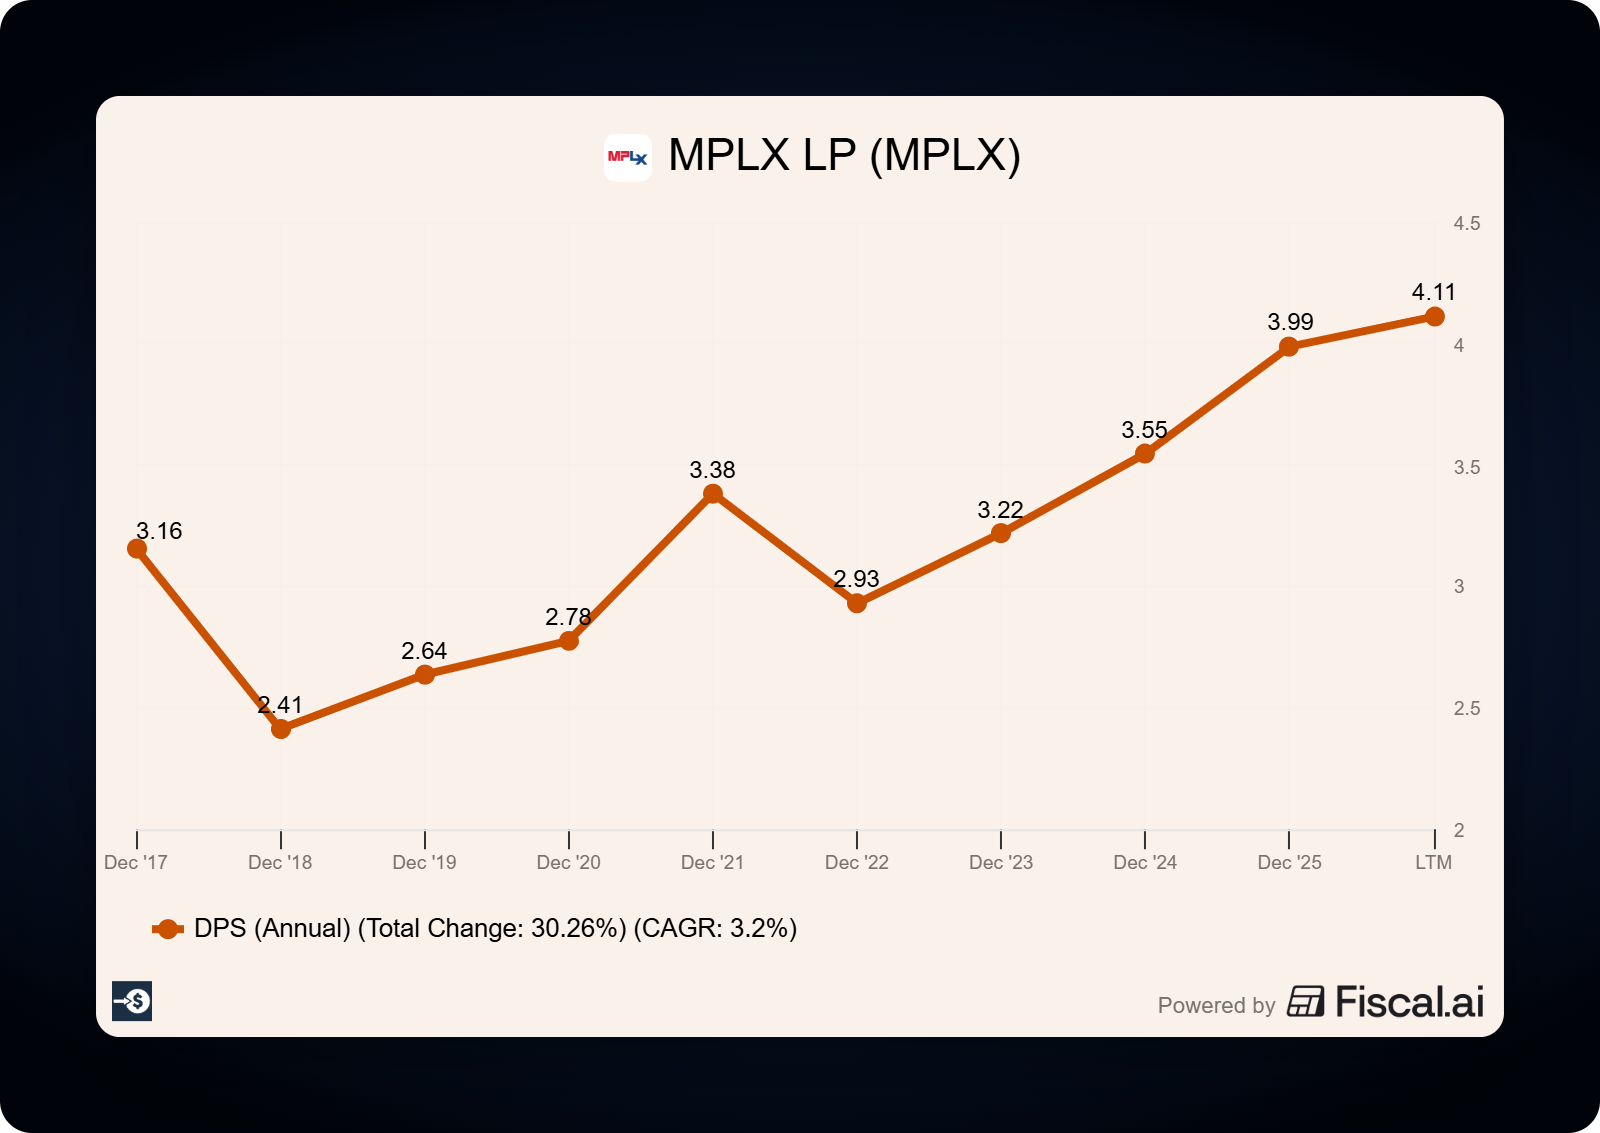
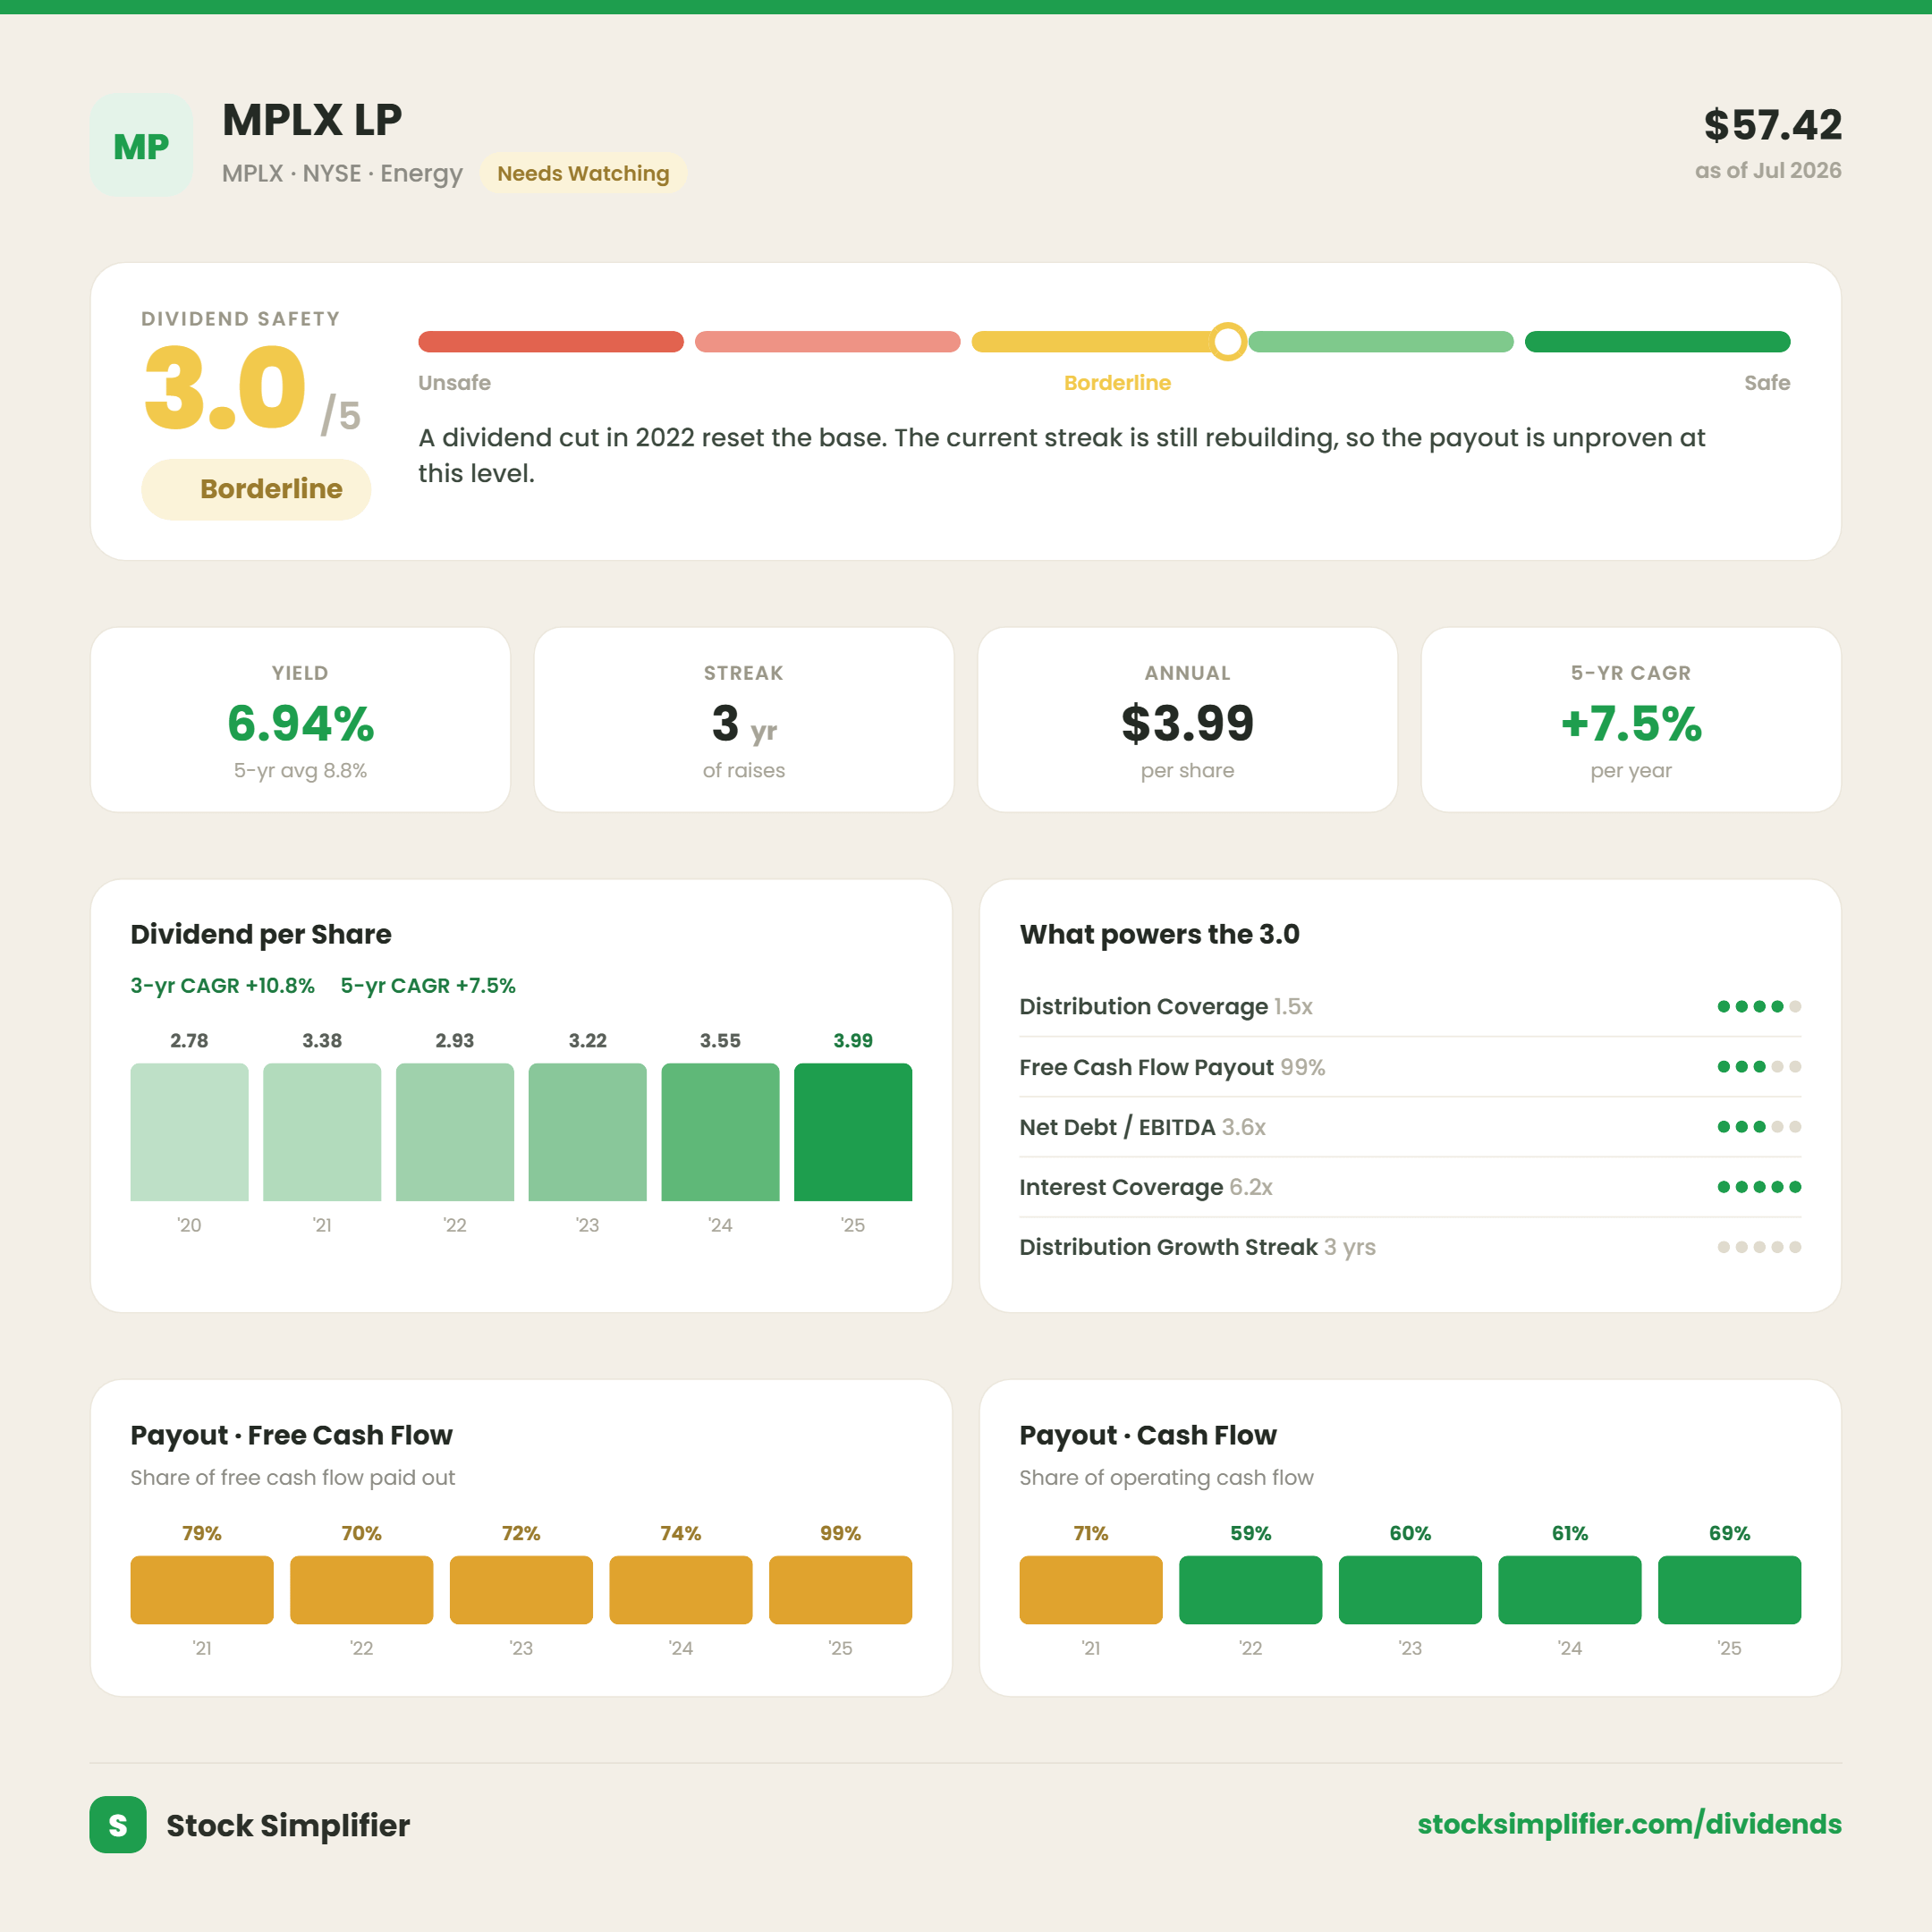
MPLX is the midstream partnership spun out of Marathon Petroleum. It owns pipelines, processing plants, and storage assets that collect fees whether oil is $50 or $90. Think of it as a toll road for energy.
Here’s the scorecard from MPLX’s first-quarter 2026 earnings release, filed as an 8-K on sec.gov:
- Distributable cash flow: $1,408 million
- Adjusted EBITDA: $1,729 million
- Distribution coverage: 1.3x
- Leverage ratio: 3.7x
- Quarterly distribution: $1.0765 per unit
At recent prices, that distribution works out to a yield of around 7.3%.
Now for the part that earns MPLX the “growth” label. The current $1.0765 distribution reflects a 12.5% increase announced in late 2025, and management has stated its intention to keep growing the payout at a similar clip through 2027, backed by new Permian processing plants coming online.
A 7.3% yield growing 12.5% a year is rare air. If management delivers, your yield on cost passes 9% within two years.
The catch: MPLX issues a K-1 tax form, which adds paperwork at tax time compared with a standard 1099. MLPs also generally don’t belong in IRAs. Know that going in.
Do you want to know which 7% yields I'd actually buy? Do you want the sizing, and the coverage math behind it? Do you want that every single week? Upgrade to paid.
Stock 2: Main Street Capital (MAIN), the monthly payer
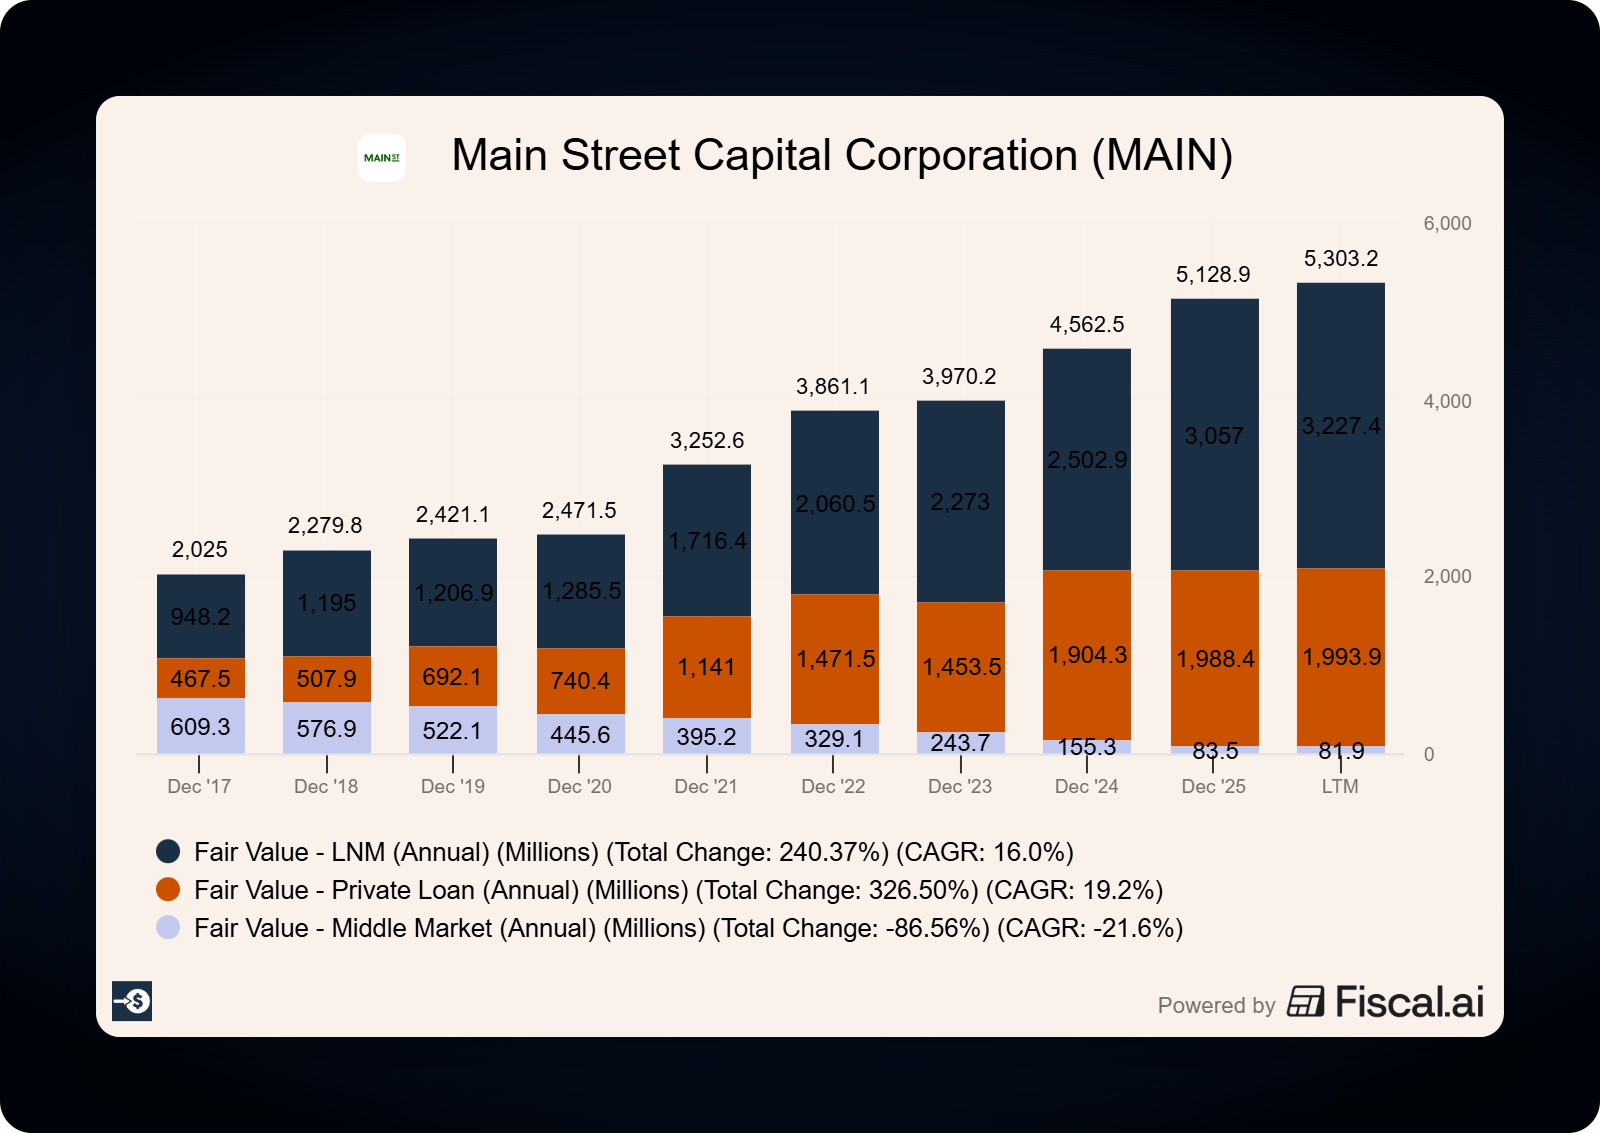
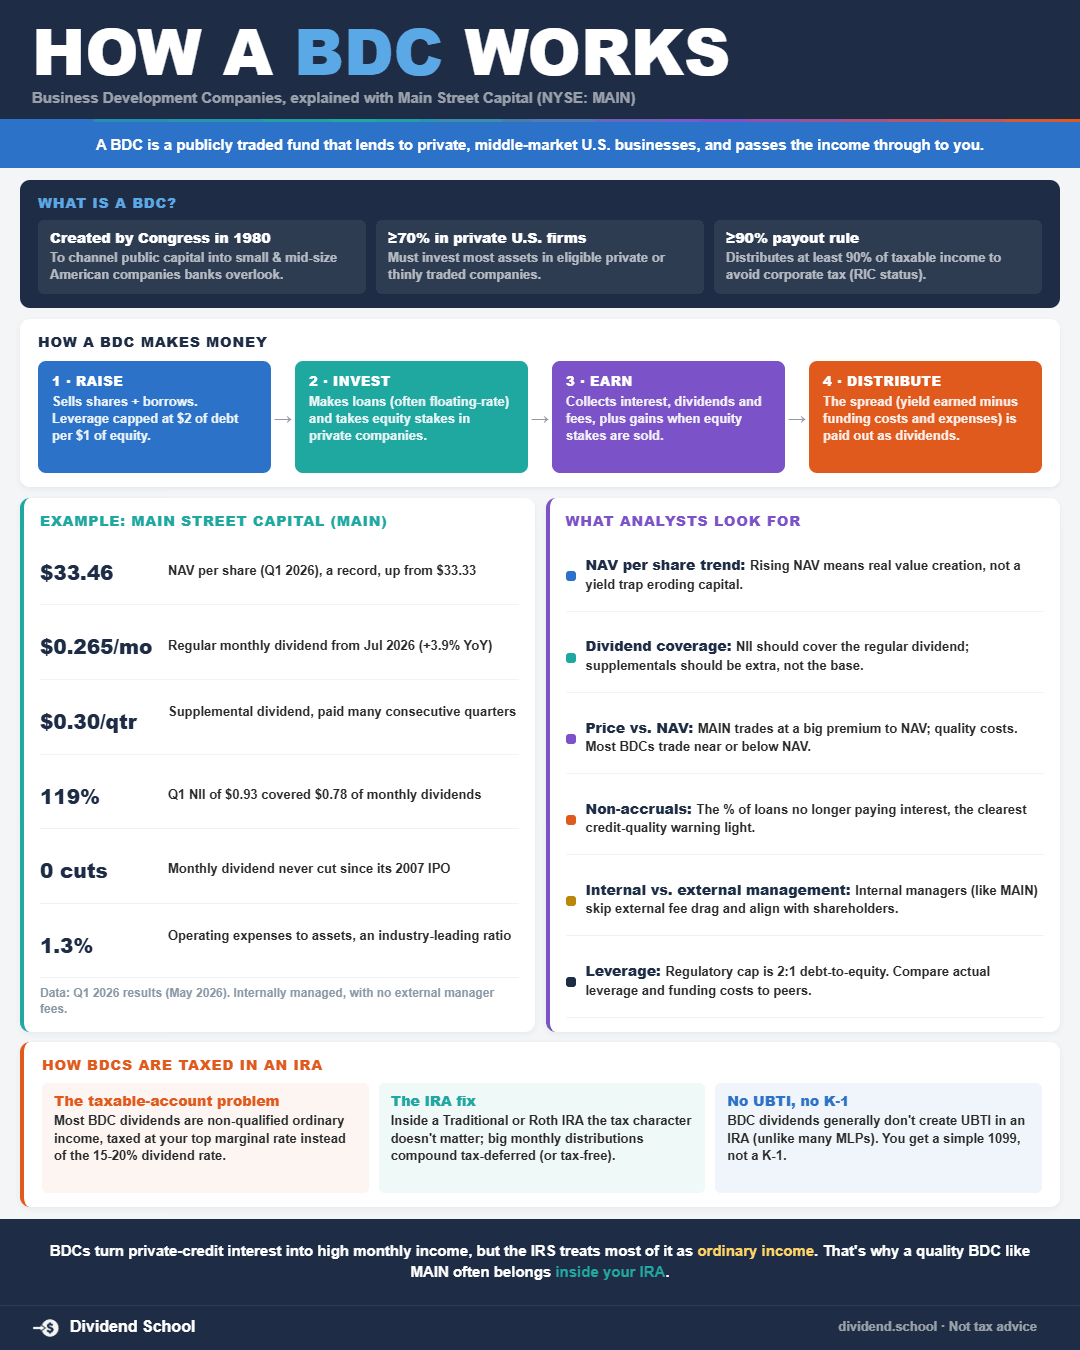
Main Street Capital is a BDC. It lends to and invests in lower middle market companies, the kind too small for Wall Street but too big for the local bank. BDCs must pay out at least 90% of taxable income to shareholders, which is why their yields run high.
Main Street is the rare BDC I’d call high quality. It manages its own portfolio in-house, with no external manager collecting fees, and it has never reduced its regular monthly dividend since its 2007 IPO.
The numbers from Main Street’s first-quarter 2026 earnings release, filed as an 8-K on sec.gov:
- Distributable net investment income: $1.00 per share
- Net asset value: $33.46 per share
- Regular monthly dividends: $0.26 per share (up 4.0% from a year earlier)
- Supplemental dividend paid in Q1: $0.30 per share
- Total dividends paid in Q1 2026: $1.08 per share
Here’s where I want you to slow down and read carefully.
Main Street’s regular monthly dividends alone yield roughly 5.6% at recent prices. The supplemental dividends push the total past 7%, and by the company’s own math, total recent declarations represented an annualized yield of 7.9% as of early May 2026.
The regulars are covered comfortably. Quarterly regular dividends of $0.78 against DNII of $1.00 per share is about 1.28x coverage. The supplementals are the variable piece. They depend on portfolio performance, and management can dial them down without technically cutting anything.
So the honest framing: you’re buying a very safe 5.6% with a well-supported bonus that has been showing up quarter after quarter. That distinction matters when you’re counting on the income.
Stock 3: Pfizer (PFE), the prove-it pick
Every high-yield list needs its controversy. Here’s ours.
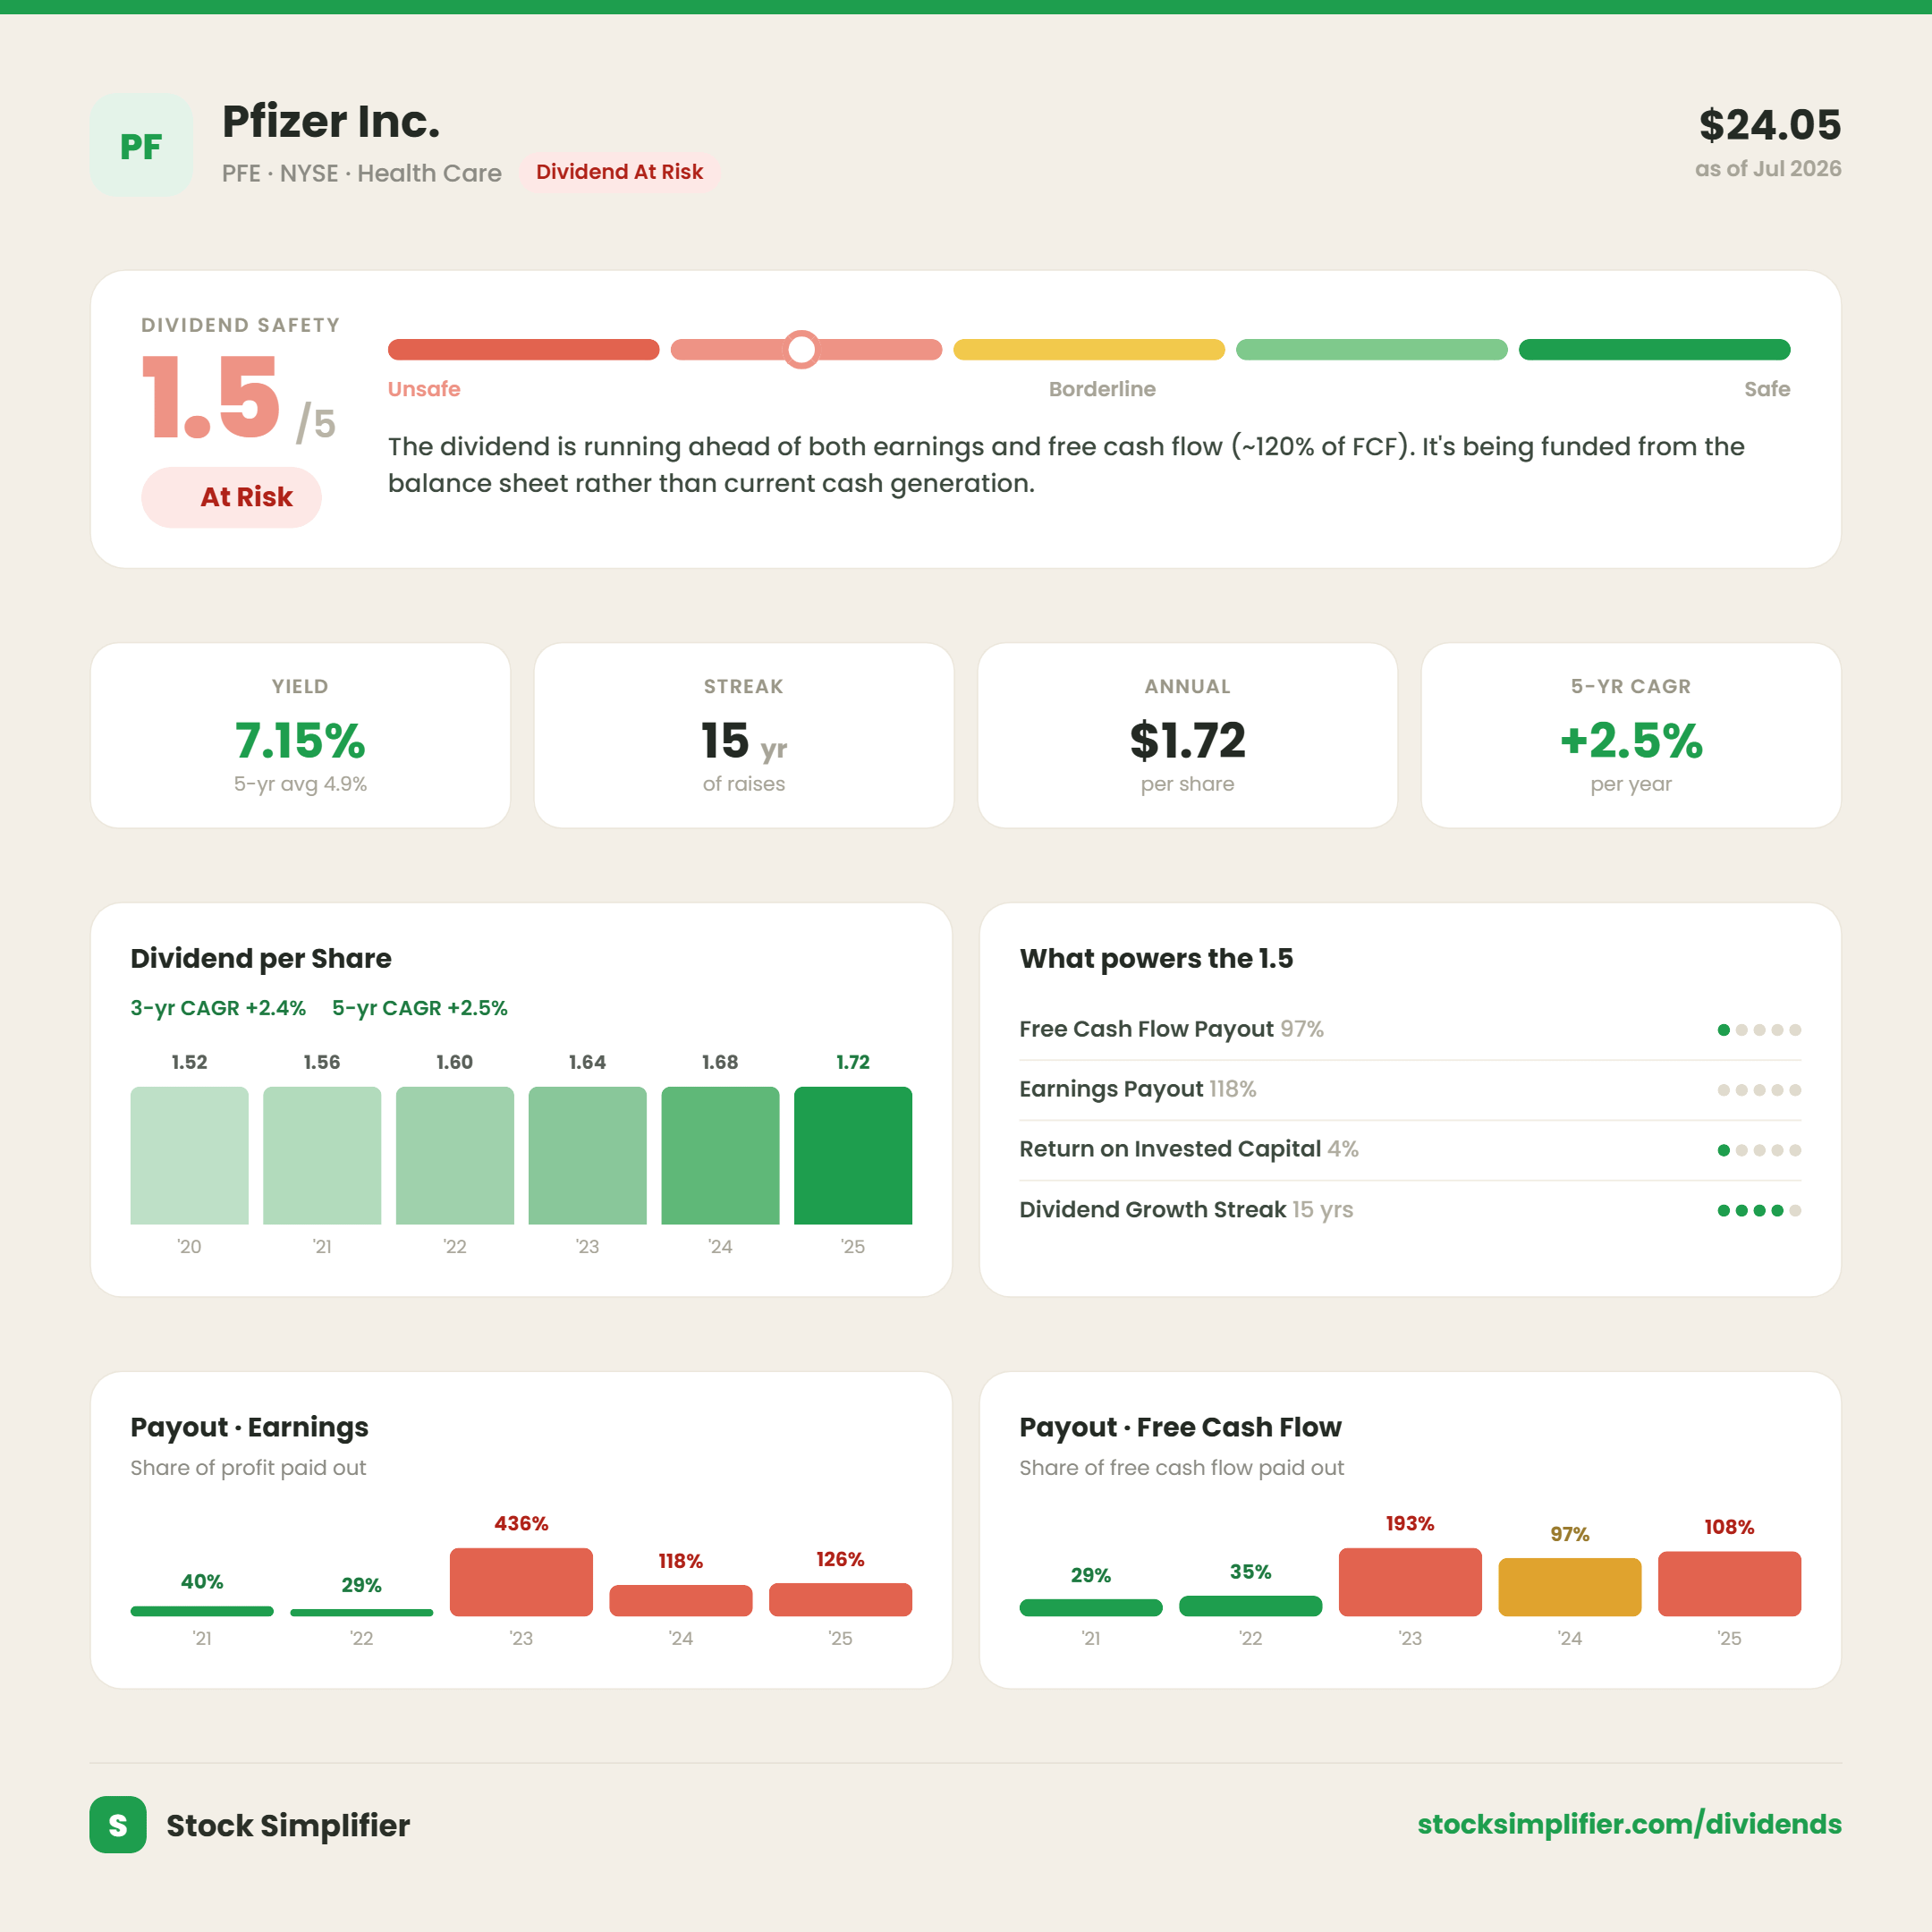
Pfizer yields roughly 7.1% as of early July 2026. That yield exists because the stock has been left for dead: COVID revenue evaporated, patent expirations loom, and investors want nothing to do with it.
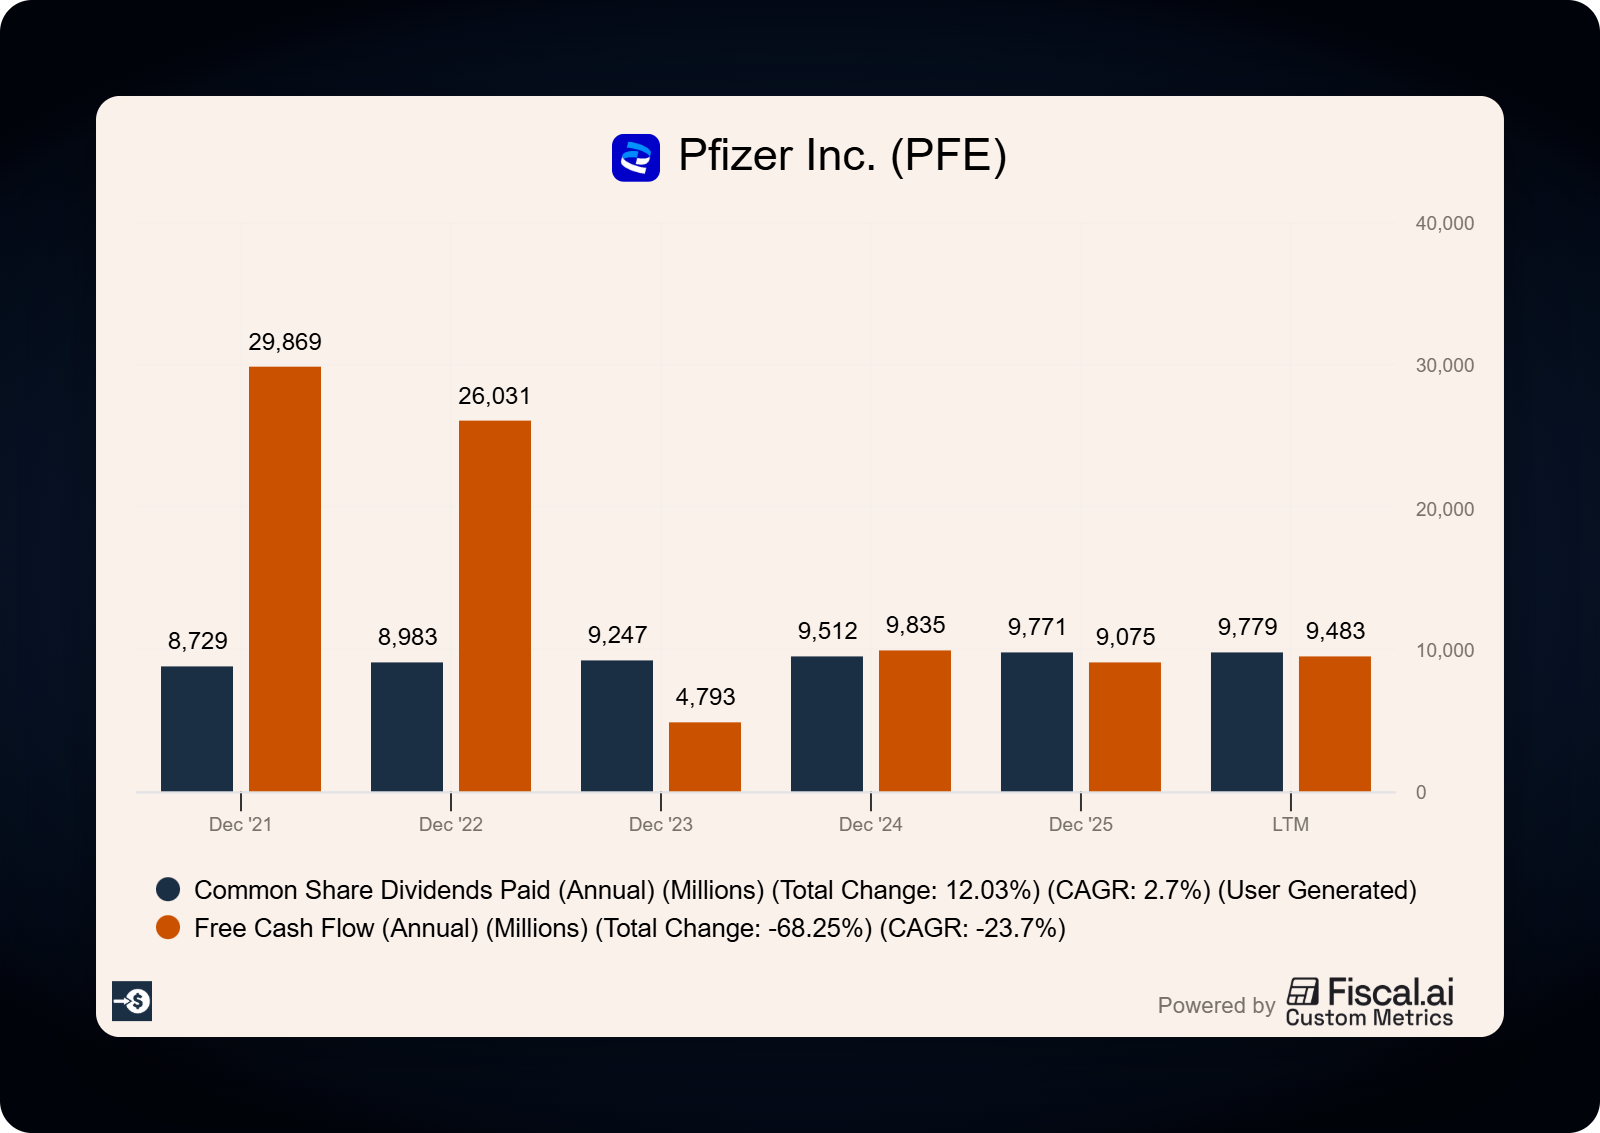
The bear case shows up right in the cash flow statement. In fiscal 2025, Pfizer paid $9.77 billion in dividends while generating $9.08 billion in free cash flow. The company paid out roughly $700 million more than it produced. First-quarter 2026 told a similar story: $2.2 billion in free cash flow against $2.4 billion in dividends paid.
Why the 15-year streak won’t save it
Pfizer has raised its dividend for 15 straight years, and that streak fools a lot of investors into assuming safety.
The payout ratios tell the real story. In 2021, the dividend consumed just 29% of free cash flow. By 2023 that figure hit 193%, and in 2025 it still sat at 108%, with the earnings payout at 126%. When a company pays out more than it earns and more than it generates in cash, the difference comes from the balance sheet: debt, asset sales, or cash reserves. A dividend funded that way survives on management’s willingness to defend it, and willingness has a shelf life.
The yield itself is the second warning.
Pfizer’s yield averaged 4.9% over the past five years, and the dividend grew only 2.5% a year over that stretch, from $1.52 per share in 2020 to $1.72 in 2025. The payout never sprinted to 7.15%. The stock price fell to meet it. Pair that with a return on invested capital near 4%, and the yield starts looking less like a gift and more like the market’s estimate of the risk. This is exactly why the coverage test comes before the yield in our process, every single time.
Pfizer’s growth potential lives in the share price more than the payout. You’re collecting 7.1% while you wait to find out if the turnaround works. That’s a fundamentally different bet than MPLX or Main Street.
How to use this in your investing process
When any stock yielding 7%+ crosses your screen, run this sequence before you buy:
1. Identify the structure first. MLP, BDC, REIT, or corporation. This tells you which coverage metric to pull and what tax form you’ll receive.
2. Calculate coverage with the right metric. Anything below 1.2x for an MLP or BDC deserves skepticism. For a corporation, free cash flow below the dividend is a flashing yellow light, as we saw with Pfizer.
3. Check the trend. One good quarter of coverage means little. Pull the last eight quarters from the filings on sec.gov.
4. Check the balance sheet. MPLX’s 3.7x leverage is manageable for a pipeline business with fee-based contracts. The same number at a cyclical company would scare me.
5. Size accordingly. The safer the coverage, the larger the position can be. My rough guide: a covered, growing payer like MPLX can be a full position. A turnaround like Pfizer gets 1%, at most.
Common mistakes with high yielders
The biggest mistake is buying yield without understanding where it comes from. A 10% yield with 0.9x coverage will cost you more in price decline than it ever pays in income.
The second mistake is treating supplemental dividends as guaranteed. Main Street’s supplementals have been steady, but they’re structurally optional. Build your income plan on the regulars and treat the rest as a bonus.
The third one catches even experienced investors: taxes. MLP distributions come with K-1s and don’t belong in retirement accounts. BDC dividends are mostly taxed as ordinary income, so they fit best inside an IRA or 401(k). The same yield can produce very different after-tax income depending on where you hold it.
And a limitation worth naming: coverage ratios tell you about today. They can’t tell you whether Pfizer’s pipeline delivers or whether energy volumes hold up in a recession. Coverage buys the company time to work through problems. It doesn’t erase them.
The takeaway: a 7% yield is only as good as the cash flow behind it, so check the coverage before you fall in love with the income.
As always, thanks for taking the time to read this post, and I hope you find something of value in your investing journey.
If I can further assist, please don’t hesitate to reach out.
Until next time, take care and be safe,
Dave
P.S. - You just ran the coverage test on MPLX, Main Street, and Pfizer. Paid subscribers get this every week: a full analysis of one dividend stock, the verdict, the position sizing, and the coverage math shown step by step. If today's lesson was useful, that's what the paid tier is.
---
*Data sources: MPLX Q1 2026 earnings release (8-K, sec.gov, May 2026); Main Street Capital Q1 2026 earnings release (8-K, sec.gov, May 2026); Pfizer Q1 2026 earnings release (May 2026) and fiscal 2025 cash flow data. Yields as of early July 2026 market prices.*